$LAB
📊 $LAB • Estado Atual e Perspectiva Técnica
🔹 Projeto e Desenvolvimentos Recentes
A LAB é um token de infraestrutura multi-cadeia que combina negociação à vista, limite e perpétua sob um mesmo teto, formando um ecossistema de negociação. Graças ao seu motor de pesquisa em IA, analisa oportunidades de negociação e visa oferecer estratégias acionáveis aos seus utilizadores. A oferta total é de 1 bilhão de LAB, com aproximadamente 230,4 milhões atualmente em circulação; no entanto, o float negociável é bastante baixo, cerca de 77 milhões de tokens, o que aumenta a volatilidade. Recentemente, o fluxo de notícias sobre o lançamento antecipado do aplicativo móvel impulsionou fortemente o preço.
🔸 Dados de Mercado ao Vivo
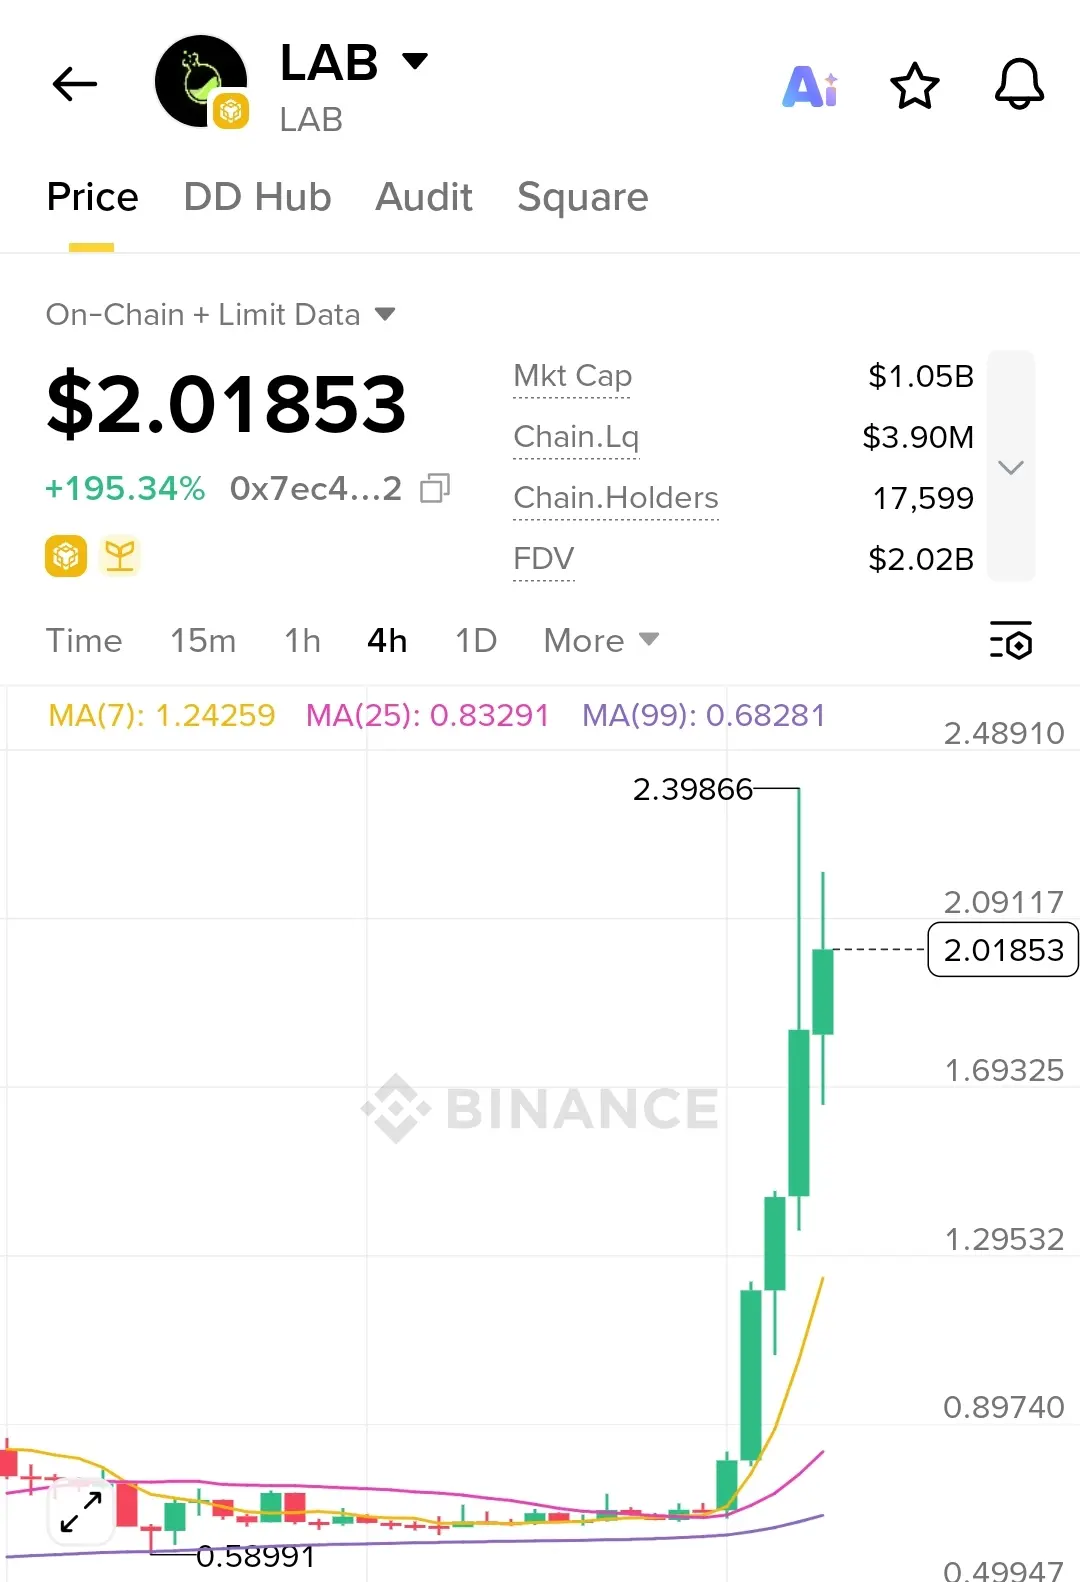
• Capitalização de Mercado: Aproximadamente 500 milhões de dólares
• Volume de Negociação em 24 Horas: Mais de 373 milhões de dólares
• Oferta Total: 1 bilhão de LAB
• Oferta em Circulação: 230,4 milhões de LAB (apenas cerca de 77 milhões em circulação livre)
🔸 Perspectiva Técnica de 1 Hora
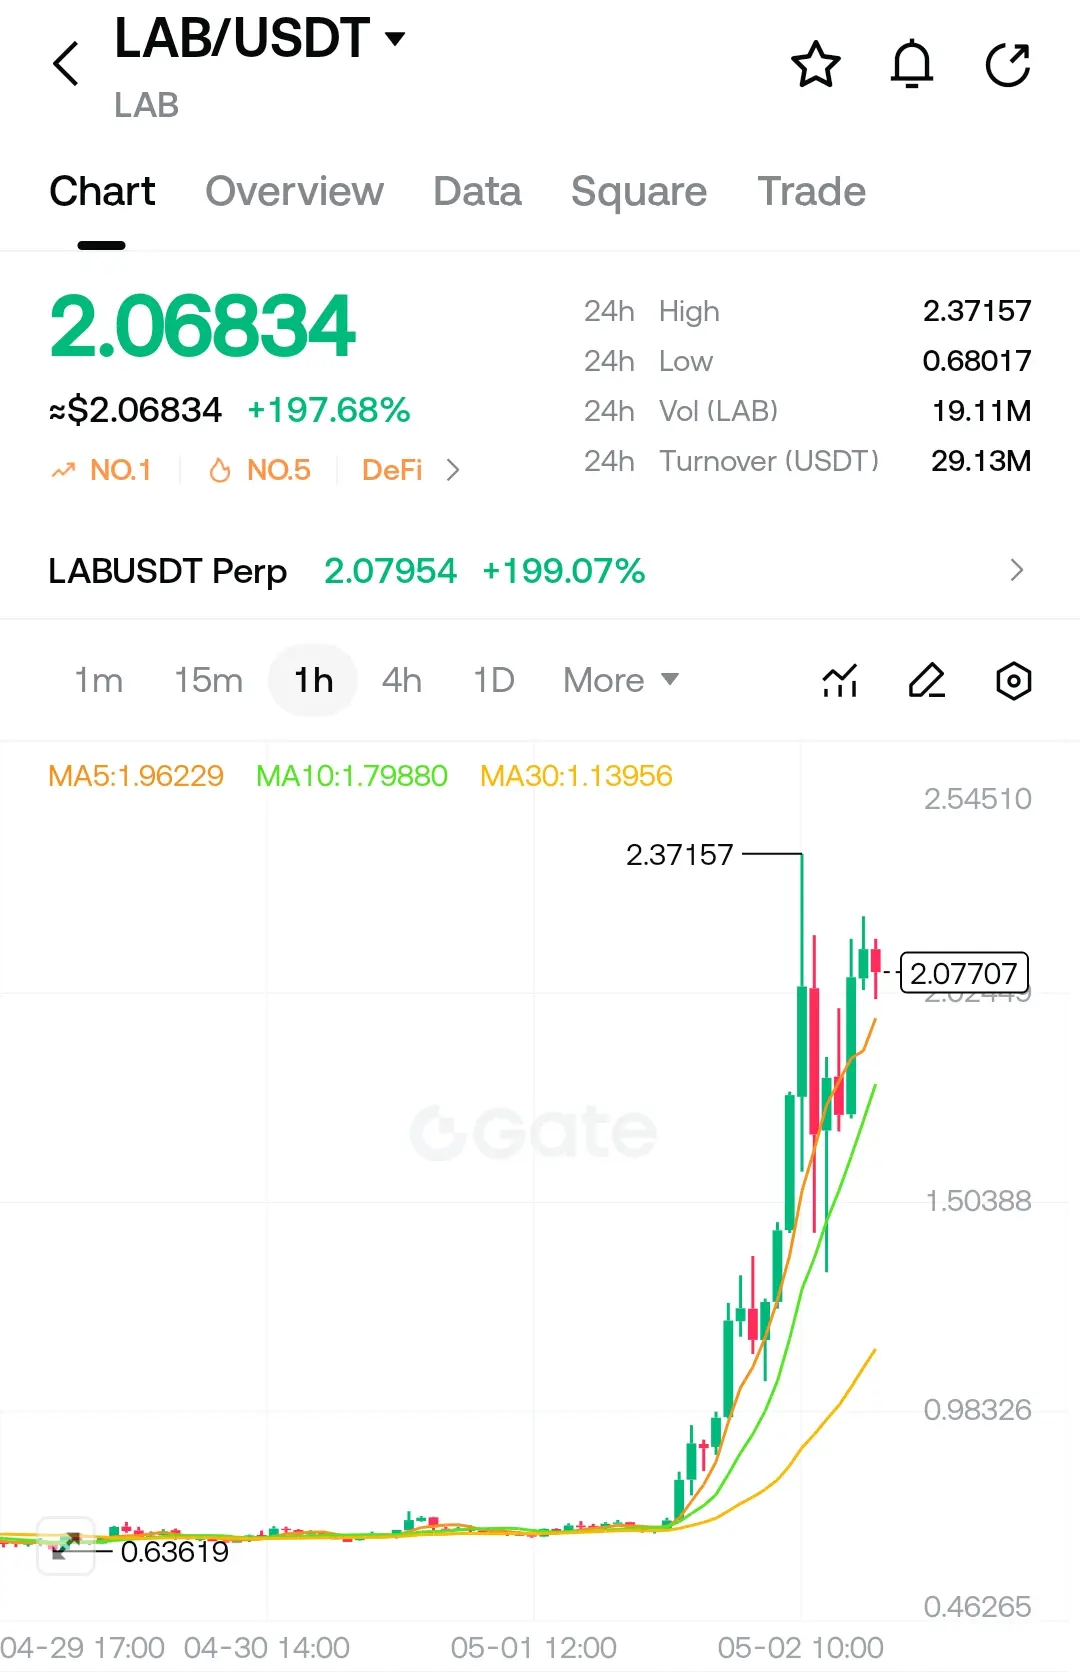
O preço apresenta volatilidade extrema e está negociando bem acima de suas máximas históricas. Um salto abrupto de $0,68 para $2,95 ocorreu nas últimas 24 horas. As médias móveis de curto prazo permanecem significativamente abaixo do preço, e os indicadores de momentum apontam para a região de sobrecompra. O aumento extraordinário no volume de negociação e o aumento de posições em aberto sugerem uma forte entrada de liquidez do mercado de derivativos por trás do movimento.
Níveis Chave:
• Suporte Psicológico: $2,00 (fechamento horário abaixo deste nível pode quebrar a estrutura)
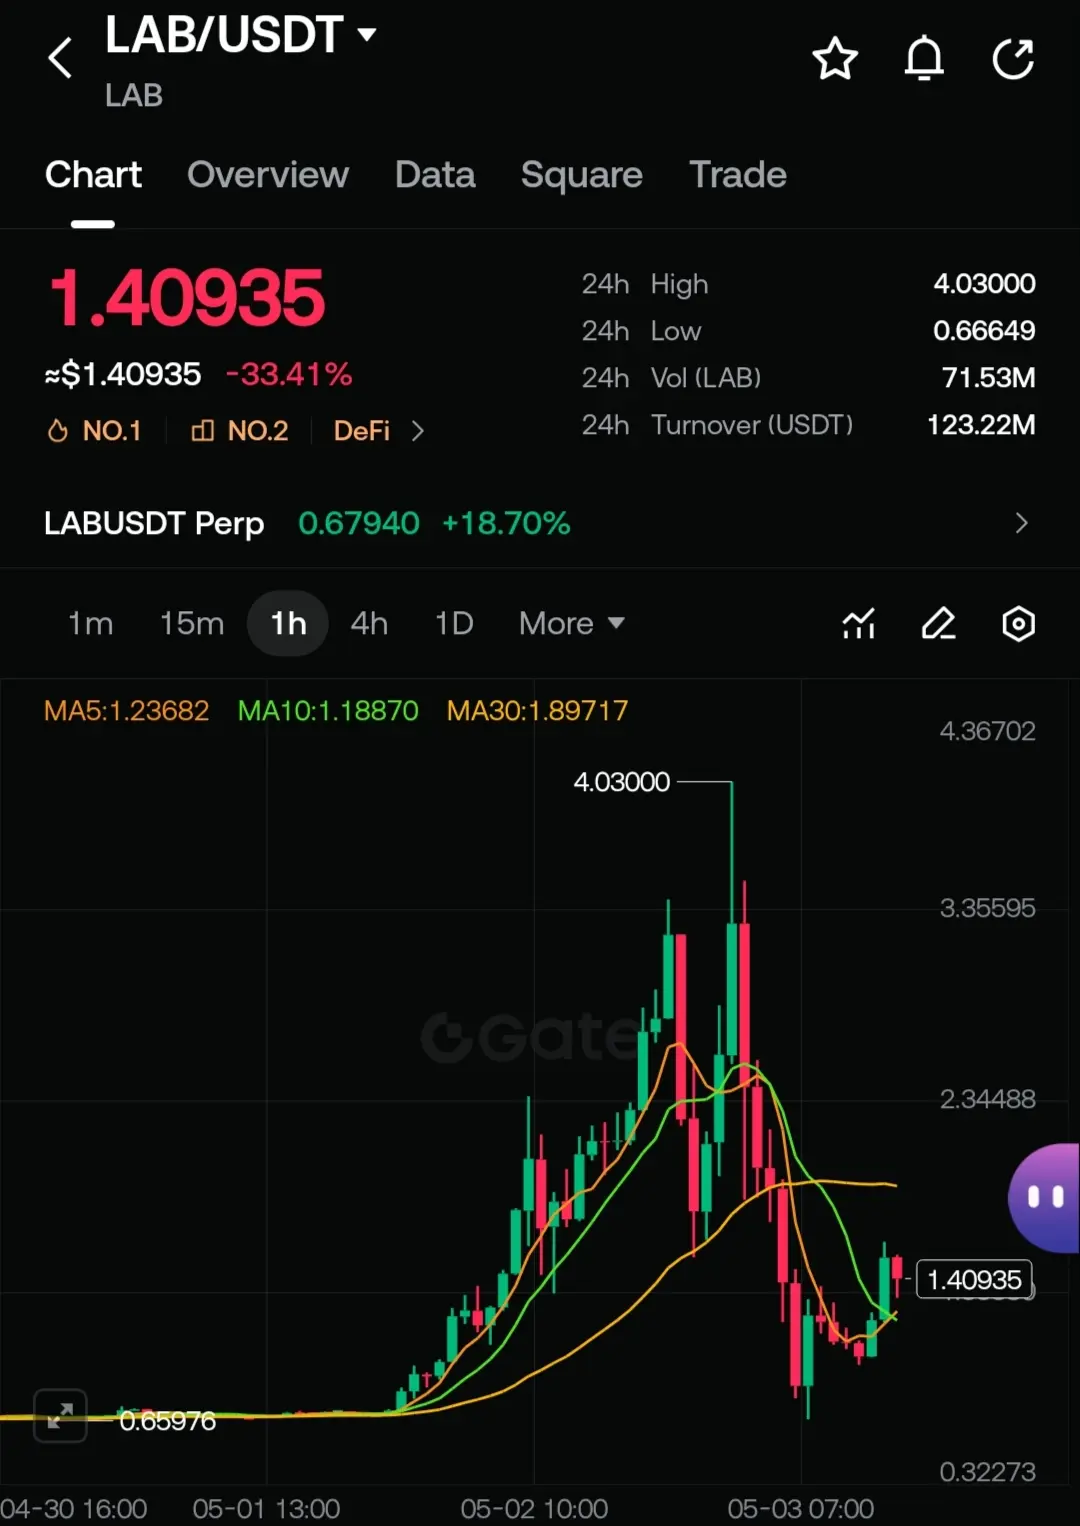
• Suporte Principal: faixa de $1,31 – $1,00 (gap de liquidez descendente)
• Resistência: faixa de $3,00 a $4,00 – $5,00 (alvos de expansão da tendência de alta)
🔸 Avaliação Fundamental
O cumprimento do compromisso de lançamento do aplicativo móvel no roteiro do projeto é considerado um forte sinal fundamental, pois indica a precificação de uma entrega real, e não expectativas especulativas. Após o Evento de Geração de Token (TGE) em outubro de 2025, a equipe recomprou 20,9 milhões de tokens LAB, fornecendo suporte à oferta no valor de aproximadamente $2,35 milhões. A estrutura deflacionária de tokenomics e a narrativa de IA tornam o projeto atraente no médio prazo. No entanto, o float extremamente baixo, devido ao fato de que uma grande parte da oferta em circulação está bloqueada, pode levar a movimentos de preço acentuados tanto para cima quanto para baixo.
🔸 Fatores de Risco
· Movimentos de Insider/ Baleias: Nas últimas 24 horas, uma carteira suspeita que acumulou 575.000 LAB a um custo médio de $0,20 antes da alta obteve aproximadamente $1,13 milhão de lucro. Tais transações pontuais levantam questões sobre a justiça do mercado. · Pressão de Derivativos: $12,7 milhões em liquidações ocorreram em 24 horas, dos quais $8,71 milhões foram de posições short — indicando que o movimento foi devido a um aperto de alavancagem (short squeeze) e não crescimento orgânico. · Float Baixo: A escassez de oferta negociável permite manipulação de preços fácil.
🔸 Estratégia ⚠️ (Não é Conselho de Investimento)
Se o preço se mantiver acima de $2,00 e fechar acima deste nível semanalmente, uma potencial expansão para a faixa de $4,00 – $5,00 pode ser considerada. Um fechamento abaixo de $2,00 no gráfico de uma hora, no entanto, pode sinalizar uma quebra do padrão e uma correção acentuada em direção ao gap de liquidez de $1,31 a $1,00. Com o nível atual de volatilidade, é importante limitar o tamanho das posições e negociar em etapas.
⚠️ Aviso: Este post é apenas para fins informativos e não constitui aconselhamento de investimento. Ativos cripto envolvem alto risco; recomenda-se fortemente que você realize sua própria pesquisa antes de negociar.
#GateSquareMayTradingShare #LAB #CryptoAnalysis
📊 $LAB • Estado Atual e Perspectiva Técnica
🔹 Projeto e Desenvolvimentos Recentes
A LAB é um token de infraestrutura multi-cadeia que combina negociação à vista, limite e perpétua sob um mesmo teto, formando um ecossistema de negociação. Graças ao seu motor de pesquisa em IA, analisa oportunidades de negociação e visa oferecer estratégias acionáveis aos seus utilizadores. A oferta total é de 1 bilhão de LAB, com aproximadamente 230,4 milhões atualmente em circulação; no entanto, o float negociável é bastante baixo, cerca de 77 milhões de tokens, o que aumenta a volatilidade. Recentemente, o fluxo de notícias sobre o lançamento antecipado do aplicativo móvel impulsionou fortemente o preço.
🔸 Dados de Mercado ao Vivo
• Capitalização de Mercado: Aproximadamente 500 milhões de dólares
• Volume de Negociação em 24 Horas: Mais de 373 milhões de dólares
• Oferta Total: 1 bilhão de LAB
• Oferta em Circulação: 230,4 milhões de LAB (apenas cerca de 77 milhões em circulação livre)
🔸 Perspectiva Técnica de 1 Hora
O preço apresenta volatilidade extrema e está negociando bem acima de suas máximas históricas. Um salto abrupto de $0,68 para $2,95 ocorreu nas últimas 24 horas. As médias móveis de curto prazo permanecem significativamente abaixo do preço, e os indicadores de momentum apontam para a região de sobrecompra. O aumento extraordinário no volume de negociação e o aumento de posições em aberto sugerem uma forte entrada de liquidez do mercado de derivativos por trás do movimento.
Níveis Chave:
• Suporte Psicológico: $2,00 (fechamento horário abaixo deste nível pode quebrar a estrutura)
• Suporte Principal: faixa de $1,31 – $1,00 (gap de liquidez descendente)
• Resistência: faixa de $3,00 a $4,00 – $5,00 (alvos de expansão da tendência de alta)
🔸 Avaliação Fundamental
O cumprimento do compromisso de lançamento do aplicativo móvel no roteiro do projeto é considerado um forte sinal fundamental, pois indica a precificação de uma entrega real, e não expectativas especulativas. Após o Evento de Geração de Token (TGE) em outubro de 2025, a equipe recomprou 20,9 milhões de tokens LAB, fornecendo suporte à oferta no valor de aproximadamente $2,35 milhões. A estrutura deflacionária de tokenomics e a narrativa de IA tornam o projeto atraente no médio prazo. No entanto, o float extremamente baixo, devido ao fato de que uma grande parte da oferta em circulação está bloqueada, pode levar a movimentos de preço acentuados tanto para cima quanto para baixo.
🔸 Fatores de Risco
· Movimentos de Insider/ Baleias: Nas últimas 24 horas, uma carteira suspeita que acumulou 575.000 LAB a um custo médio de $0,20 antes da alta obteve aproximadamente $1,13 milhão de lucro. Tais transações pontuais levantam questões sobre a justiça do mercado. · Pressão de Derivativos: $12,7 milhões em liquidações ocorreram em 24 horas, dos quais $8,71 milhões foram de posições short — indicando que o movimento foi devido a um aperto de alavancagem (short squeeze) e não crescimento orgânico. · Float Baixo: A escassez de oferta negociável permite manipulação de preços fácil.
🔸 Estratégia ⚠️ (Não é Conselho de Investimento)
Se o preço se mantiver acima de $2,00 e fechar acima deste nível semanalmente, uma potencial expansão para a faixa de $4,00 – $5,00 pode ser considerada. Um fechamento abaixo de $2,00 no gráfico de uma hora, no entanto, pode sinalizar uma quebra do padrão e uma correção acentuada em direção ao gap de liquidez de $1,31 a $1,00. Com o nível atual de volatilidade, é importante limitar o tamanho das posições e negociar em etapas.
⚠️ Aviso: Este post é apenas para fins informativos e não constitui aconselhamento de investimento. Ativos cripto envolvem alto risco; recomenda-se fortemente que você realize sua própria pesquisa antes de negociar.
#GateSquareMayTradingShare #LAB #CryptoAnalysis