
NoPardon
Trade
Trading Type
Spot
Trade crypto freely
Alpha
Points
Get promising tokens in streamlined on-chain trading
Pre-Market
Trade new tokens before they are officially listed
Margin
Magnify your profit with leverage
Convert & Block Trading
0 Fees
Trade any size with no fees and no slippage
Leveraged Tokens
Get exposure to leveraged positions simply
Futures
Futures
Hundreds of contracts settled in USDT or BTC
Options
HOT
Trade European-style vanilla options
Unified Account
Maximize your capital efficiency
Demo Trading
Futures Kickoff
Get prepared for your futures trading
Futures Events
Participate in events to win generous rewards
Demo Trading
Use virtual funds to experience risk-free trading
Earn
Launch
CandyDrop
Collect candies to earn airdrops
Launchpool
Quick staking, earn potential new tokens
HODLer Airdrop
Hold GT and get massive airdrops for free
Launchpad
Be early to the next big token project
Alpha Points
NEW
Trade on-chain assets and enjoy airdrop rewards!
Futures Points
NEW
Earn futures points and claim airdrop rewards
Investment
Simple Earn
Earn interests with idle tokens
Auto-Invest
Auto-invest on a regular basis
Dual Investment
Buy low and sell high to take profits from price fluctuations
Soft Staking
Earn rewards with flexible staking
Crypto Loan
0 Fees
Pledge one crypto to borrow another
Lending Center
One-stop lending hub
VIP Wealth Hub
Customized wealth management empowers your assets growth
Private Wealth Management
Customized asset management to grow your digital assets
Quant Fund
Top asset management team helps you profit without hassle
Staking
Stake cryptos to earn in PoS products
BTC Staking
HOT
Stake BTC and earn 10% APR
GUSD Minting
Use USDT/USDC to mint GUSD for treasury-level yields
More
- Reward
- 1
- 1
- Repost
- Share
JiangLiuSun :
:
Already shorted, but unfortunately didn't short at 0.3I don't really know if this counts as good or not.
View Original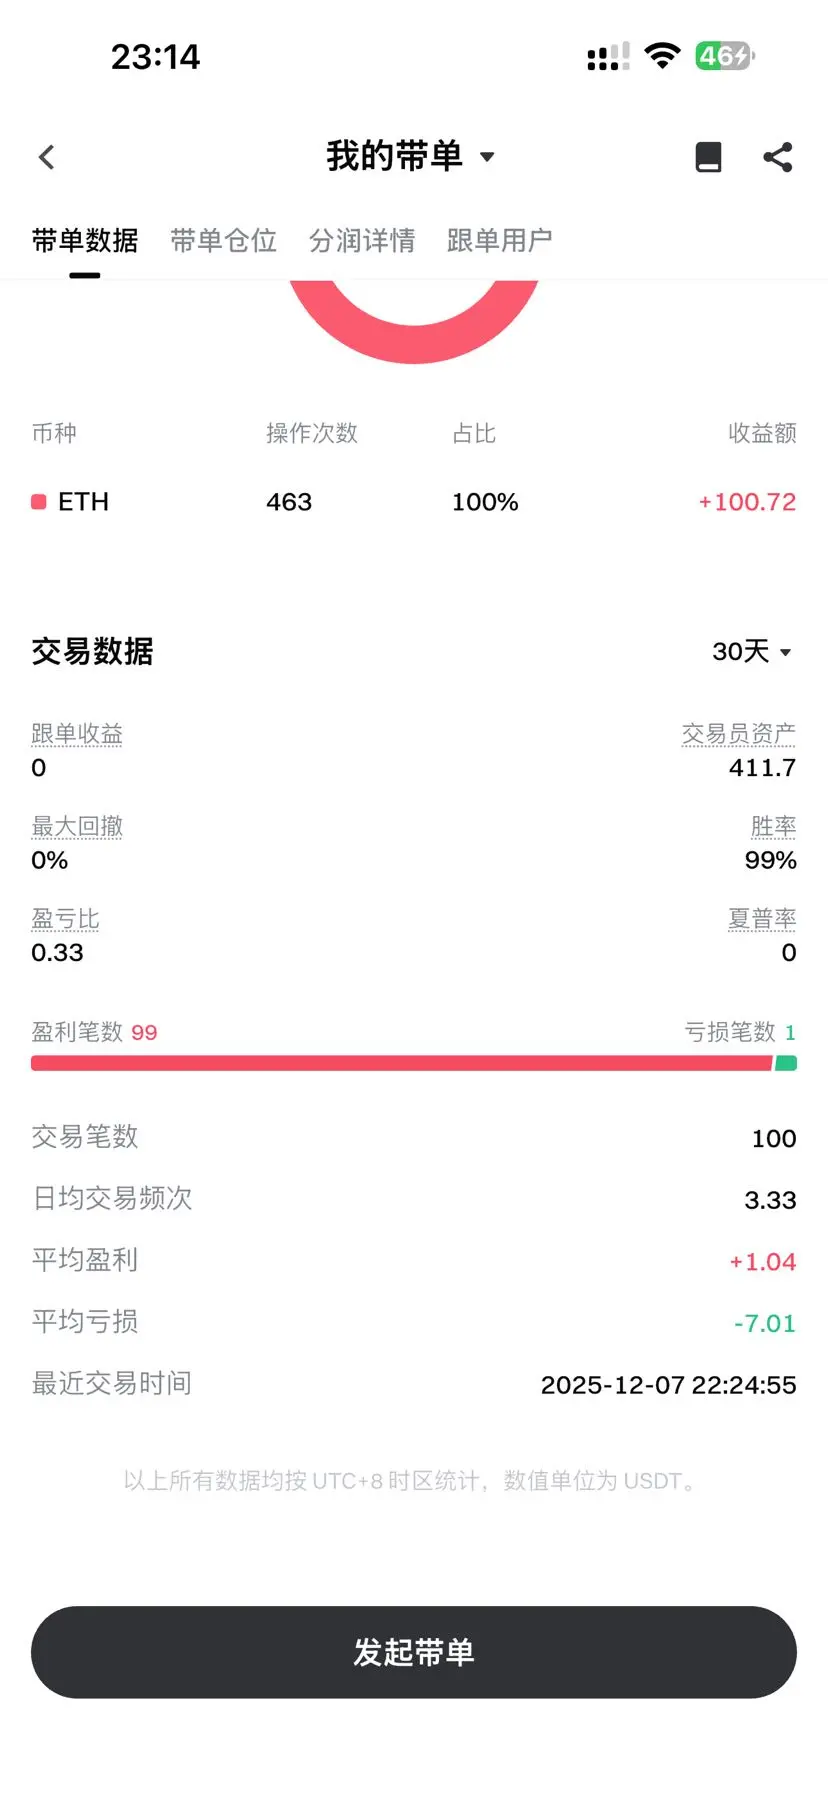

[The user has shared his/her trading data. Go to the App to view more.]
- Reward
- like
- Comment
- Repost
- Share
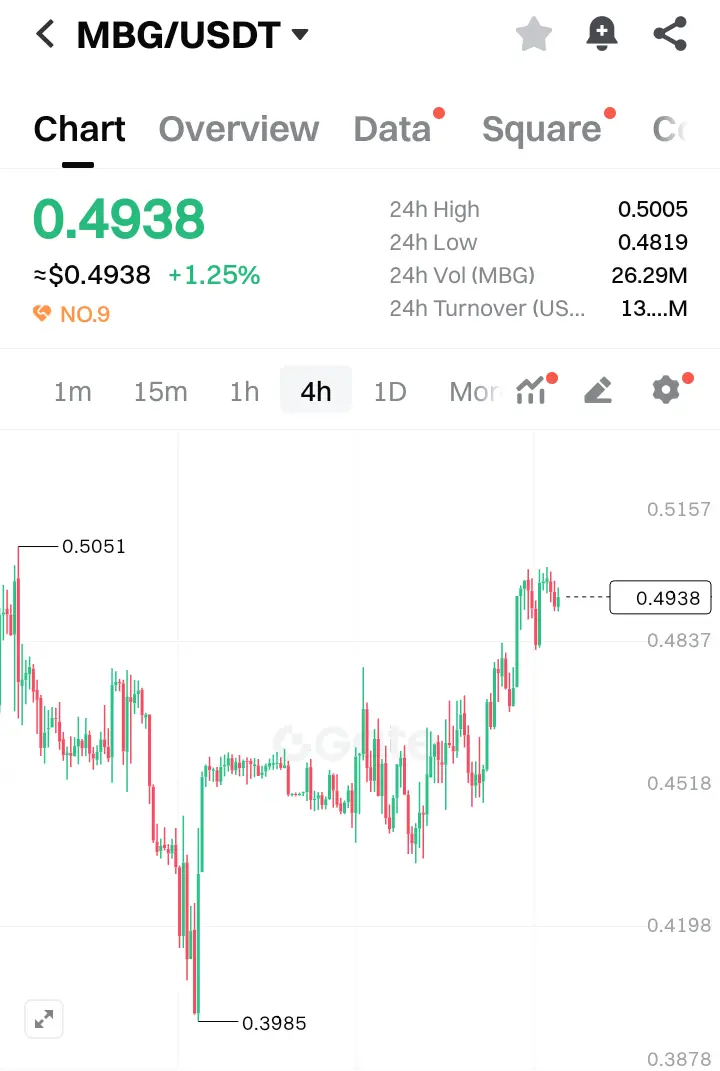
$MBG is demonstrating a steady recovery as price climbs back above the mid-range after a pronounced dip toward the $0.39 area.
Buyers have stepped in with clear intent, driving a gradual uptrend that reflects improving sentiment. The pair is now stabilizing near the $0.49 zone, holding higher lows and showing consistent upward momentum.
Overall market behavior suggests strengthening demand and a constructive structure as traders monitor whether MBG can sustain this trajectory and challenge its recent upper levels.
MBG0.04%
- Reward
- like
- Comment
- Repost
- Share
- Reward
- like
- Comment
- Repost
- Share
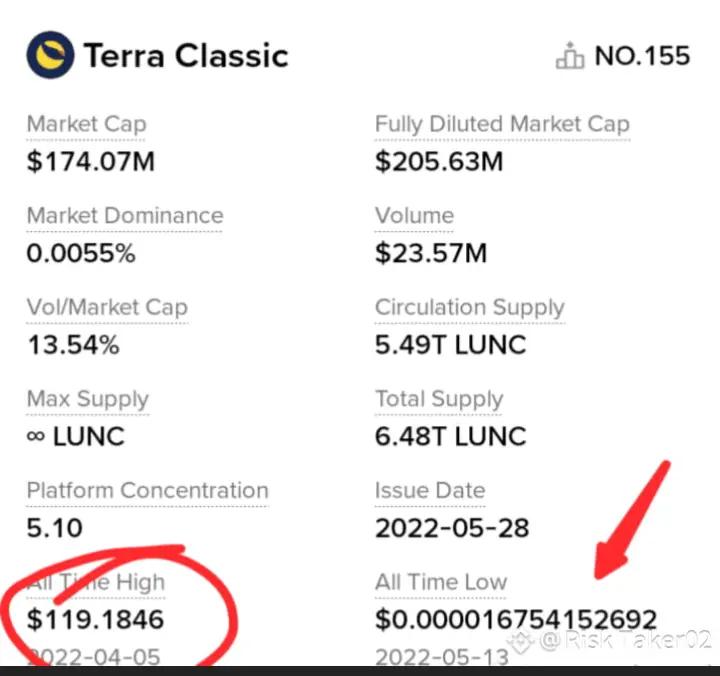
😳😳😳😳😳 Wait… Terra Classic ($LUNC) really had an all-time high of $119?🌿🌿🌿
✅I just noticed it today and I’m genuinely shocked…🌿
✅From $119 ➜ all the way down to $0.00002 😱😱😱😱😱😱😱😱😱😱
✅That’s not a dip that’s one of the most dramatic collapses in crypto history.🌿
✅I can’t imagine what it felt like for the people holding massive positions near the peak…🌿🌿🌿🌿🌿🌿🌿🌿🌿🌿🌿
✅😁😁😁The scale of those losses is unreal 😷💔
✅And yet, $LUNC is still here.🌿
✅Still trading.🌿
✅Still supported by its community.🌿
✅Still pushing for a comeback. 🔥🔥
✅Crypto can be both brutal and unbe
LUNC-23.92%

- Reward
- 2
- 5
- 1
- Share
ThickBlackTissues :
:
🚀 GM crypto degens! 🌞 Bitcoin holding strong above $98k as ETF inflows smash new records! Ethereum gearing up for the Pectra upgrade – L2 fees about to drop even lower 🔥
Top movers on Gate.io right now:
✅ $SOL +6.8%
✅ $DOGE pumping again
✅ \( XRP breaking 2.4 \) resistance
View More
- Reward
- like
- Comment
- Repost
- Share
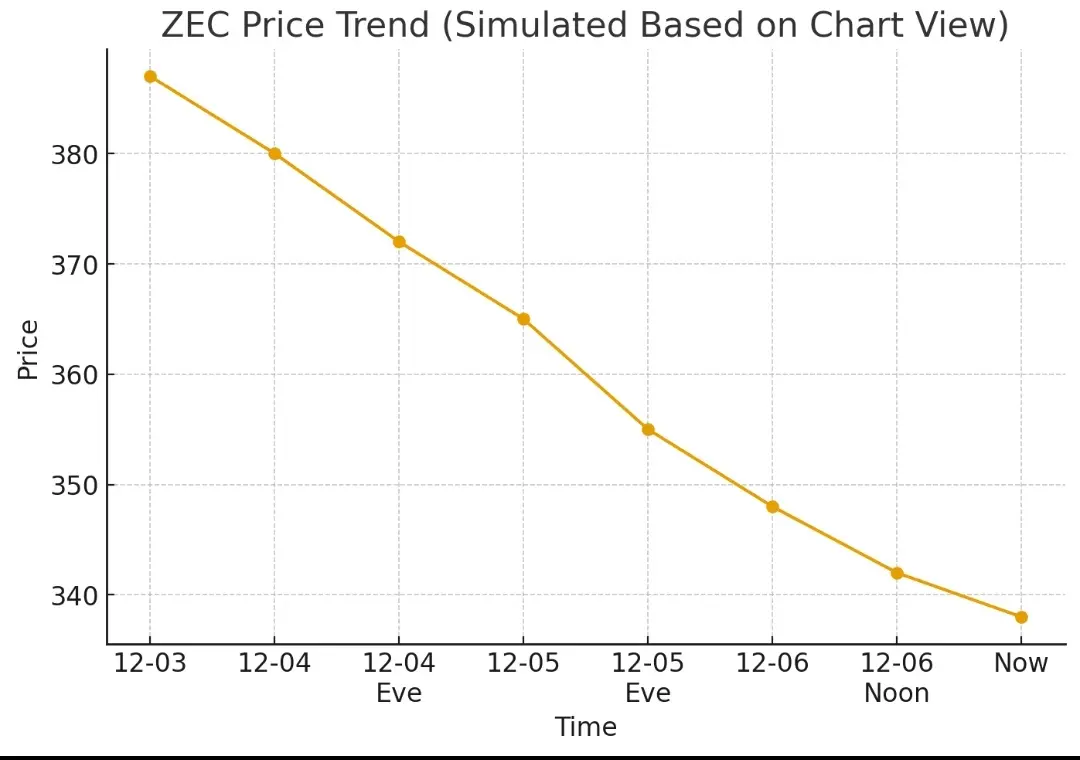
$ZEC 📉 ZEC Market Update (1H View)
ZEC has been sliding down steadily, moving from the mid-380 zone to around the 330s. Buyers are still quiet and indicators show a clear cooldown phase.
What the chart suggests:
MACD → still negative, momentum weak
RSI → sitting low, showing selling pressure but also potential for a bounce
Bollinger Bands → price hugging the lower band, meaning the market is oversold
Short-term (1H) → downtrend
Mid-term (4H) → weakening momentum
Long-term (1D) → still in correction mode
My personal view:
If ZEC can hold near the current support zone, it may try a small reco
ZEC0.07%
- Reward
- like
- Comment
- Repost
- Share
- Reward
- like
- Comment
- Repost
- Share
Recently, more and more people in the community have gotten into trouble, and many friends have asked me: What's really going on with this wave of regulation? Are the coins in our accounts still safe?
To be honest, after years of trading crypto, I've seen too many cases where people got burned because they ignored basic security. This joint action by multiple departments isn't targeting regular traders, but rather aims to weed out projects that use the banner of "compliance" to scam people.
**The three main scam tactics lately:**
Here's a typical case—a certain project's white paper claims "st
View OriginalTo be honest, after years of trading crypto, I've seen too many cases where people got burned because they ignored basic security. This joint action by multiple departments isn't targeting regular traders, but rather aims to weed out projects that use the banner of "compliance" to scam people.
**The three main scam tactics lately:**
Here's a typical case—a certain project's white paper claims "st
- Reward
- 12
- 5
- Repost
- Share
MemeCurator:
Retail investors won't cut themselves.View More
There are new developments on the SOL chain—let’s see which tokens have been gaining traction recently:
Top 5 on the list:
1. $bl0ck takes the top spot
2. $TRUSt follows closely behind
3. $CULT remains hot
4. $IDOS holds steady at fourth
5. #WhiteWhale breaks into the top five
This heat map refreshes every 5 minutes, keeping you locked in on what's moving right now in the Solana ecosystem. Worth watching if you're tracking on-chain momentum shifts.
View OriginalTop 5 on the list:
1. $bl0ck takes the top spot
2. $TRUSt follows closely behind
3. $CULT remains hot
4. $IDOS holds steady at fourth
5. #WhiteWhale breaks into the top five
This heat map refreshes every 5 minutes, keeping you locked in on what's moving right now in the Solana ecosystem. Worth watching if you're tracking on-chain momentum shifts.
- Reward
- 12
- 3
- Repost
- Share
ChainBrain :
:
bl0ck is back again. Is it really about to take off this time?View More
BTC is slowly drifting down toward the rising trendline, showing that buyers are still defending the broader uptrend despite the recent pullback. As long as price holds above this ascending support, the market structure remains bullish, and a bounce from this trendline would be the key trigger for upward continuation.
The major resistance remains the wide supply zone around $93.5k, which has repeatedly rejected price. A clean bounce from the trendline followed by a strong push into this zone could set up a breakout retest scenario. If bulls manage to reclaim this level with a convincing candle
The major resistance remains the wide supply zone around $93.5k, which has repeatedly rejected price. A clean bounce from the trendline followed by a strong push into this zone could set up a breakout retest scenario. If bulls manage to reclaim this level with a convincing candle
BTC-0.16%
- Reward
- like
- Comment
- Repost
- Share
#晒出我的持仓收益#
- "Once you enter the crypto world, there's no turning back—your morals become a thing of the past!"
View Original- "Once you enter the crypto world, there's no turning back—your morals become a thing of the past!"


- Reward
- like
- Comment
- Repost
- Share
COAI took a heavy hit—down 6.8% as the momentum behind the AI tokens narrative fades. Money is moving extremely fast these days. Traders are shifting to meme coins and coins tied to major exchange ecosystems.
Whale situation? Very harsh. The top 10 wallets hold 87.9% of the supply, and exchange wallets have seen massive inflows recently. This is a classic distribution.
Technically, COAI broke the Fibonacci retracement level at $1.04. Momentum indicators are still pointing negative. Unless there’s a major change, it looks like a heavy burden right now.
COAI-5.13%
- Reward
- like
- Comment
- Repost
- Share
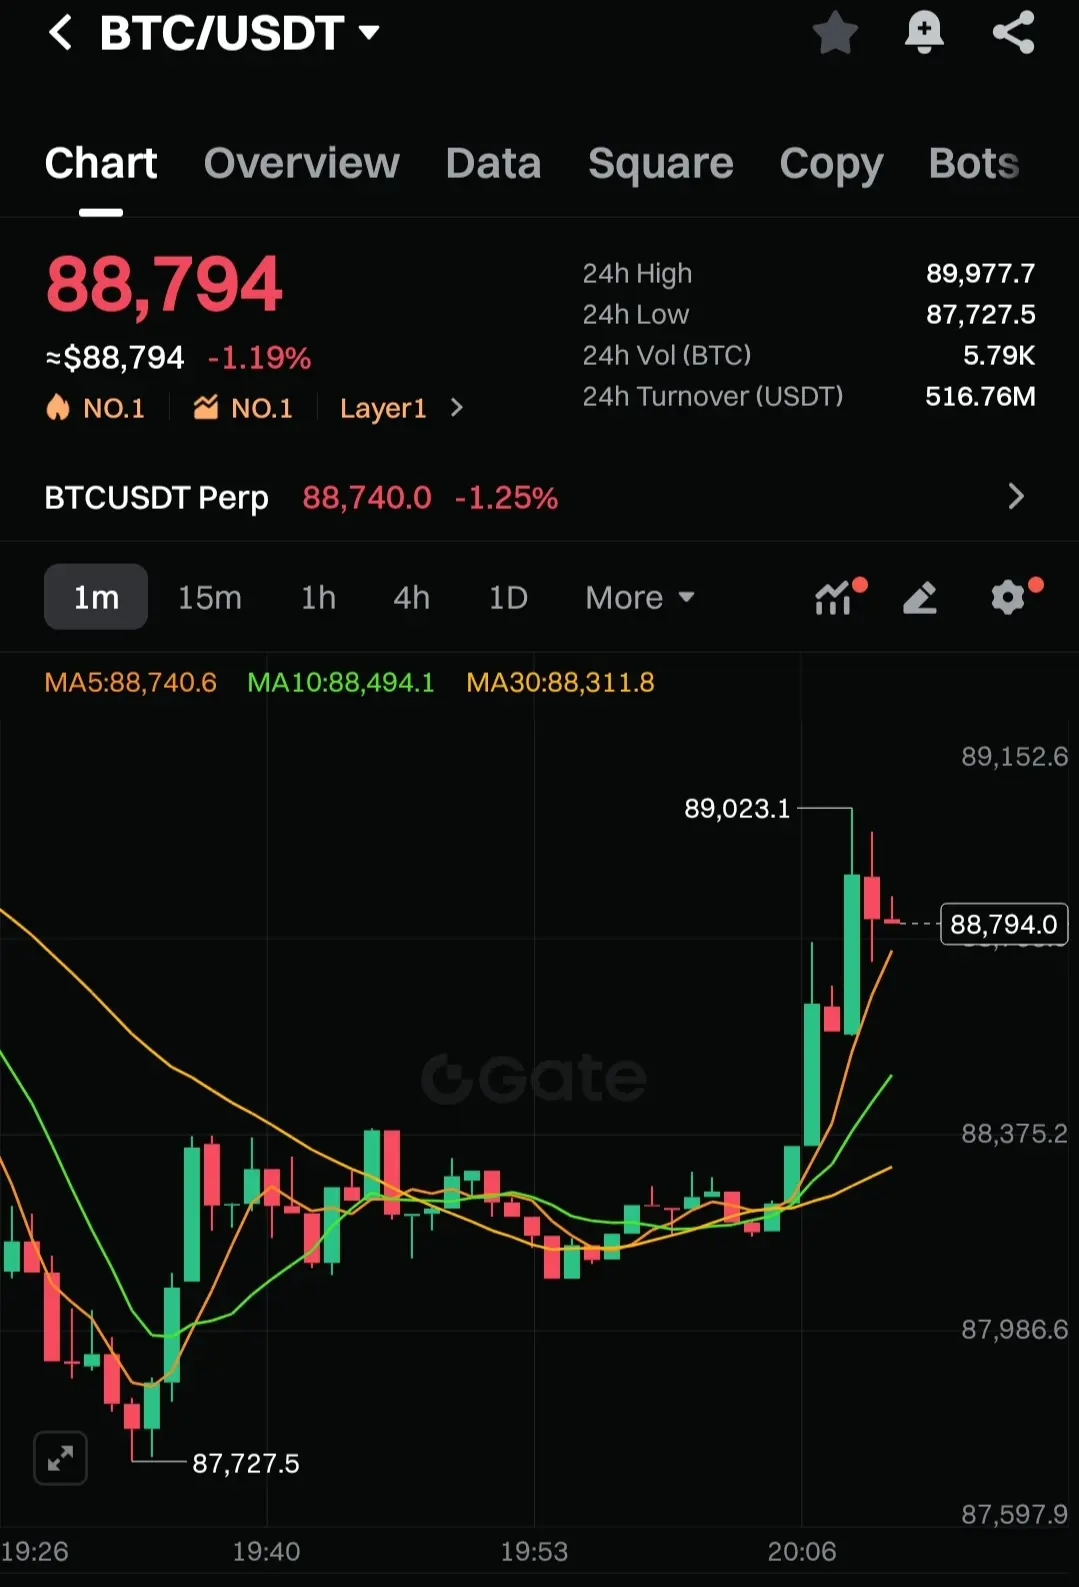
$BTC is finding support near $88,794, showing a slight dip of 1.19% .Momentum could give it a nice nudge upward if this zone holds, especially with the MACD turning bullish .
Entry Zone: $88,740 – $88,800
TP 1: $89,023
TP 2: $89,150
TP 3: $89,300
Stop Loss: $88,600
#BTC #Rmj-Trades
Entry Zone: $88,740 – $88,800
TP 1: $89,023
TP 2: $89,150
TP 3: $89,300
Stop Loss: $88,600
#BTC #Rmj-Trades
BTC-0.16%

- Reward
- like
- Comment
- Repost
- Share
#美联储重启降息步伐 Happy weekend, everyone!
$ACE This round of short positions was really satisfying, my account has already doubled.
At this level, I suggest gradually reducing your positions and locking in profits. Remember to move your stop-loss line close to your entry price. Those who can keep up with the pace, continue enjoying the profits~
ACE-7.57%
- Reward
- 16
- 5
- Repost
- Share
NFTRegretful :
:
Thinking of cashing out after just doubling? That's too greedy, man. This wave isn't over yet.View More
welcome to my live everyone❤️
- Reward
- like
- Comment
- Repost
- Share
Why did the market suddenly change recently? It all starts with that statement from the Bank of Japan.
Let’s review what happened over the past few days: On December 2, the Federal Reserve unexpectedly announced a halt to quantitative tightening. That should have been good news, right? But the next day, neither US stocks nor BTC saw much of a rise. Going back one more day, on December 1, Bank of Japan Governor Kazuo Ueda dropped a bombshell—the market’s expectation for a rate hike in Japan in December soared to 76%, and Japanese government bond yields hit a new high. Further back, on November
Let’s review what happened over the past few days: On December 2, the Federal Reserve unexpectedly announced a halt to quantitative tightening. That should have been good news, right? But the next day, neither US stocks nor BTC saw much of a rise. Going back one more day, on December 1, Bank of Japan Governor Kazuo Ueda dropped a bombshell—the market’s expectation for a rate hike in Japan in December soared to 76%, and Japanese government bond yields hit a new high. Further back, on November
BTC-0.16%
- Reward
- 15
- 6
- Repost
- Share
SleepTrader:
The bear market has come to an end.View More
ETH has been consolidating within a range recently, and the 3000 level is actually quite crucial. A lot of funds are quietly building positions around here, just waiting for a sudden breakout with increased volume.
Shorting at this level? I think the risk-to-reward ratio isn’t very attractive. I talked with some friends in the community about this recently and suggested considering long positions, with a focus on whether it can break through resistance.
Judging by the current trend, it might reach the expected take-profit level as soon as tonight. Everyone can keep an eye on market changes, an
ETH-0.61%
- Reward
- 15
- 7
- Repost
- Share
VitaliksTwin :
:
Let's talk again when it hits 3000.View More
Load More
Join 40M users in our growing community
⚡️ Join 40M users in the crypto craze discussion
💬 Engage with your favorite top creators
👍 See what interests you
- Trending TopicsView More
282.95K Popularity
82.64K Popularity
15.42K Popularity
13.97K Popularity
16.19K Popularity
- Hot Gate FunView More
- MC:$3.54KHolders:10.00%
- MC:$3.92KHolders:41.87%
- MC:$3.65KHolders:30.53%
- MC:$3.58KHolders:30.00%
- MC:$10.61KHolders:1427.06%
- Pin