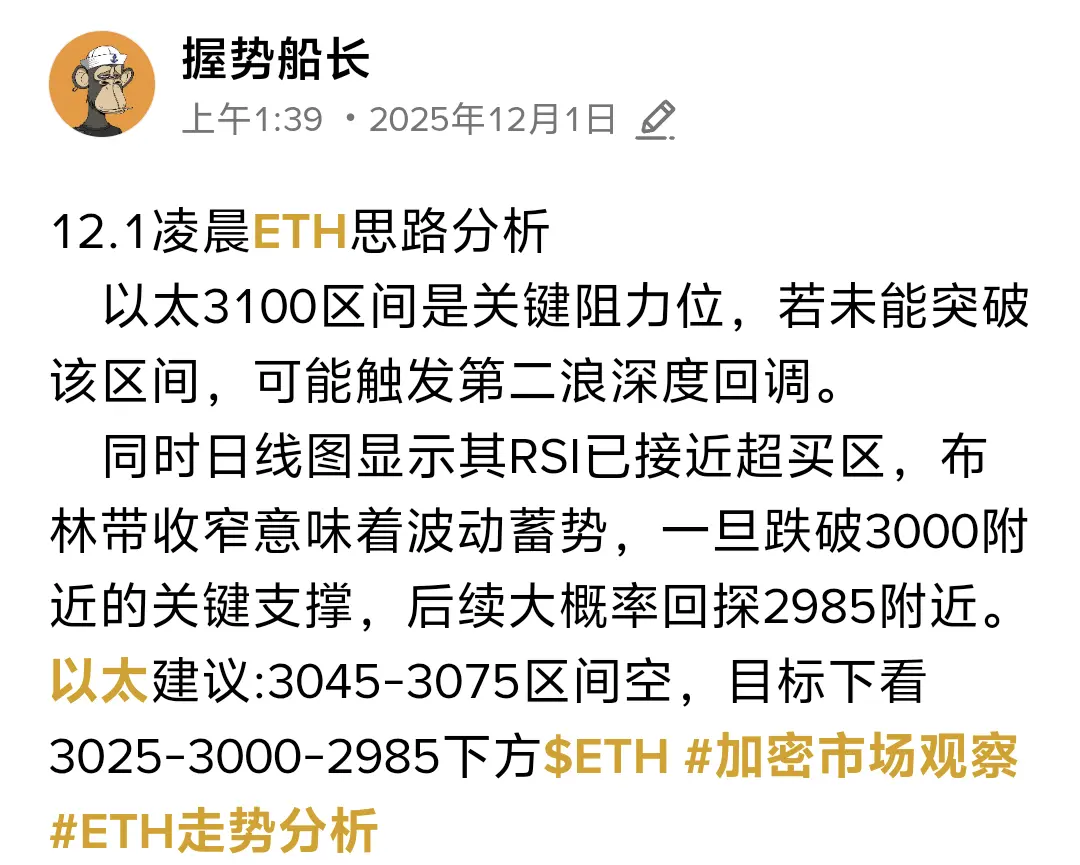

Analysis suggestions for noon on the 12th.
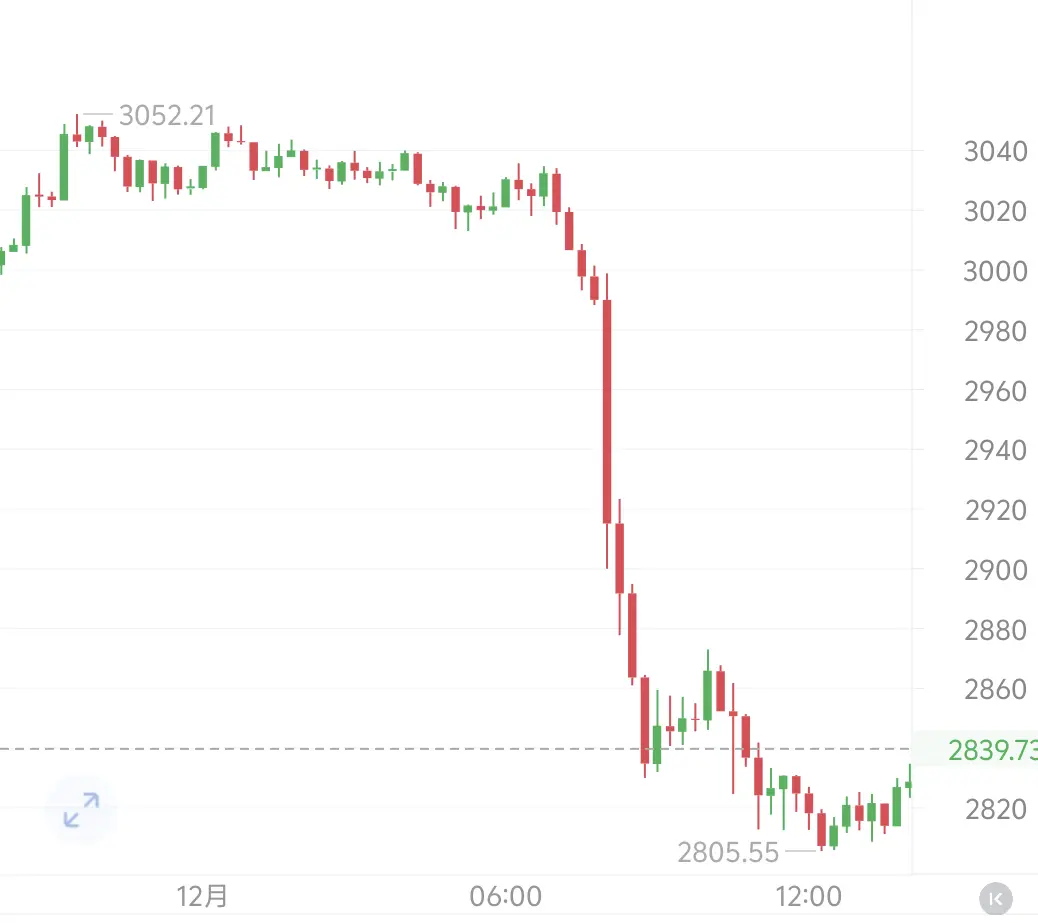
The daily chart shows a wave-like downward trend: after three consecutive small bearish candles as a buildup, a large bearish candle directly pierced through the previous support level, approaching the lower Bollinger Band area. Although the daily candlestick has a small lower shadow, indicating slight support at the low, the weakness of the daily close remains basically established, and short-term downward pressure still exists.
In the four-hour chart, after two consecutive bearish candles retraced, a brief rebound occurred, but the bullish momentum
View OriginalThe daily chart shows a wave-like downward trend: after three consecutive small bearish candles as a buildup, a large bearish candle directly pierced through the previous support level, approaching the lower Bollinger Band area. Although the daily candlestick has a small lower shadow, indicating slight support at the low, the weakness of the daily close remains basically established, and short-term downward pressure still exists.
In the four-hour chart, after two consecutive bearish candles retraced, a brief rebound occurred, but the bullish momentum