FYN vs OP: The Battle for Social Media Dominance in China's Youth Market
Introduction: Investment Comparison of FYN vs OP
In the cryptocurrency market, the comparison between Affyn (FYN) and Optimism (OP) has been a topic of interest for investors. The two differ significantly in market cap ranking, application scenarios, and price performance, representing different positions in the crypto asset landscape. Affyn (FYN): Since its launch in 2022, it has gained market recognition for its sustainable play-to-earn metaverse concept on the Polygon blockchain. Optimism (OP): Introduced in 2022, it has been hailed as a low-cost, high-speed Ethereum Layer 2 solution, becoming one of the prominent scaling solutions in the crypto space. This article will comprehensively analyze the investment value comparison between FYN and OP, focusing on historical price trends, supply mechanisms, institutional adoption, technological ecosystems, and future predictions, aiming to answer the question most concerning investors:
"Which is the better buy right now?"
I. Price History Comparison and Current Market Status
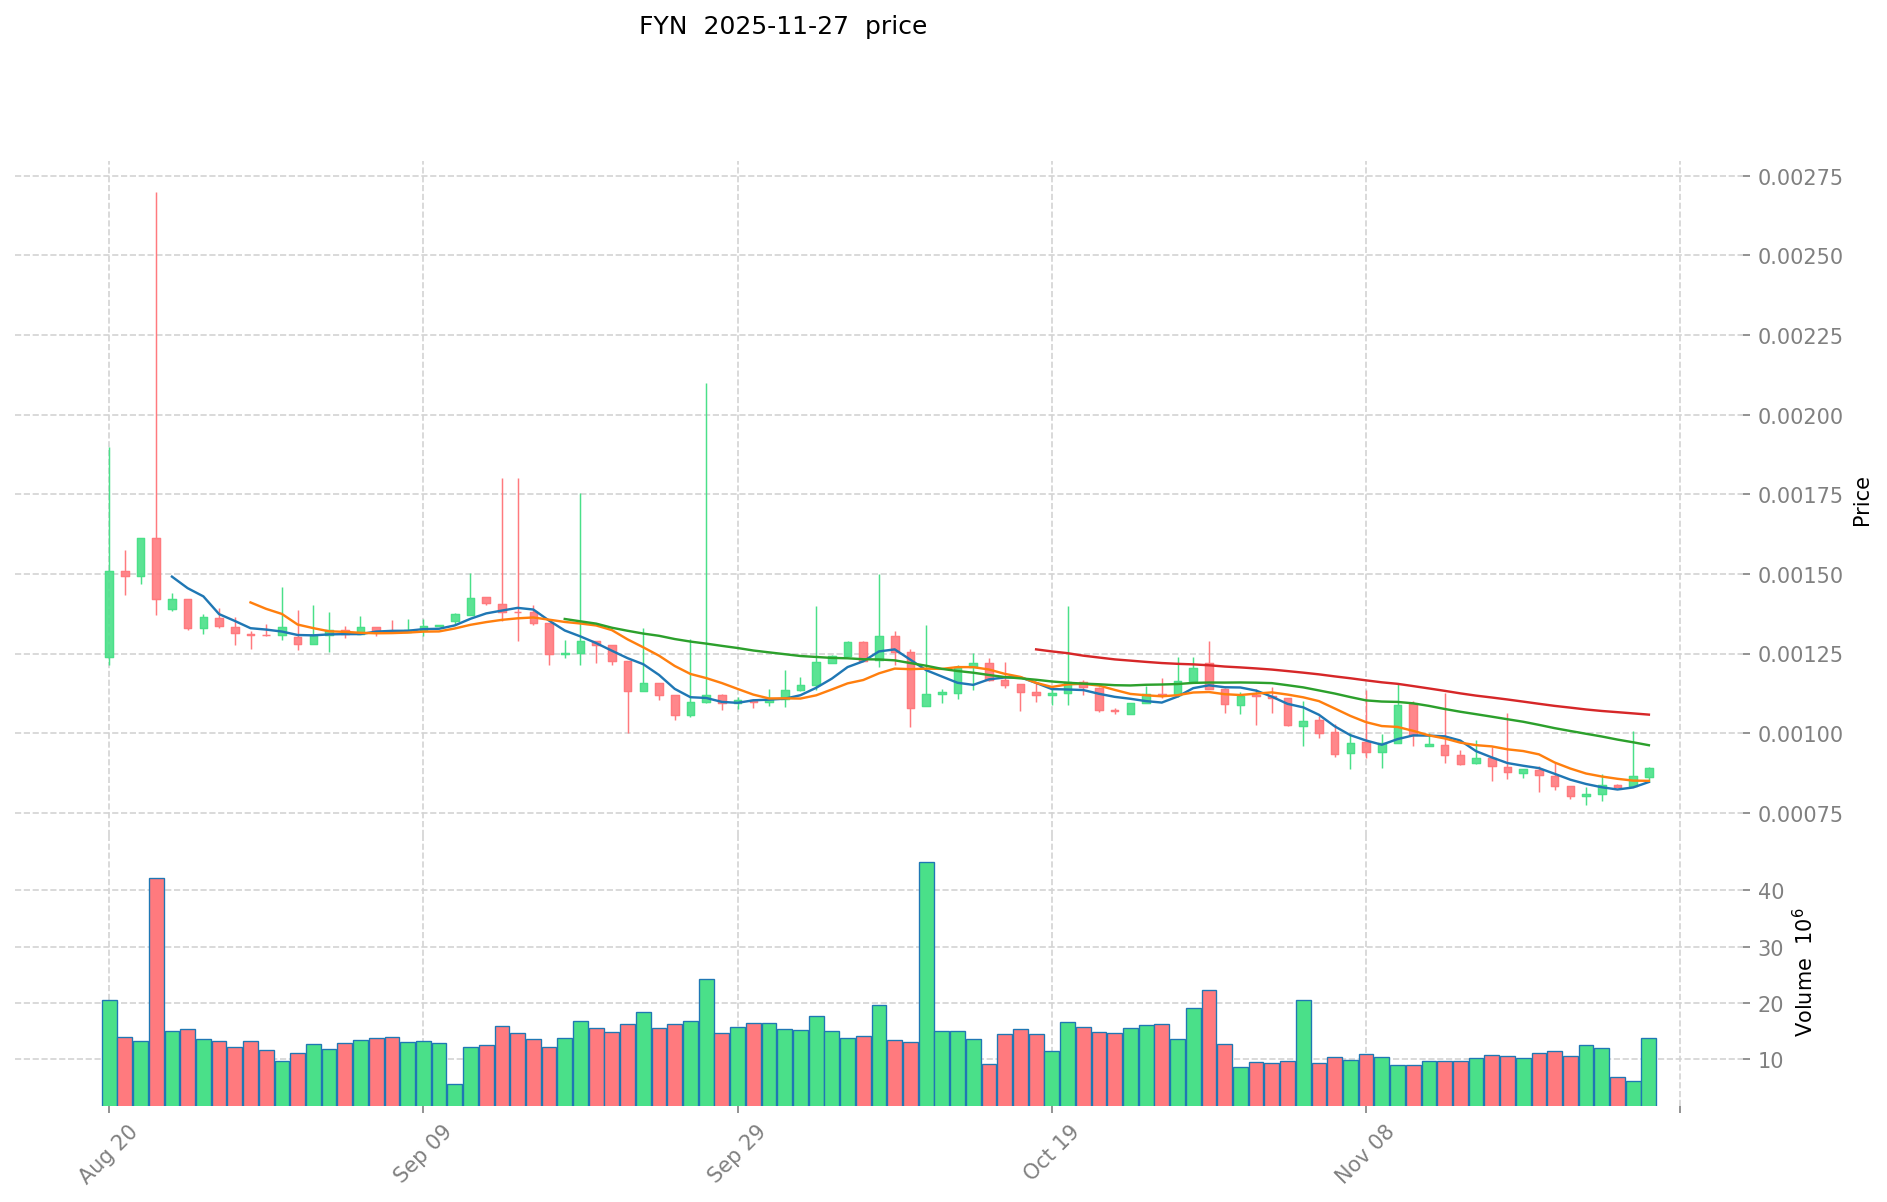
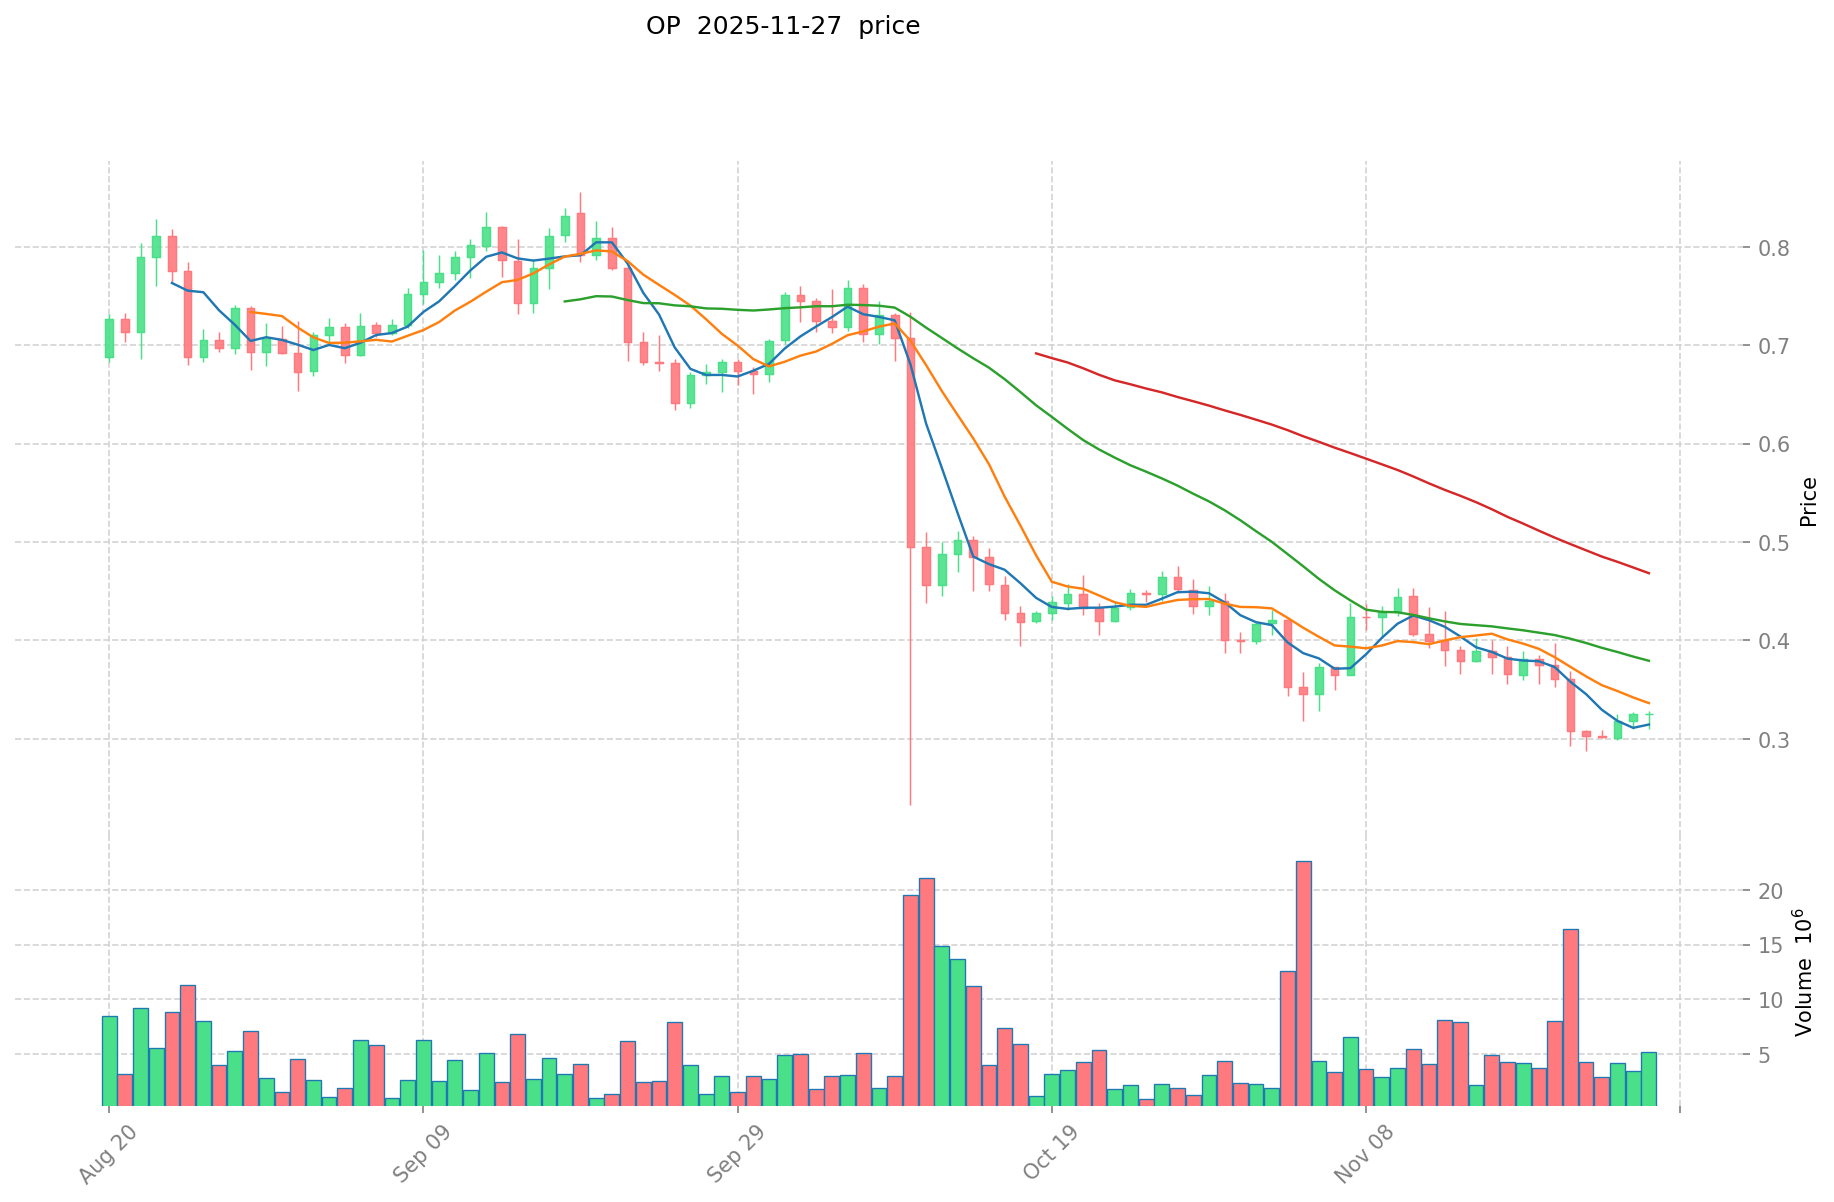
FYN (Coin A) and OP (Coin B) Historical Price Trends
-
2024: OP reached its all-time high of $4.84 on March 6, 2024, likely due to significant developments or market optimism.
-
2025: Both FYN and OP experienced substantial price declines, with FYN hitting its all-time low of $0.000773 on November 22, 2025, and OP reaching its all-time low of $0.288846 on the same date.
-
Comparative Analysis: In the current market cycle, FYN has fallen from its all-time high of $0.193639 to its current price of $0.0009399, while OP has declined from its peak of $4.84 to $0.3315.
Current Market Situation (2025-11-27)
- FYN current price: $0.0009399
- OP current price: $0.3315
- 24-hour trading volume: FYN $12,033.09 vs OP $1,713,617.52
- Market Sentiment Index (Fear & Greed Index): 22 (Extreme Fear)
Click to view real-time prices:
- View FYN current price Market Price
- View OP current price Market Price


II. Key Factors Affecting FYN vs OP Investment Value
Supply Mechanism Comparison (Tokenomics)
- FYN: Fixed token supply of 1 billion FYN with a deflationary model where 45% of all trading fees are used to buy back and burn FYN
- OP: Total supply of 4.29 billion tokens with gradual distribution; 30% allocated to ecosystem fund, 25% to user airdrops, 20% to contributors, 17% to investors, and 8% to the Optimism Foundation
- 📌 Historical pattern: Deflationary models like FYN's tend to create upward price pressure over time, while OP's gradual distribution model helps stabilize early volatility but may face selling pressure during large unlock events.
Institutional Adoption and Market Applications
- Institutional holdings: OP has attracted more institutional investment with backers including a16z, Paradigm, and other major crypto VCs
- Enterprise adoption: OP has been integrated with major DeFi protocols like Uniswap, Aave, and Synthetix, while FYN is still building its ecosystem partnerships
- Regulatory stance: Both projects operate within the Layer 2 scaling solution space with similar regulatory considerations
Technical Development and Ecosystem Building
- FYN technical upgrades: Focuses on AI-powered liquidity and trading infrastructure with innovative fee structure and cross-chain liquidity solutions
- OP technical development: Prioritizes OP Stack modular chain framework, governance mechanisms, and retroactive public goods funding
- Ecosystem comparison: OP has a more mature ecosystem with hundreds of applications across DeFi, NFT marketplaces, and gaming; FYN is focused on building specialized liquidity and trading infrastructure
Macroeconomic Factors and Market Cycles
- Inflation environment performance: OP has demonstrated more market resilience with its established ecosystem, while FYN's deflationary mechanism theoretically provides inflation resistance
- Macro monetary policy: Both tokens are influenced by general crypto market conditions and risk appetite, which correlate with interest rates and monetary policy
- Geopolitical factors: Layer 2 solutions like OP and FYN could benefit from increased demand for scalable blockchain solutions amid growing global digital asset adoption
III. 2025-2030 Price Prediction: FYN vs OP
Short-term Prediction (2025)
- FYN: Conservative $0.000669459 - $0.0009429 | Optimistic $0.0009429 - $0.001254057
- OP: Conservative $0.23219 - $0.3317 | Optimistic $0.3317 - $0.378138
Mid-term Prediction (2027)
- FYN may enter a growth phase, with prices expected in the range of $0.000909540198 - $0.001871807364
- OP may enter a stabilization phase, with prices expected in the range of $0.306650016 - $0.3948118956
- Key drivers: Institutional capital inflow, ETFs, ecosystem development
Long-term Prediction (2030)
- FYN: Base scenario $0.002210258476156 - $0.002917541188526 | Optimistic scenario $0.002917541188526
- OP: Base scenario $0.56229215582295 - $0.601652606730556 | Optimistic scenario $0.601652606730556
Disclaimer
FYN:
| 年份 | 预测最高价 | 预测平均价格 | 预测最低价 | 涨跌幅 |
|---|---|---|---|---|
| 2025 | 0.001254057 | 0.0009429 | 0.000669459 | 0 |
| 2026 | 0.0015378699 | 0.0010984785 | 0.000845828445 | 16 |
| 2027 | 0.001871807364 | 0.0013181742 | 0.000909540198 | 40 |
| 2028 | 0.0020734880166 | 0.001594990782 | 0.00089319483792 | 69 |
| 2029 | 0.002586277553013 | 0.0018342393993 | 0.001412364337461 | 95 |
| 2030 | 0.002917541188526 | 0.002210258476156 | 0.001724001611402 | 135 |
OP:
| 年份 | 预测最高价 | 预测平均价格 | 预测最低价 | 涨跌幅 |
|---|---|---|---|---|
| 2025 | 0.378138 | 0.3317 | 0.23219 | 0 |
| 2026 | 0.41170604 | 0.354919 | 0.19165626 | 7 |
| 2027 | 0.3948118956 | 0.38331252 | 0.306650016 | 15 |
| 2028 | 0.568030823388 | 0.3890622078 | 0.284015411694 | 17 |
| 2029 | 0.6460377960519 | 0.478546515594 | 0.39719360794302 | 44 |
| 2030 | 0.601652606730556 | 0.56229215582295 | 0.292391921027934 | 69 |
IV. Investment Strategy Comparison: FYN vs OP
Long-term vs Short-term Investment Strategy
- FYN: Suitable for investors focused on deflationary tokenomics and AI-powered liquidity solutions
- OP: Suitable for investors interested in established Layer 2 ecosystems and scalability solutions
Risk Management and Asset Allocation
- Conservative investors: FYN 20% vs OP 80%
- Aggressive investors: FYN 40% vs OP 60%
- Hedging tools: Stablecoin allocation, options, cross-currency portfolio
V. Potential Risk Comparison
Market Risk
- FYN: Higher volatility due to lower market cap and trading volume
- OP: Potential selling pressure from token unlocks and distribution events
Technical Risk
- FYN: Scalability, network stability, and adoption of AI-powered solutions
- OP: Dependence on Ethereum's development, potential vulnerabilities in Layer 2 technology
Regulatory Risk
- Global regulatory policies may impact both tokens, with OP potentially facing more scrutiny due to its larger ecosystem and institutional backing
VI. Conclusion: Which Is the Better Buy?
📌 Investment Value Summary:
- FYN advantages: Deflationary model, AI-powered liquidity solutions, potential for higher growth from a lower market cap
- OP advantages: Established ecosystem, institutional backing, proven scalability solution for Ethereum
✅ Investment Advice:
- New investors: Consider a small allocation to OP as part of a diversified crypto portfolio
- Experienced investors: Balance between FYN and OP based on risk tolerance and belief in Layer 2 solutions
- Institutional investors: Focus on OP due to its established ecosystem and institutional adoption
⚠️ Risk Warning: The cryptocurrency market is highly volatile. This article does not constitute investment advice. None
VII. FAQ
Q1: What are the main differences between FYN and OP? A: FYN is a metaverse project on Polygon with a deflationary token model, while OP is an Ethereum Layer 2 scaling solution with a more established ecosystem and institutional backing.
Q2: Which token has performed better historically? A: OP has shown more resilience in the market, reaching a higher all-time high of $4.84 in March 2024, compared to FYN's all-time high of $0.193639.
Q3: What are the key factors affecting the investment value of FYN and OP? A: Key factors include supply mechanisms, institutional adoption, technical development, ecosystem building, and macroeconomic factors such as inflation and monetary policy.
Q4: How do the long-term price predictions for FYN and OP compare? A: By 2030, FYN is predicted to reach $0.002210258476156 - $0.002917541188526, while OP is expected to reach $0.56229215582295 - $0.601652606730556 in the base scenario.
Q5: What are the main risks associated with investing in FYN and OP? A: Risks include market volatility, technical challenges, regulatory uncertainties, and potential selling pressure from token unlocks for OP.
Q6: How should investors allocate their portfolio between FYN and OP? A: Conservative investors might consider 20% FYN and 80% OP, while aggressive investors could opt for 40% FYN and 60% OP, depending on individual risk tolerance.
Q7: Which token is considered more suitable for institutional investors? A: OP is generally considered more suitable for institutional investors due to its established ecosystem, institutional backing, and proven scalability solution for Ethereum.
Share
Content