XL1 vs KAVA : Analyse comparative de deux plateformes blockchain émergentes destinées à la finance décentralisée
Introduction : comparaison des investissements XL1 vs KAVA
Sur le marché des cryptomonnaies, la comparaison entre XL1 et KAVA demeure une question centrale pour les investisseurs. Ces deux actifs se distinguent tant par leur classement en capitalisation, leurs cas d’usage et leurs performances de cours, que par leur positionnement spécifique au sein des crypto-actifs.
XL1 (XL1) : Depuis son lancement, ce jeton utilitaire s’est imposé comme l’actif de XYO Layer One, première blockchain de données évolutive permettant de rendre les informations vérifiables sur la blockchain.
KAVA (KAVA) : Depuis 2019, il s’affirme comme une plateforme financière décentralisée inter-chaînes (cross-chain), proposant des services de prêts collatéralisés et de stablecoin pour les principaux actifs numériques.
Cet article propose une analyse globale de la valeur d’investissement de XL1 et KAVA, en étudiant l’historique des prix, les mécanismes d’offre, l’adoption institutionnelle, les écosystèmes technologiques et les perspectives, afin d’apporter des éléments de réponse à la question essentielle pour les investisseurs :
« Quel est le meilleur choix d’achat à ce jour ? »
I. Comparaison de l’historique des prix et état du marché
Évolution historique des prix de XL1 et KAVA
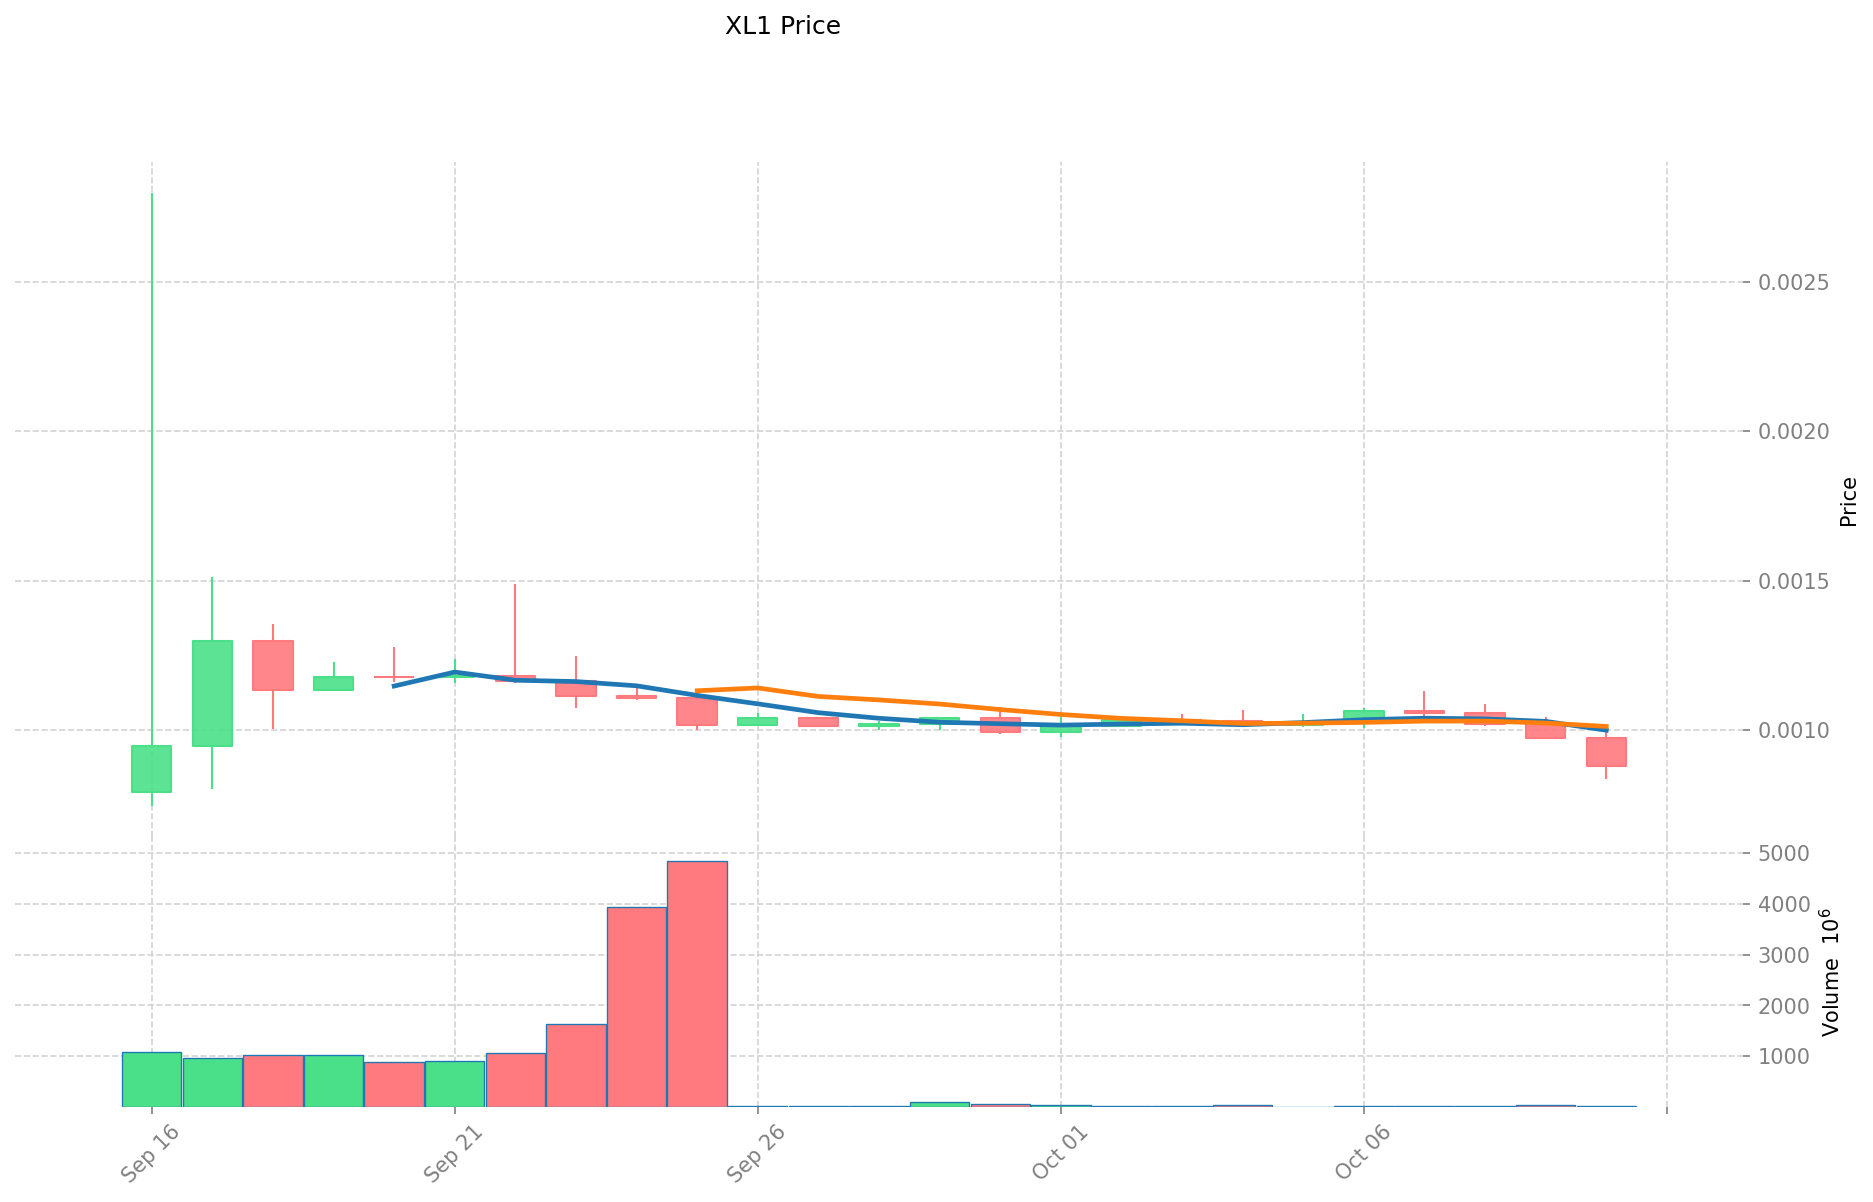
- 2025 : XL1 a atteint un record historique de 0,0027985 $ le 16 septembre 2025.
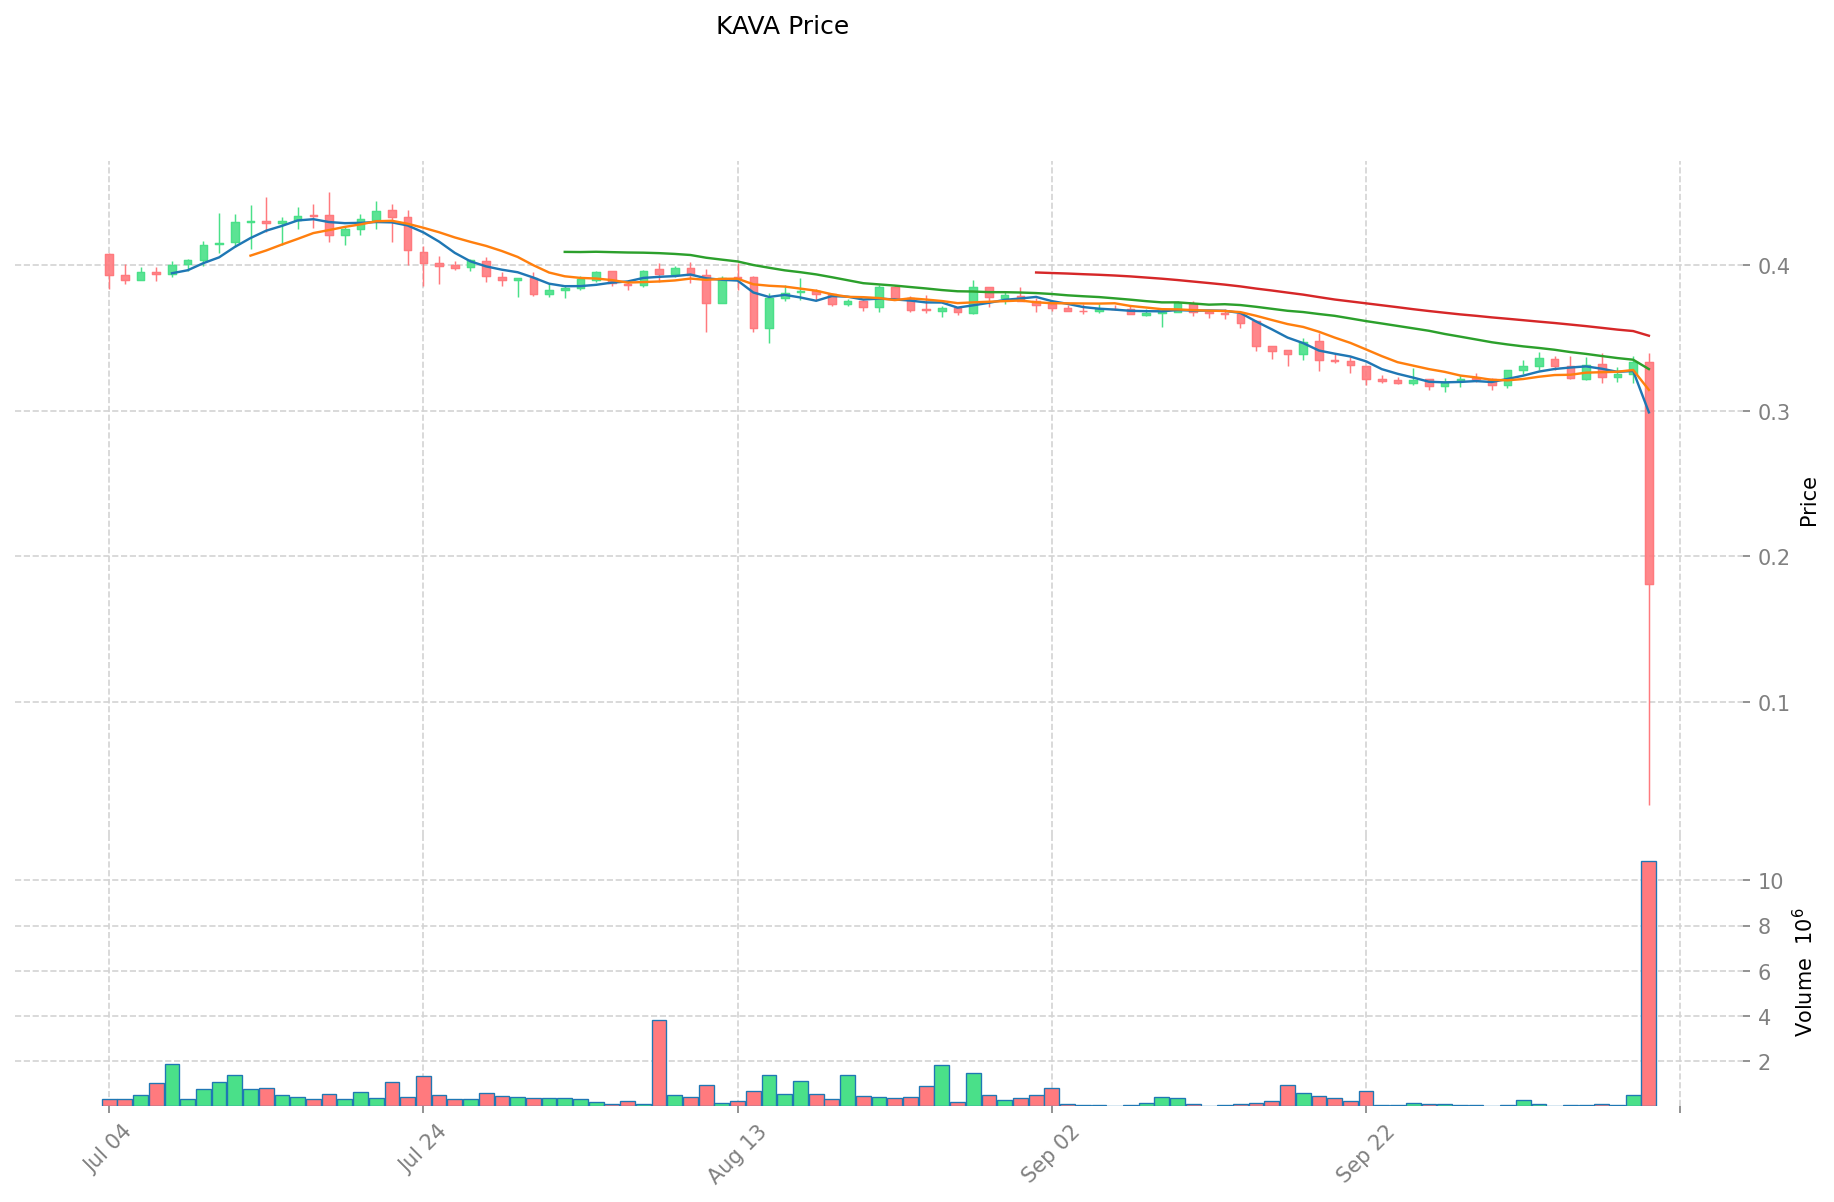
- 2025 : KAVA est tombé à 0,138058 $ le 11 octobre 2025, son plus bas récent.
- Analyse comparative : lors du cycle actuel, XL1 est passé de 0,0027985 $ à 0,0009045 $, tandis que KAVA a chuté de 9,12 $ à 0,1676 $.
Situation du marché au 11 octobre 2025
- Prix actuel XL1 : 0,0009045 $
- Prix actuel KAVA : 0,1676 $
- Volume d’échange sur 24 h : 25 932,40 $ (XL1) vs 1 765 233,83 $ (KAVA)
- Indice de sentiment du marché (« Fear & Greed Index ») : 27 (Peur)
Cliquez pour consulter les prix en temps réel :
- Consulter le cours actuel de XL1 Prix du marché
- Consulter le cours actuel de KAVA Prix du marché
Analyse de la valeur d’investissement : facteurs clés XL1 vs KAVA
Comparaison des mécanismes d’offre (Tokenomics)
- XL1 : jeton utilitaire de la blockchain XYO Layer One avec une structure d’allocation spécifique
- KAVA : jeton pivot DeFi, doté de capacités de prêts inter-chaînes et d’intégration stablecoin
- 📌 Tendance historique : les mécanismes d’offre conditionnent les cycles de prix pour les deux actifs, la liquidité de marché ayant un impact majeur sur la volatilité.
Adoption institutionnelle & cas d’usage
- Détention institutionnelle : KAVA est reconnu comme un « DeFi hub » de référence par l’industrie
- Adoption par les entreprises : XL1 s’intègre aux fonctions stratégiques de son écosystème blockchain, alors que KAVA se démarque sur les segments des prêts inter-chaînes et des stablecoins
- Environnement réglementaire : Les cadres évoluent pour les deux tokens selon les juridictions
Développement technique & écosystème
- Fondation technique XL1 : construit sur XYO Layer One, il assure des fonctions utilitaires structurantes
- Développement technique KAVA : priorise la compatibilité inter-chaînes et l’optimisation de la rapidité des transactions, avec une architecture écosystémique avancée
- Comparatif : KAVA occupe une position dominante dans la DeFi avec des protocoles de prêt éprouvés et l’intégration stablecoin
Facteurs macroéconomiques & cycles de marché
- Performance en environnement inflationniste : les deux actifs doivent être analysés à l’aune des tendances globales du marché crypto
- Impact de la politique monétaire : les variations des taux d’intérêt influencent les flux de capitaux vers les crypto-actifs
- Facteurs géopolitiques : la demande de transactions transfrontalières impacte l’adoption et la valeur d’utilité
III. Prévisions de prix 2025-2030 : XL1 vs KAVA
Prévisions à court terme (2025)
- XL1 : scénario conservateur 0,000624105 $ – 0,0009045 $ | scénario optimiste 0,0009045 $ – 0,001293435 $
- KAVA : scénario conservateur 0,162735 $ – 0,1713 $ | scénario optimiste 0,1713 $ – 0,244959 $
Prévisions à moyen terme (2027)
- XL1 pourrait entrer en phase d’expansion, avec une fourchette estimée de 0,0008688437055 $ à 0,0017765908605 $
- KAVA pourrait se stabiliser, entre 0,19174970835 $ et 0,27953873145 $
- Facteurs clés : flux de capitaux institutionnels, ETF, développement de l’écosystème
Prévisions à long terme (2030)
- XL1 : scénario de base 0,001260666670081 $ – 0,002101111116803 $ | scénario optimiste 0,002101111116803 $ – 0,002962566674692 $
- KAVA : scénario de base 0,258010449942863 $ – 0,390924924155853 $ | scénario optimiste 0,390924924155853 $ – 0,476928407470141 $
Avertissement : Les prévisions ci-dessus s’appuient sur des données historiques et l’analyse du marché. Les marchés des cryptomonnaies sont extrêmement volatils et évolutifs. Ces informations ne constituent pas un conseil financier. Veillez à procéder à vos propres recherches avant toute décision d’investissement.
XL1 :
| 年份 | 预测最高价 | 预测平均价格 | 预测最低价 | 涨跌幅 |
|---|---|---|---|---|
| 2025 | 0.001293435 | 0.0009045 | 0.000624105 | 0 |
| 2026 | 0.0014945958 | 0.0010989675 | 0.0006154218 | 21 |
| 2027 | 0.0017765908605 | 0.00129678165 | 0.0008688437055 | 42 |
| 2028 | 0.002182094482455 | 0.00153668625525 | 0.00141375135483 | 69 |
| 2029 | 0.002342831864754 | 0.001859390368852 | 0.00100407079918 | 105 |
| 2030 | 0.002962566674692 | 0.002101111116803 | 0.001260666670081 | 131 |
KAVA :
| 年份 | 预测最高价 | 预测平均价格 | 预测最低价 | 涨跌幅 |
|---|---|---|---|---|
| 2025 | 0.244959 | 0.1713 | 0.162735 | 3 |
| 2026 | 0.25391799 | 0.2081295 | 0.156097125 | 26 |
| 2027 | 0.27953873145 | 0.231023745 | 0.19174970835 | 40 |
| 2028 | 0.38036904495525 | 0.255281238225 | 0.1582743676995 | 54 |
| 2029 | 0.464024706721582 | 0.317825141590125 | 0.244725359024396 | 92 |
| 2030 | 0.476928407470141 | 0.390924924155853 | 0.258010449942863 | 137 |
IV. Comparaison des stratégies d’investissement : XL1 vs KAVA
Stratégies d’investissement long terme vs court terme
- XL1 : conseillé aux investisseurs axés sur la vérification de données blockchain et le potentiel écosystémique
- KAVA : pertinent pour ceux qui privilégient les applications DeFi et la dimension inter-chaînes
Gestion du risque et répartition d’actifs
- Investisseurs prudents : 30 % XL1 vs 70 % KAVA
- Investisseurs dynamiques : 60 % XL1 vs 40 % KAVA
- Outils de couverture : allocation en stablecoins, options, portefeuilles multi-devises
V. Comparaison des risques potentiels
Risques de marché
- XL1 : volatilité accentuée du fait d’une capitalisation et d’un volume limités
- KAVA : exposition aux fluctuations du marché DeFi et aux risques inter-chaînes
Risques techniques
- XL1 : défis de scalabilité, stabilité du réseau
- KAVA : sécurité des protocoles, failles potentielles des smart contracts
Risques réglementaires
- Les évolutions des politiques réglementaires mondiales peuvent affecter différemment chaque actif, avec une vigilance accrue sur les plateformes DeFi
VI. Conclusion : quel est le meilleur investissement ?
📌 Synthèse de la valeur d’investissement :
- Atouts XL1 : positionnement distinct dans la donnée blockchain vérifiable, potentiel de croissance sur les usages orientés data
- Atouts KAVA : écosystème DeFi mature, fonctionnalités inter-chaînes, liquidité supérieure
✅ Conseils d’investissement :
- Nouveaux investisseurs : privilégier une approche équilibrée, avec un biais KAVA pour la maturité de son écosystème
- Investisseurs expérimentés : explorer les deux opportunités, en surpondérant XL1 pour son potentiel de croissance
- Investisseurs institutionnels : analyser KAVA pour l’exposition DeFi et XL1 pour les solutions blockchain orientées données sur le long terme
⚠️ Avertissement : Les marchés des cryptomonnaies sont très volatils. Cet article n’a pas vocation à constituer un conseil en investissement. None
VII. FAQ
Q1 : Quelles sont les différences majeures entre XL1 et KAVA ? R : XL1 est le jeton utilitaire de la blockchain XYO Layer One, axé sur la donnée vérifiable, tandis que KAVA est une plateforme DeFi inter-chaînes proposant des services de prêt et de stablecoin. XL1 affiche une capitalisation et un volume plus modestes, là où KAVA bénéficie d’un écosystème DeFi solide.
Q2 : Quelle crypto a récemment affiché la meilleure performance de prix ? R : D’après les données, XL1 a inscrit un sommet historique en septembre 2025 tandis que KAVA recule. Cependant, la volatilité reste élevée et les performances passées ne préjugent pas des évolutions futures.
Q3 : Quels sont les moteurs principaux de la valeur future de XL1 et KAVA ? R : Pour XL1, la croissance des applications de vérification de données blockchain et l’essor de l’écosystème sont déterminants. Pour KAVA, ce sont l’élargissement de l’offre DeFi, les capacités inter-chaînes et l’adoption institutionnelle qui prévalent.
Q4 : Comment diffèrent les mécanismes d’offre entre XL1 et KAVA ? R : XL1 bénéficie d’une allocation spécifique en tant que jeton utilitaire de XYO Layer One. KAVA, en tant que jeton DeFi hub, mise sur les prêts inter-chaînes et l’intégration stablecoin. Ces schémas d’offre influencent leur dynamique de prix et leur liquidité respective.
Q5 : Quels sont les risques majeurs liés à l’investissement dans XL1 et KAVA ? R : XL1 subit une volatilité accrue du fait de sa capitalisation et de son volume plus faibles, ainsi que des enjeux de scalabilité. KAVA est exposé aux variations du marché DeFi, aux risques inter-chaînes et aux failles potentielles des smart contracts. Les deux actifs restent soumis à l’environnement réglementaire, avec une vigilance particulière pour la DeFi.
Q6 : Comment répartir son investissement entre XL1 et KAVA ? R : Un investisseur prudent pourra privilégier 30 % XL1 et 70 % KAVA, tandis qu’un profil offensif pourra viser 60 % XL1 et 40 % KAVA. L’allocation doit néanmoins tenir compte du profil de risque et des objectifs personnels.
Q7 : Quelles sont les prévisions de prix à long terme pour XL1 et KAVA ? R : À l’horizon 2030, XL1 est anticipé entre 0,001260666670081 $ et 0,002962566674692 $ selon les scénarios. KAVA pourrait évoluer entre 0,258010449942863 $ et 0,476928407470141 $. Ces projections restent indicatives et dépendantes du contexte de marché.
Partager
Contenu
Introduction : comparaison des investissements XL1 vs KAVA
I. Comparaison de l’historique des prix et état du marché
Analyse de la valeur d’investissement : facteurs clés XL1 vs KAVA
III. Prévisions de prix 2025-2030 : XL1 vs KAVA
IV. Comparaison des stratégies d’investissement : XL1 vs KAVA
V. Comparaison des risques potentiels
VI. Conclusion : quel est le meilleur investissement ?
VII. FAQ

