2025 AMS Price Prediction: Navigating Market Trends and Technological Advancements in the Semiconductor Industry
Introduction: AMS's Market Position and Investment Value
Antmons (AMS), as the first play-to-earn MOBA game on its platform, has established itself as a unique blockchain-based gaming asset since its inception. As of 2025, AMS has a market capitalization of $61,867, with a circulating supply of approximately 23,914,589 tokens, and a price hovering around $0.002587. This asset, often referred to as a "paradise for adventurists," is playing an increasingly crucial role in the realm of blockchain gaming and play-to-earn ecosystems.
This article will provide a comprehensive analysis of AMS's price trends from 2025 to 2030, combining historical patterns, market supply and demand, ecosystem development, and macroeconomic factors to offer professional price predictions and practical investment strategies for investors.
I. AMS Price History Review and Current Market Status
AMS Historical Price Evolution Trajectory
- 2023: AMS reached its all-time high of $0.394 on September 19, 2023
- 2024: The price experienced a significant decline, reaching its all-time low of $0.000602 on October 9, 2024
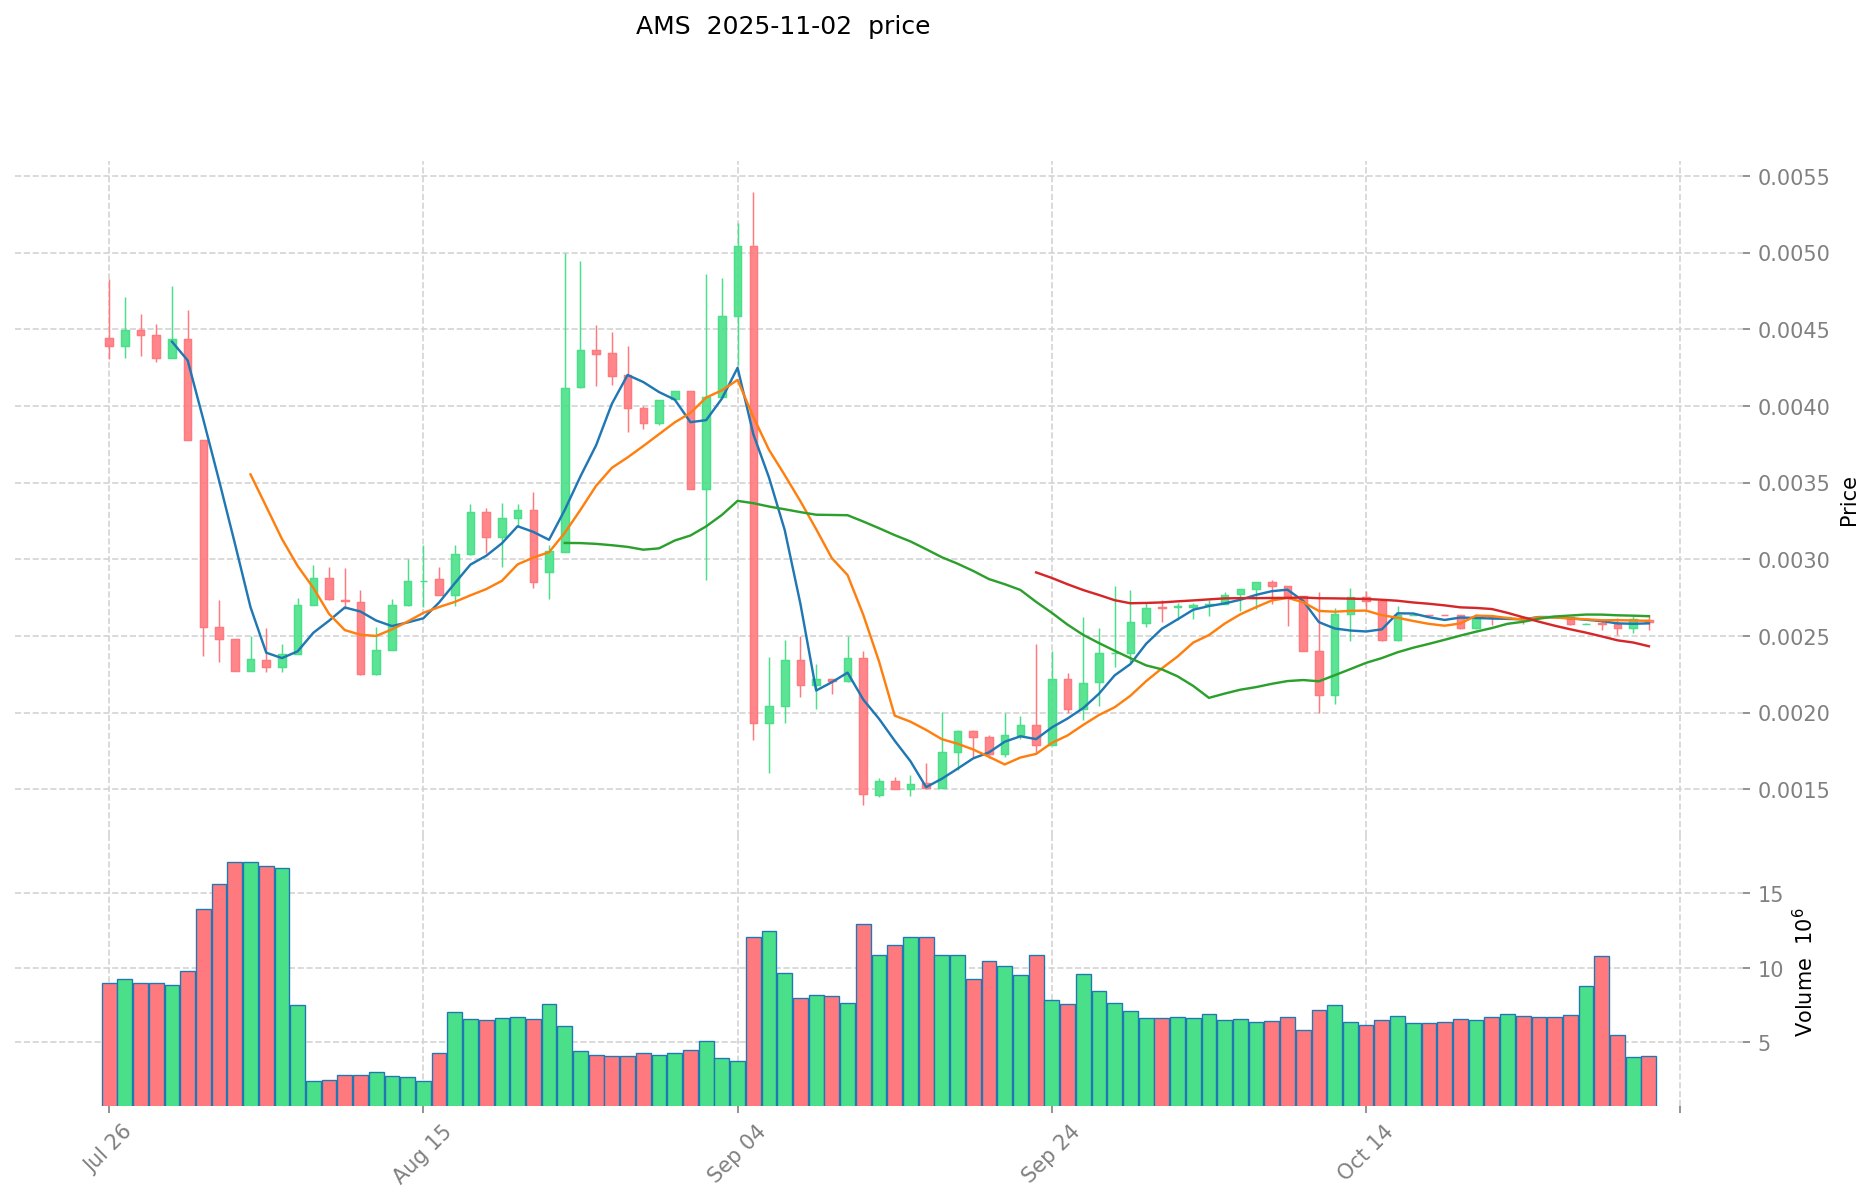
- 2025: AMS has shown signs of recovery, with the current price at $0.002587
AMS Current Market Situation
As of November 2, 2025, AMS is trading at $0.002587. The token has seen a 0.54% increase in the last 24 hours, with a trading volume of $10,471.51. The current market cap stands at $61,867.04, ranking AMS at 5612 in the overall cryptocurrency market.
AMS has shown mixed performance across different timeframes. In the past hour, it has gained 0.01%, while the 7-day and 30-day trends show declines of 1.32% and 4.56% respectively. However, the 1-year performance remains positive with a 25.16% increase.
The token's circulating supply is 23,914,589 AMS, which represents 23.91% of the total supply of 100,000,000 AMS. The fully diluted market cap is $258,700.
Click to view the current AMS market price
AMS Market Sentiment Indicator
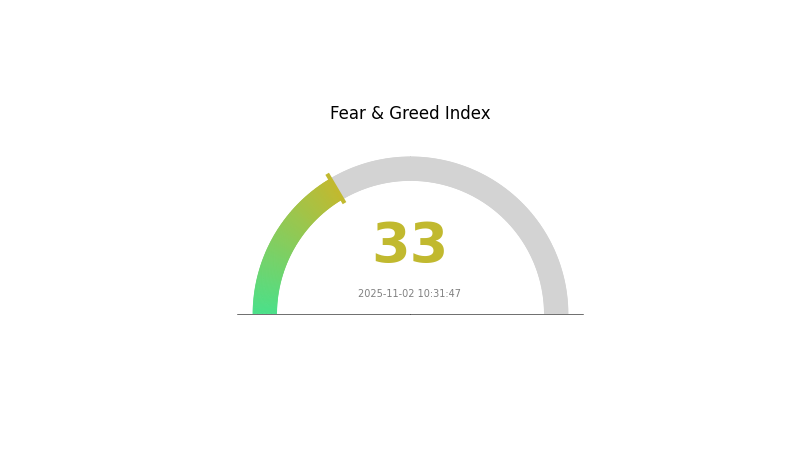
2025-11-02 Fear and Greed Index: 33 (Fear)
Click to view the current Fear & Greed Index
The crypto market sentiment remains cautious as the Fear and Greed Index stands at 33, indicating a fearful atmosphere. This suggests investors are hesitant and risk-averse. During such periods, some view it as an opportunity to accumulate assets at potentially lower prices. However, it's crucial to conduct thorough research and manage risks carefully. Remember, market sentiment can shift rapidly, and past performance doesn't guarantee future results. Stay informed and trade wisely on Gate.com.
AMS Holdings Distribution
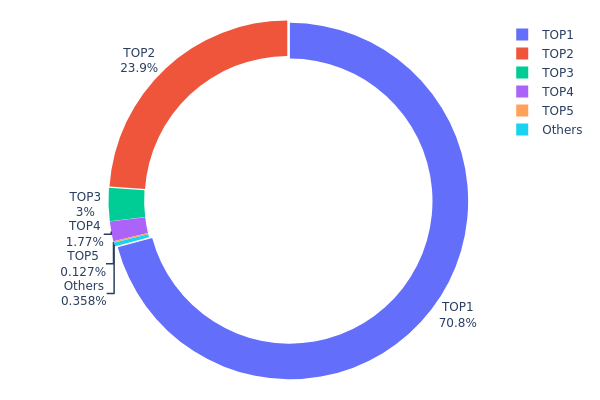
The address holdings distribution chart for AMS reveals a highly concentrated ownership structure. The top address holds a staggering 70.83% of the total supply, while the second-largest holder accounts for an additional 23.90%. This means that just two addresses control 94.73% of all AMS tokens, indicating an extremely centralized distribution.
This level of concentration raises concerns about market stability and potential price manipulation. With such a large portion of tokens held by a few entities, any significant movement or decision by these major holders could have an outsized impact on AMS's market dynamics. The lack of widespread distribution limits the token's liquidity and could potentially lead to increased volatility.
From a market structure perspective, this concentration suggests a low level of decentralization for AMS. While blockchain technology aims to promote distributed ownership, the current state of AMS holdings indicates a centralized control that may be at odds with the principles of decentralized finance. This concentration could also affect governance decisions if AMS implements any on-chain voting mechanisms.
Click to view the current AMS holdings distribution
| Top | Address | Holding Qty | Holding (%) |
|---|---|---|---|
| 1 | 0x388c...6a94bb | 70837.30K | 70.83% |
| 2 | 0x0d07...b492fe | 23907.76K | 23.90% |
| 3 | 0xa119...0284e2 | 3000.00K | 3.00% |
| 4 | 0x41e7...2d12f8 | 1769.91K | 1.76% |
| 5 | 0x64d7...eb8168 | 127.20K | 0.12% |
| - | Others | 357.82K | 0.39% |
II. Key Factors Affecting Future AMS Prices
Supply Mechanism
- Current Impact: The continuous technological advancement is expected to drive down AMS prices gradually.
Macroeconomic Environment
- Inflation Hedging Properties: As a technology-driven product, AMS may not serve as a strong inflation hedge.
Technological Development and Ecosystem Building
- 5G and IoT Development: The growth of 5G and Internet of Things technologies is expected to expand the application areas of AMS chips, leading to increased market demand.
- Performance Improvement: Ongoing technological progress will continue to enhance the performance of AMS chips.
- Ecosystem Applications: The expansion of AMS applications in various downstream industries will influence its market dynamics and pricing.
III. AMS Price Prediction for 2025-2030
2025 Outlook
- Conservative forecast: $0.00228 - $0.00259
- Neutral forecast: $0.00259 - $0.00275
- Optimistic forecast: $0.00275 - $0.0029 (requires positive market sentiment and increased adoption)
2027-2028 Outlook
- Market stage expectation: Potential growth phase with increased volatility
- Price range forecast:
- 2027: $0.00176 - $0.00409
- 2028: $0.00202 - $0.00429
- Key catalysts: Technological advancements, expanded use cases, and overall crypto market trends
2030 Long-term Outlook
- Base scenario: $0.00462 - $0.00515 (assuming steady market growth and adoption)
- Optimistic scenario: $0.00515 - $0.00569 (assuming strong market performance and widespread integration)
- Transformative scenario: $0.00569+ (extreme favorable conditions such as major partnerships or technological breakthroughs)
- 2030-12-31: AMS $0.00569 (potential peak price based on optimistic projections)
| 年份 | 预测最高价 | 预测平均价格 | 预测最低价 | 涨跌幅 |
|---|---|---|---|---|
| 2025 | 0.0029 | 0.00259 | 0.00228 | 0 |
| 2026 | 0.00302 | 0.00274 | 0.002 | 6 |
| 2027 | 0.00409 | 0.00288 | 0.00176 | 11 |
| 2028 | 0.00429 | 0.00348 | 0.00202 | 34 |
| 2029 | 0.00536 | 0.00388 | 0.0028 | 50 |
| 2030 | 0.00569 | 0.00462 | 0.00263 | 78 |
IV. Professional Investment Strategies and Risk Management for AMS
AMS Investment Methodology
(1) Long-term Holding Strategy
- Suitable for: Risk-tolerant investors with a long-term outlook
- Operation suggestions:
- Accumulate AMS tokens during market dips
- Set price targets for partial profit-taking
- Store tokens in secure wallets with regular security audits
(2) Active Trading Strategy
- Technical analysis tools:
- Moving Averages: Use to identify trends and potential reversal points
- Relative Strength Index (RSI): Monitor overbought and oversold conditions
- Key points for swing trading:
- Set stop-loss orders to limit potential losses
- Take profits at predetermined resistance levels
AMS Risk Management Framework
(1) Asset Allocation Principles
- Conservative investors: 1-3% of portfolio
- Moderate investors: 3-5% of portfolio
- Aggressive investors: 5-10% of portfolio
(2) Risk Hedging Solutions
- Diversification: Spread investments across multiple crypto assets
- Stop-loss orders: Implement to limit potential losses
(3) Secure Storage Solutions
- Hot wallet recommendation: Gate Web3 Wallet
- Cold storage solution: Hardware wallets for long-term holdings
- Security precautions: Enable two-factor authentication, use strong passwords
V. Potential Risks and Challenges for AMS
AMS Market Risks
- Volatility: Extreme price fluctuations common in the crypto market
- Liquidity: Potential challenges in buying or selling large amounts
- Competition: Other blockchain gaming projects may impact AMS's market share
AMS Regulatory Risks
- Uncertain regulations: Potential for stricter government oversight
- Tax implications: Evolving tax laws may affect AMS investments
- Legal status: Possibility of regulatory actions against crypto gaming platforms
AMS Technical Risks
- Smart contract vulnerabilities: Potential for exploits or hacks
- Scalability issues: Challenges in handling increased user adoption
- Blockchain network congestion: Possible transaction delays or higher fees
VI. Conclusion and Action Recommendations
AMS Investment Value Assessment
AMS presents a speculative investment opportunity in the blockchain gaming sector. While it offers potential for growth, it comes with significant risks due to market volatility and regulatory uncertainties.
AMS Investment Recommendations
✅ Beginners: Start with small positions and focus on education ✅ Experienced investors: Consider allocating a small portion of portfolio, use risk management tools ✅ Institutional investors: Conduct thorough due diligence, consider as part of a diversified crypto portfolio
AMS Trading Participation Methods
- Spot trading: Buy and sell AMS tokens on Gate.com
- Staking: Participate in staking programs if available
- In-game purchases: Use AMS tokens within the Antmons game ecosystem
Cryptocurrency investments carry extremely high risks, and this article does not constitute investment advice. Investors should make decisions carefully based on their own risk tolerance and are advised to consult professional financial advisors. Never invest more than you can afford to lose.
FAQ
Is AMS a good stock to buy?
AMS shows strong potential with A grades for value and growth, despite an F for momentum. Consider overall metrics and SEC reports for a well-informed investment decision.
Is Asml a good buy right now?
Yes, ASML appears to be a good buy now. It shows strong short-term signals and a positive trend, indicating potential for value growth in the near future.
Will AMD reach $1000?
Based on current projections and continued growth trends, AMD could potentially reach $1000 per share by 2030, especially if AI demand accelerates.
What is the 12 month forecast for Moderna stock?
Based on analyst estimates, the 12-month forecast for Moderna stock ranges from $203.88 to $270, with an average around $206. The current price is $25.13.
Share
Content
Introduction: AMS's Market Position and Investment Value
I. AMS Price History Review and Current Market Status
II. Key Factors Affecting Future AMS Prices
III. AMS Price Prediction for 2025-2030
IV. Professional Investment Strategies and Risk Management for AMS
V. Potential Risks and Challenges for AMS
VI. Conclusion and Action Recommendations
FAQ

