2025 CATCH Price Prediction: Analyzing Market Trends and Future Prospects for the Digital Asset
Introduction: CATCH's Market Position and Investment Value
SpaceCatch (CATCH), as a next-generation AR game driven by complex artificial intelligence, has made significant strides since its inception. As of 2025, CATCH's market capitalization stands at $79,904.96, with a circulating supply of approximately 17,235,755 tokens, and a price hovering around $0.004636. This asset, known as the "PokemonGo killer," is playing an increasingly crucial role in the intersection of AR gaming and blockchain technology.
This article will provide a comprehensive analysis of CATCH's price trends from 2025 to 2030, combining historical patterns, market supply and demand, ecosystem development, and macroeconomic factors to offer professional price predictions and practical investment strategies for investors.
I. CATCH Price History Review and Current Market Status
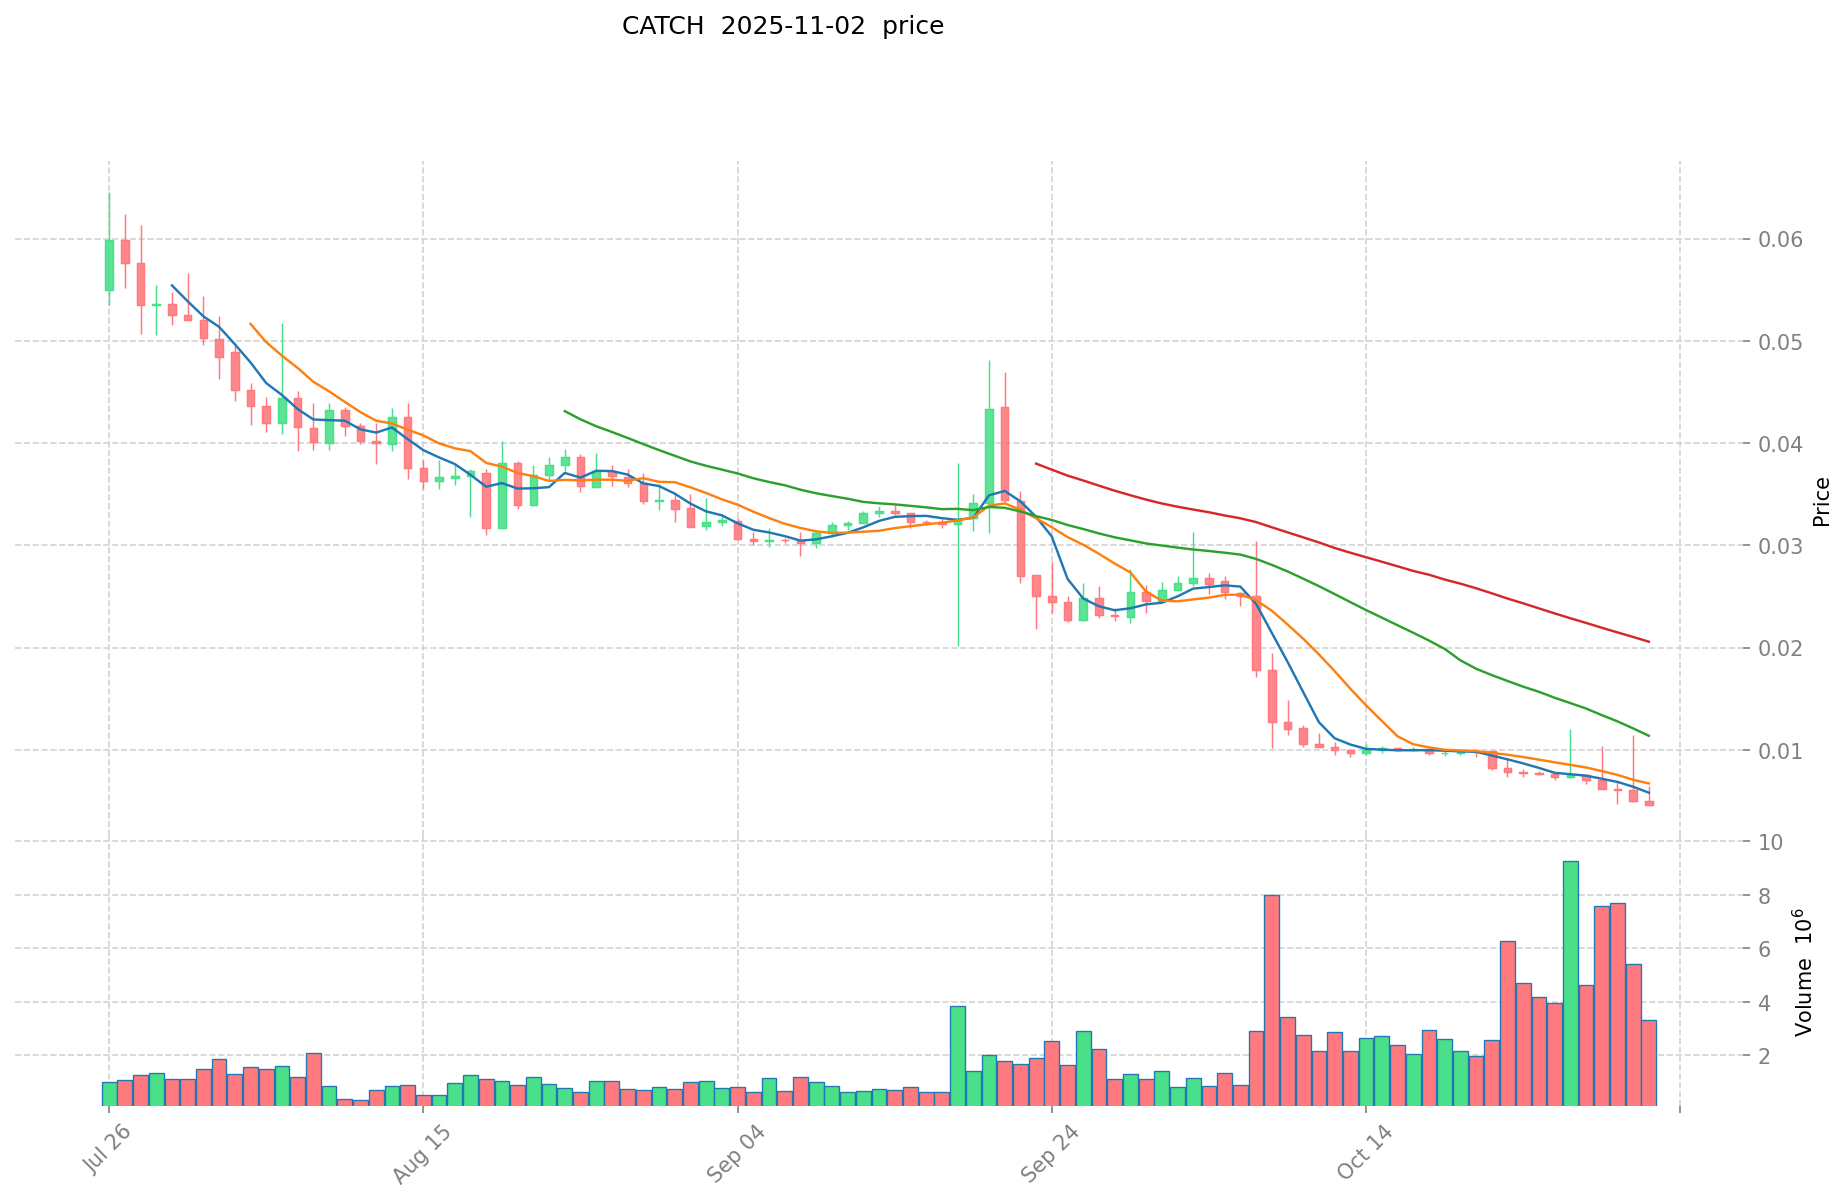
CATCH Historical Price Evolution Trajectory
- 2024: Project launch, price reached ATH of $0.482 on October 4
- 2025: Market downturn, price dropped significantly throughout the year
CATCH Current Market Situation
CATCH is currently trading at $0.004636, representing a 98.16% decline from its all-time high. The token has experienced significant price volatility in recent periods:
- 1-hour change: +1.98%
- 24-hour change: -9.15%
- 7-day change: -39.45%
- 30-day change: -82.43%
The current market capitalization stands at $79,904.96, with a circulating supply of 17,235,755 CATCH tokens. The fully diluted valuation is $463,600. Trading volume in the last 24 hours reached $13,674.14.
CATCH has hit its all-time low of $0.004546 on November 2, 2025, indicating a challenging market environment for the token. The market sentiment appears bearish, with the token experiencing substantial losses across various timeframes.
Click to view the current CATCH market price
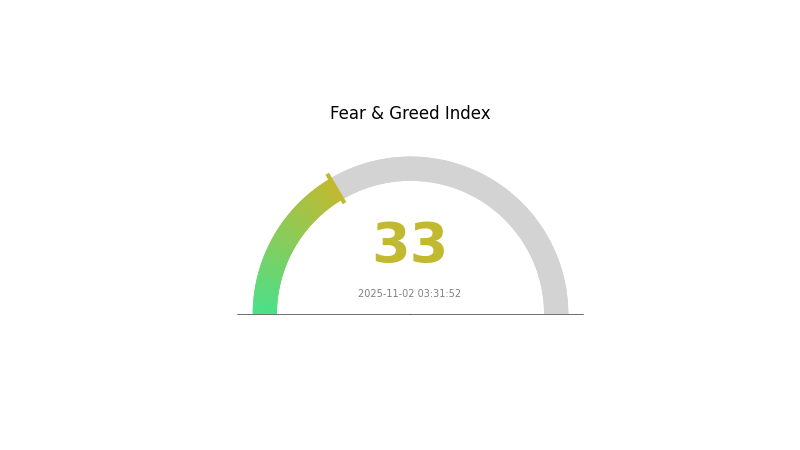
CATCH Market Sentiment Indicator
2025-11-02 Fear and Greed Index: 33 (Fear)
Click to view the current Fear & Greed Index
The crypto market sentiment remains cautious as the Fear and Greed Index stands at 33, indicating a state of fear. This suggests investors are hesitant and potentially looking for buying opportunities. During such periods, it's crucial to stay informed and make rational decisions. Gate.com offers comprehensive market data and analysis tools to help traders navigate these uncertain times. Remember, market fear can sometimes present valuable entry points for long-term investors. Always conduct thorough research and consider your risk tolerance before making any investment decisions.
CATCH Holdings Distribution
The address holdings distribution data for CATCH reveals a highly concentrated ownership structure. The top two addresses hold a combined 67.97% of the total supply, with 38.73% and 29.24% respectively. This level of concentration raises concerns about centralization and potential market manipulation.
The top five addresses collectively control 74.26% of CATCH tokens, leaving only 25.74% distributed among other holders. Such a skewed distribution could lead to increased volatility and susceptibility to large price swings based on the actions of a few major holders. It also indicates a relatively low level of decentralization, which may impact the token's resilience and overall market stability.
This concentration of holdings suggests that CATCH's on-chain structure and market dynamics are heavily influenced by a small number of entities. Potential investors should be aware that this distribution pattern could affect liquidity, price discovery, and the token's ability to maintain a balanced market ecosystem.
Click to view the current CATCH Holdings Distribution

| Top | Address | Holding Qty | Holding (%) |
|---|---|---|---|
| 1 | 0xc878...48aa44 | 38738.67K | 38.73% |
| 2 | 0x93f5...8320a8 | 29249.93K | 29.24% |
| 3 | 0xb567...78728d | 2527.38K | 2.52% |
| 4 | 0x0d07...b492fe | 2248.37K | 2.24% |
| 5 | 0x5187...560ff2 | 1531.69K | 1.53% |
| - | Others | 25703.95K | 25.74% |
II. Key Factors Influencing CATCH's Future Price
Supply Mechanism
- Halving: Periodic reduction in new CATCH supply, potentially leading to price increases if demand remains constant or grows.
- Historical Pattern: Previous halvings have typically resulted in price rallies in the following months.
- Current Impact: The next halving in 2025 is expected to tighten supply and may contribute to upward price pressure.
Institutional and Whale Dynamics
- Institutional Holdings: Growing institutional adoption through ETFs and direct investments may increase demand and price stability.
- Corporate Adoption: Increasing integration of CATCH in corporate treasury reserves could boost long-term demand.
Macroeconomic Environment
- Monetary Policy Impact: Potential easing of global monetary policies in 2025 could improve liquidity and benefit CATCH prices.
- Inflation Hedging Properties: CATCH's performance as an inflation hedge may attract investors in high-inflation environments.
Technological Development and Ecosystem Building
- Network Upgrades: Ongoing improvements to CATCH's blockchain, enhancing scalability and functionality.
- Ecosystem Applications: Growth in DeFi, NFTs, and other blockchain applications built on CATCH's network may drive adoption and value.
III. CATCH Price Prediction for 2025-2030
2025 Outlook
- Conservative prediction: $0.00315 - $0.00400
- Neutral prediction: $0.00400 - $0.00500
- Optimistic prediction: $0.00500 - $0.00575 (requires favorable market conditions)
2027 Mid-term Outlook
- Market stage expectation: Potential growth phase
- Price range forecast:
- 2026: $0.00415 - $0.00535
- 2027: $0.00506 - $0.00722
- Key catalysts: Increasing adoption and technological advancements
2030 Long-term Outlook
- Base scenario: $0.00561 - $0.00702 (assuming steady market growth)
- Optimistic scenario: $0.00702 - $0.00850 (assuming strong market performance)
- Transformative scenario: $0.00850 - $0.00947 (assuming exceptional market conditions and widespread adoption)
- 2030-12-31: CATCH $0.00947 (potential peak price)
| 年份 | 预测最高价 | 预测平均价格 | 预测最低价 | 涨跌幅 |
|---|---|---|---|---|
| 2025 | 0.00575 | 0.00464 | 0.00315 | 0 |
| 2026 | 0.00535 | 0.00519 | 0.00415 | 12 |
| 2027 | 0.00722 | 0.00527 | 0.00506 | 13 |
| 2028 | 0.00718 | 0.00625 | 0.00506 | 34 |
| 2029 | 0.00732 | 0.00671 | 0.00591 | 44 |
| 2030 | 0.00947 | 0.00702 | 0.00561 | 51 |
IV. CATCH Professional Investment Strategies and Risk Management
CATCH Investment Methodology
(1) Long-term Holding Strategy
- Suitable for: Risk-tolerant investors with a long-term perspective
- Operation suggestions:
- Accumulate CATCH tokens during market dips
- Hold for at least 1-2 years to ride out market volatility
- Store tokens in a secure Gate Web3 wallet
(2) Active Trading Strategy
- Technical analysis tools:
- Moving Averages: Use to identify trends and potential entry/exit points
- Relative Strength Index (RSI): Helps gauge overbought/oversold conditions
- Key points for swing trading:
- Monitor SpaceCatch game adoption metrics
- Watch for major project updates or partnerships
CATCH Risk Management Framework
(1) Asset Allocation Principles
- Conservative investors: 1-3% of crypto portfolio
- Aggressive investors: 5-10% of crypto portfolio
- Professional investors: Up to 15% of crypto portfolio
(2) Risk Hedging Solutions
- Diversification: Spread investments across multiple gaming tokens
- Stop-loss orders: Set automatic sell orders to limit potential losses
(3) Secure Storage Solutions
- Hot wallet recommendation: Gate Web3 wallet
- Cold storage solution: Hardware wallet for long-term holdings
- Security precautions: Enable two-factor authentication, use strong passwords
V. CATCH Potential Risks and Challenges
CATCH Market Risks
- High volatility: CATCH price may experience significant fluctuations
- Competition: Other AR gaming projects may impact SpaceCatch's market share
- Market sentiment: Crypto market downturns could affect CATCH's value
CATCH Regulatory Risks
- Unclear regulations: Gaming tokens may face regulatory scrutiny
- Regional restrictions: Some countries may limit or ban crypto gaming platforms
- Tax implications: Evolving tax laws may impact play-to-earn earnings
CATCH Technical Risks
- Smart contract vulnerabilities: Potential for exploits or hacks
- Scalability issues: AR game performance may be affected by network congestion
- Dependency on AR technology: Limitations in AR tech could hinder game experience
VI. Conclusion and Action Recommendations
CATCH Investment Value Assessment
CATCH presents a high-risk, high-potential opportunity in the emerging AR gaming sector. Long-term value depends on SpaceCatch's ability to attract and retain users, while short-term volatility remains a significant risk.
CATCH Investment Recommendations
✅ Beginners: Start with small positions, focus on learning about the project ✅ Experienced investors: Consider a balanced approach with both holding and trading strategies ✅ Institutional investors: Conduct thorough due diligence and consider larger positions if aligned with risk profile
CATCH Trading Participation Methods
- Spot trading: Buy and sell CATCH tokens on Gate.com
- Staking: Participate in staking programs if offered by the SpaceCatch project
- In-game purchases: Acquire CATCH tokens through gameplay and in-game economy
Cryptocurrency investments carry extremely high risks, and this article does not constitute investment advice. Investors should make decisions carefully based on their own risk tolerance and are advised to consult professional financial advisors. Never invest more than you can afford to lose.
FAQ
What crypto will 1000x prediction?
Blast is predicted to give 1000x growth by October 2025, driven by its strong fundamentals, partnerships, and the accelerating adoption of Layer-2 solutions during the expected bull run.
Can Fetch.ai reach $100?
Yes, Fetch.ai could potentially reach $100 if it achieves a market cap of around $100 billion, which is ambitious but not impossible in the dynamic crypto market.
What will Fetch be worth in 2025?
Based on market analysis, Fetch.ai's FET token is projected to reach $1.63 by 2025, showing potential growth from current price trends.
Which coin will reach $1?
Kaspa (KAS) is projected to reach $1 by 2025. Current market trends and analysis support this prediction for the rapidly growing cryptocurrency.
Share
Content
Introduction: CATCH's Market Position and Investment Value
I. CATCH Price History Review and Current Market Status
II. Key Factors Influencing CATCH's Future Price
III. CATCH Price Prediction for 2025-2030
IV. CATCH Professional Investment Strategies and Risk Management
V. CATCH Potential Risks and Challenges
VI. Conclusion and Action Recommendations
FAQ

