2025 CHAINPrice Prediction: Bullish Trends and Key Factors Driving the Market
Introduction: CHAIN's Market Position and Investment Value
Chain Games (CHAIN), as a pioneering project in the decentralized gaming ecosystem, has made significant strides since its inception. As of 2025, CHAIN's market capitalization has reached $7,800,579, with a circulating supply of approximately 379,867,524 tokens, and a price hovering around $0.020535. This asset, often referred to as the "blockchain gaming enabler," is playing an increasingly crucial role in the realm of decentralized gaming and betting.
This article will provide a comprehensive analysis of CHAIN's price trends from 2025 to 2030, combining historical patterns, market supply and demand, ecosystem development, and macroeconomic factors to offer professional price predictions and practical investment strategies for investors.
I. CHAIN Price History Review and Current Market Status
CHAIN Historical Price Evolution
- 2021: All-time high reached, price peaked at $1.03 on March 23
- 2023: Market downturn, price hit all-time low of $0.0055509 on October 16
- 2025: Gradual recovery, price currently at $0.020535
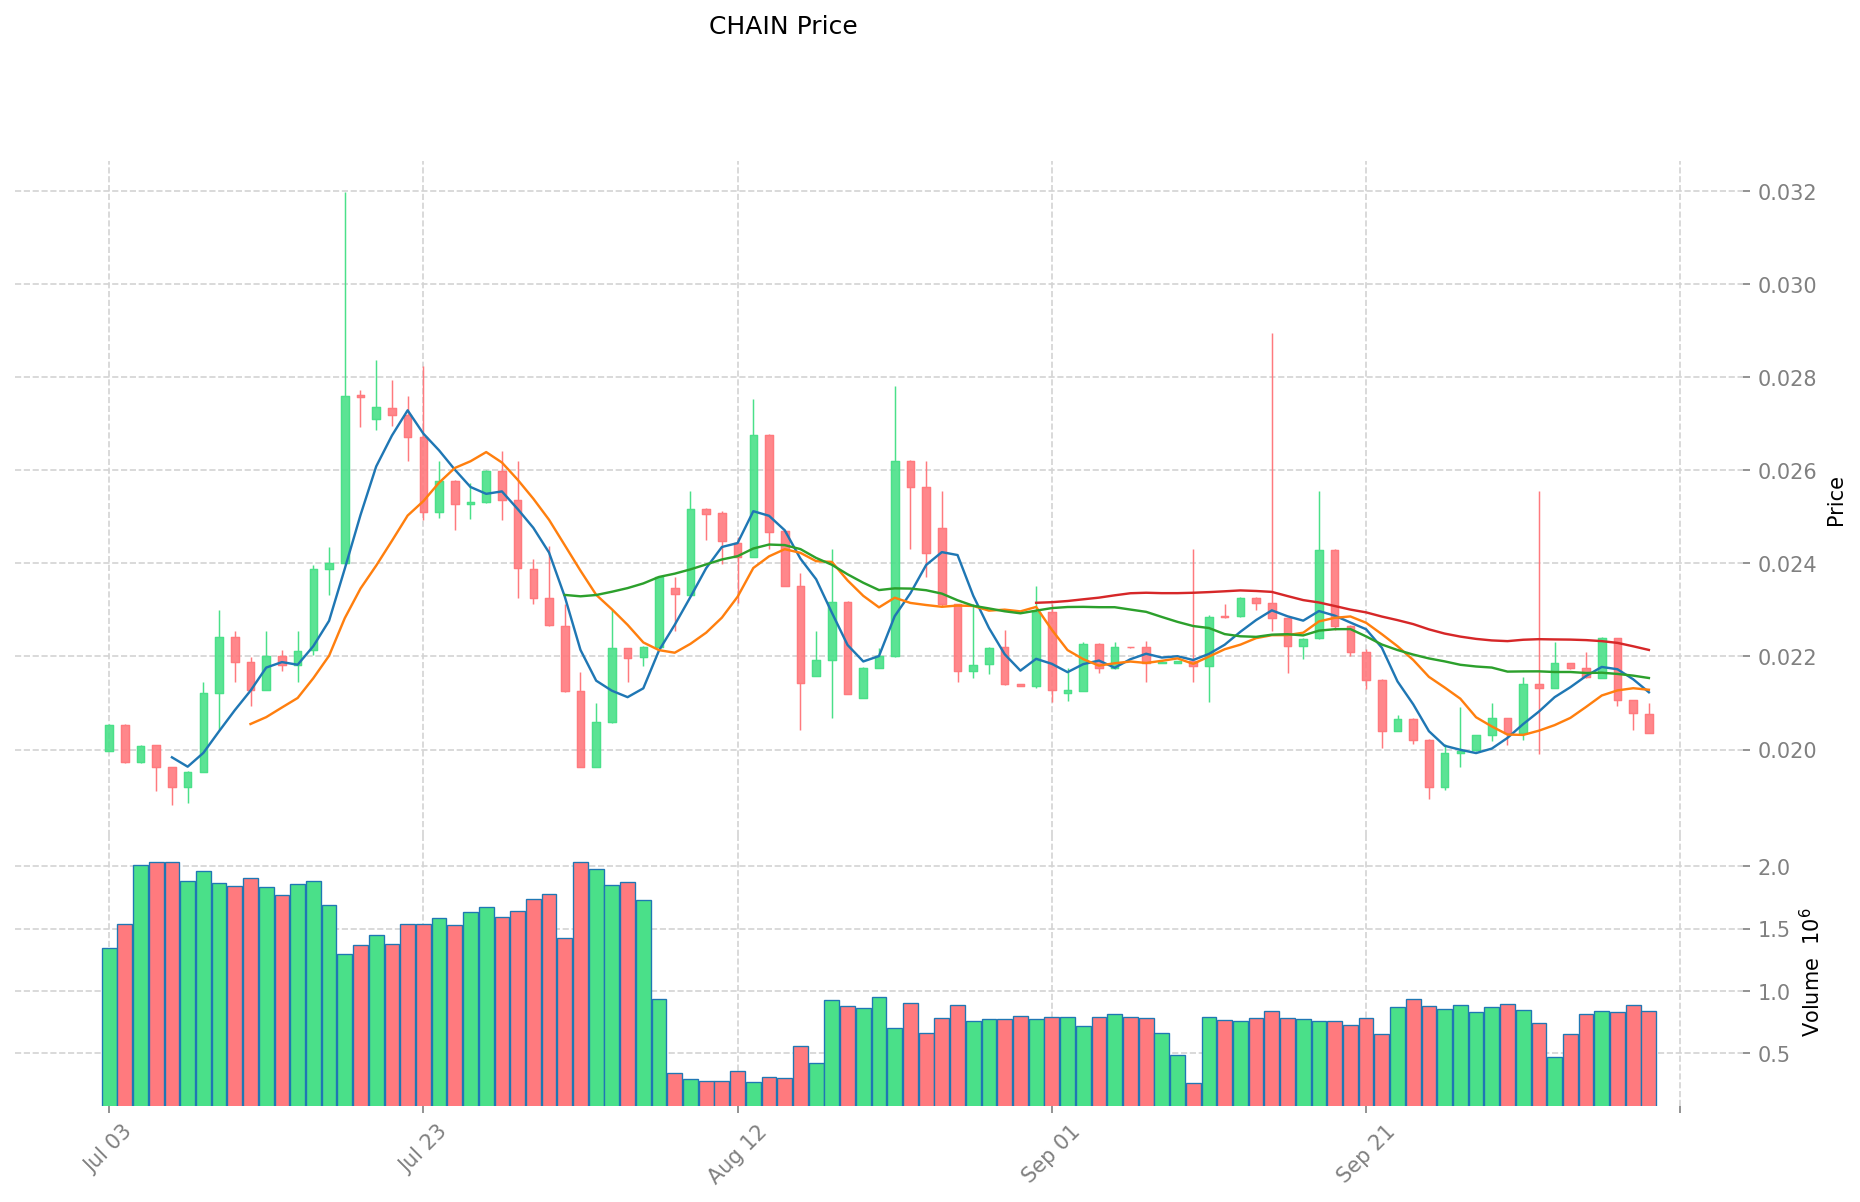
CHAIN Current Market Situation
As of October 10, 2025, CHAIN is trading at $0.020535. The token has seen a slight decline of 1.14% in the past 24 hours, with a trading volume of $16,981.85. CHAIN's market capitalization stands at $7,800,579.62, ranking it at 1535 in the overall cryptocurrency market.
The current price represents a significant recovery from its all-time low but remains far below its all-time high. Over the past year, CHAIN has shown strong performance with a 32.18% increase. However, shorter-term trends indicate some volatility, with a 3.62% decrease over the past week and a 6.15% decline over the last 30 days.
CHAIN's circulating supply is 379,867,524.58 tokens, which is 75.97% of its maximum supply of 500,000,000. The fully diluted market cap is $10,267,500.
Click to view the current CHAIN market price
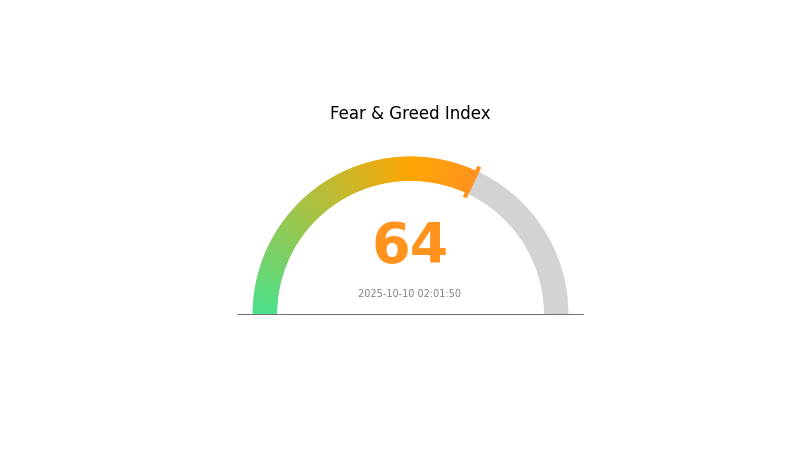
CHAIN Market Sentiment Indicator
2025-10-10 Fear and Greed Index: 64 (Greed)
Click to view the current Fear & Greed Index
The crypto market is currently in a state of greed, with the Fear and Greed Index reaching 64. This suggests investors are becoming increasingly optimistic about the market's potential. While this can indicate positive momentum, it's important to remain cautious. Experienced traders often view extreme greed as a potential sign of an overheated market. As always, it's crucial to conduct thorough research and consider your risk tolerance before making any investment decisions in the volatile crypto space.
CHAIN Holdings Distribution
The address holdings distribution data provides crucial insights into the concentration of CHAIN tokens among different wallet addresses. Analysis of this data reveals a significant level of centralization in CHAIN's token distribution. The top five addresses collectively hold 56.17% of the total supply, with the largest holder controlling 22.38% of all tokens.
This high concentration poses potential risks to market stability and price volatility. The top holder, with over a fifth of the supply, could exert substantial influence on market dynamics if they decide to sell or move large quantities of tokens. Furthermore, the top three addresses combined control 43.81% of the supply, indicating a concerning level of centralization that could impact the token's overall decentralization ethos.
While 43.83% of tokens are distributed among other addresses, the current distribution structure suggests a relatively low level of widespread adoption or equal distribution among network participants. This concentration may lead to increased price sensitivity to the actions of a few large holders and could potentially undermine the long-term stability and decentralization goals of the CHAIN network.
Click to view the current CHAIN Holdings Distribution
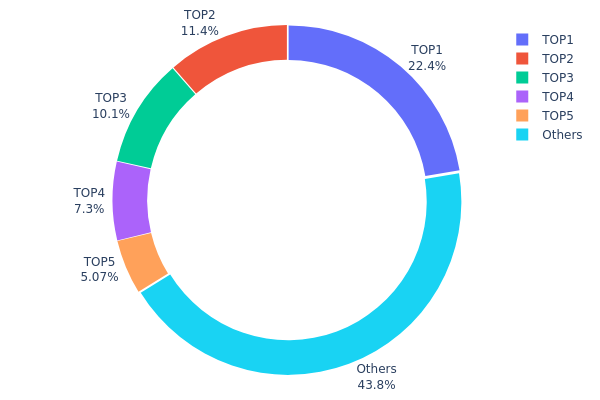
| Top | Address | Holding Qty | Holding (%) |
|---|---|---|---|
| 1 | 0x40ec...5bbbdf | 110466.05K | 22.38% |
| 2 | 0xe89d...0477bf | 56061.29K | 11.35% |
| 3 | 0xee0c...c6e56e | 49750.00K | 10.08% |
| 4 | 0x4744...5dce9c | 36045.25K | 7.30% |
| 5 | 0x9cc1...99018d | 25000.00K | 5.06% |
| - | Others | 216177.40K | 43.83% |
II. Key Factors Affecting CHAIN's Future Price
Supply Mechanism
- Halving: The periodic reduction in block rewards, typically occurring every four years.
- Historical Pattern: Past halvings have often led to price increases due to reduced supply inflation.
- Current Impact: The upcoming halving is expected to potentially drive up the price due to decreased new supply entering the market.
Institutional and Whale Dynamics
- Institutional Holdings: Major financial institutions and corporations have been increasing their CHAIN holdings as a store of value and investment.
- Corporate Adoption: Several Fortune 500 companies have begun accepting CHAIN as a form of payment or holding it on their balance sheets.
- Government Policies: Various countries are developing regulatory frameworks for cryptocurrencies, with some considering CHAIN for national reserves.
Macroeconomic Environment
- Monetary Policy Impact: Central banks' decisions on interest rates and quantitative easing can affect CHAIN's attractiveness as an alternative asset.
- Inflation Hedging Properties: CHAIN has shown potential as a hedge against inflation, particularly in countries experiencing high inflation rates.
- Geopolitical Factors: Global economic uncertainties and geopolitical tensions have occasionally led to increased interest in CHAIN as a safe-haven asset.
Technological Development and Ecosystem Building
- Lightning Network: Continued development and adoption of the Lightning Network for faster and cheaper transactions.
- Taproot Upgrade: Enhanced privacy and smart contract functionality, potentially expanding CHAIN's use cases.
- Ecosystem Applications: Growing number of decentralized finance (DeFi) projects and applications built on CHAIN's blockchain, expanding its utility beyond a store of value.
III. CHAIN Price Prediction for 2025-2030
2025 Outlook
- Conservative prediction: $0.015 - $0.02
- Neutral prediction: $0.02 - $0.025
- Optimistic prediction: $0.025 - $0.02959 (requires favorable market conditions and increased adoption)
2027-2028 Outlook
- Market stage expectation: Potential growth phase with increased volatility
- Price range forecast:
- 2027: $0.02301 - $0.03303
- 2028: $0.02795 - $0.04057
- Key catalysts: Technological advancements, wider industry adoption, and positive regulatory developments
2030 Long-term Outlook
- Base scenario: $0.03744 - $0.04026 (assuming steady market growth and adoption)
- Optimistic scenario: $0.04026 - $0.05797 (assuming accelerated adoption and favorable market conditions)
- Transformative scenario: $0.05797+ (assuming breakthrough use cases and mainstream integration)
- 2030-12-31: CHAIN $0.05797 (potential peak based on optimistic projections)
| 年份 | 预测最高价 | 预测平均价格 | 预测最低价 | 涨跌幅 |
|---|---|---|---|---|
| 2025 | 0.02959 | 0.02055 | 0.015 | 0 |
| 2026 | 0.02908 | 0.02507 | 0.01955 | 22 |
| 2027 | 0.03303 | 0.02708 | 0.02301 | 31 |
| 2028 | 0.04057 | 0.03005 | 0.02795 | 46 |
| 2029 | 0.0452 | 0.03531 | 0.02013 | 71 |
| 2030 | 0.05797 | 0.04026 | 0.03744 | 96 |
IV. CHAIN Professional Investment Strategy and Risk Management
CHAIN Investment Methodology
(1) Long-term Holding Strategy
- Suitable for: Long-term investors interested in blockchain gaming
- Operation suggestions:
- Accumulate CHAIN tokens during market dips
- Stay informed about Chain Games ecosystem developments
- Store tokens securely in a non-custodial wallet
(2) Active Trading Strategy
- Technical analysis tools:
- Moving Averages: Use to identify trends and potential entry/exit points
- Relative Strength Index (RSI): Monitor overbought/oversold conditions
- Key points for swing trading:
- Set clear stop-loss and take-profit levels
- Monitor gaming industry news for potential catalysts
CHAIN Risk Management Framework
(1) Asset Allocation Principles
- Conservative investors: 1-3% of crypto portfolio
- Aggressive investors: 3-5% of crypto portfolio
- Professional investors: 5-10% of crypto portfolio
(2) Risk Hedging Solutions
- Diversification: Spread investments across multiple gaming tokens
- Stop-loss orders: Implement to limit potential losses
(3) Secure Storage Solutions
- Hot wallet recommendation: Gate Web3 Wallet
- Cold storage solution: Hardware wallet for long-term holdings
- Security precautions: Enable two-factor authentication, use strong passwords
V. CHAIN Potential Risks and Challenges
CHAIN Market Risks
- Volatility: High price fluctuations common in small-cap tokens
- Liquidity: Limited trading volume may impact entry/exit
- Competition: Increasing number of blockchain gaming projects
CHAIN Regulatory Risks
- Uncertain regulations: Potential impact on blockchain gaming industry
- Token classification: Risk of being classified as a security
- Cross-border restrictions: Varying regulations in different jurisdictions
CHAIN Technical Risks
- Smart contract vulnerabilities: Potential for exploits or bugs
- Scalability issues: Challenges in handling increased user adoption
- Interoperability: Limitations in cross-chain functionality
VI. Conclusion and Action Recommendations
CHAIN Investment Value Assessment
CHAIN presents potential long-term value in the growing blockchain gaming sector, but faces short-term risks due to market volatility and regulatory uncertainties.
CHAIN Investment Recommendations
✅ Beginners: Start with small positions, focus on learning about the project ✅ Experienced investors: Consider dollar-cost averaging, monitor project milestones ✅ Institutional investors: Conduct thorough due diligence, consider as part of a diversified gaming portfolio
CHAIN Trading Participation Methods
- Spot trading: Buy and hold CHAIN tokens on Gate.com
- Staking: Participate in staking programs if available
- Gaming ecosystem: Engage with Chain Games platform to understand token utility
Cryptocurrency investments carry extremely high risks. This article does not constitute investment advice. Investors should make decisions based on their own risk tolerance and are advised to consult professional financial advisors. Never invest more than you can afford to lose.
FAQ
How much will Chainlink cost in 2030?
Based on current trends and market projections, Chainlink could potentially reach $100-$150 per token by 2030, driven by increased adoption of smart contracts and decentralized oracle networks in various industries.
Can Chainlink hit $100?
Yes, Chainlink could potentially reach $100 by 2025, given its strong fundamentals and growing adoption in the DeFi and Web3 space. However, market conditions and overall crypto trends will play a significant role in determining its price trajectory.
Can Chainlink reach $1000?
While ambitious, reaching $1000 is possible for Chainlink in the long term. Its crucial role in smart contracts and growing adoption could drive significant price appreciation, but it would require substantial market growth and continued technological advancements.
What is the Chainlink prediction for 2025?
Based on market trends and expert analysis, Chainlink (LINK) is predicted to reach around $50-$60 by 2025, potentially seeing a significant increase in value and adoption within the blockchain ecosystem.
Share
Content
Introduction: CHAIN's Market Position and Investment Value
I. CHAIN Price History Review and Current Market Status
II. Key Factors Affecting CHAIN's Future Price
III. CHAIN Price Prediction for 2025-2030
IV. CHAIN Professional Investment Strategy and Risk Management
V. CHAIN Potential Risks and Challenges
VI. Conclusion and Action Recommendations
FAQ

