2025 KTN Price Prediction: Analyzing Market Trends and Potential Growth Factors
Introduction: KTN's Market Position and Investment Value
Kattana (KTN), as a professional trading terminal for cryptocurrency markets, has been enhancing trading experiences since its inception in 2021. As of 2025, Kattana's market capitalization stands at $30,552.24, with a circulating supply of approximately 2,481,904 tokens, and a price hovering around $0.01231. This asset, often referred to as the "bridge between traders and crypto markets," is playing an increasingly crucial role in both DeFi and CeFi sectors of the cryptocurrency ecosystem.
This article will provide a comprehensive analysis of Kattana's price trends from 2025 to 2030, combining historical patterns, market supply and demand, ecosystem development, and macroeconomic factors to offer professional price predictions and practical investment strategies for investors.
I. KTN Price History Review and Current Market Status
KTN Historical Price Evolution Trajectory
- 2021: Project launch, price reached all-time high of $34.36 on April 16
- 2023: Market downturn, price declined significantly
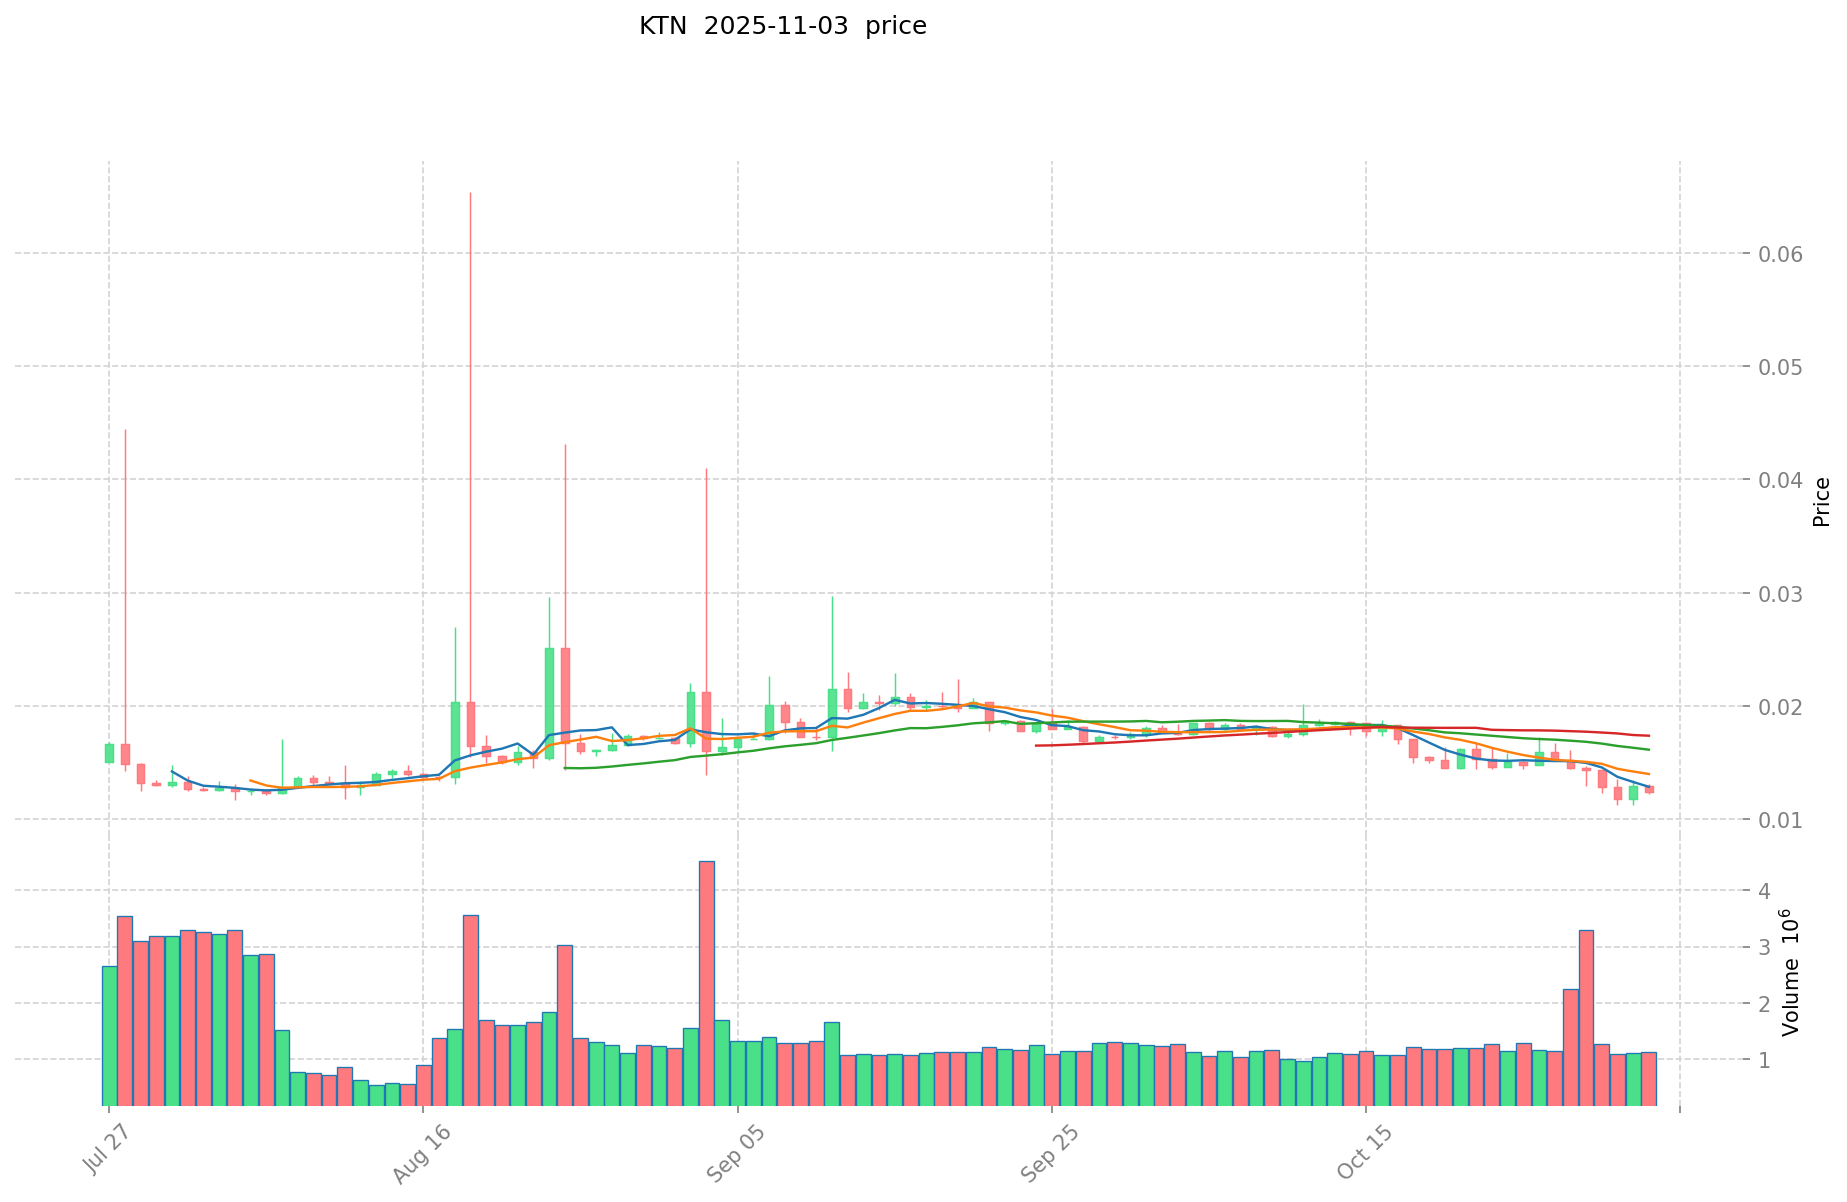
- 2025: Continued bearish trend, price hit all-time low of $0.01144562 on November 1
KTN Current Market Situation
As of November 3, 2025, KTN is trading at $0.01231, with a 24-hour trading volume of $13,680.08. The token has experienced a 3.13% decrease in the last 24 hours. KTN's market capitalization stands at $30,552.25, ranking it 6355th in the overall cryptocurrency market. The circulating supply is 2,481,904.64 KTN, which represents 24.82% of the total supply of 10,000,000 KTN. The token is currently trading 99.96% below its all-time high and 7.55% above its all-time low. Market sentiment appears bearish, with negative price trends across various timeframes: -1.21% in the last hour, -23.5% over the past week, -29.49% in the last month, and -59.75% over the past year.
Click to view the current KTN market price
KTN Market Sentiment Indicator
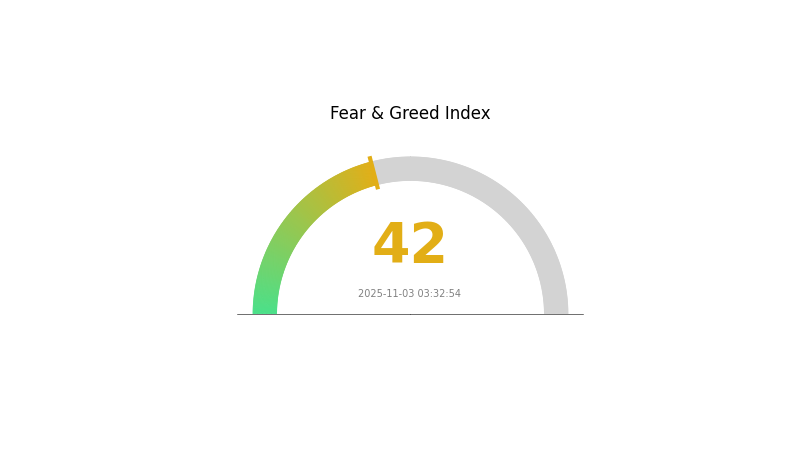
2025-11-03 Fear and Greed Index: 42 (Fear)
Click to view the current Fear & Greed Index
The cryptocurrency market is currently experiencing a period of uncertainty, with the Fear and Greed Index standing at 42, indicating a state of fear. This sentiment suggests that investors are cautious and may be hesitant to make bold moves. During such times, it's crucial to stay informed and consider long-term strategies. Remember, market cycles are natural, and periods of fear can sometimes present opportunities for those with a well-thought-out investment plan. As always, conduct thorough research and consider consulting with financial advisors before making any investment decisions.
KTN Holdings Distribution
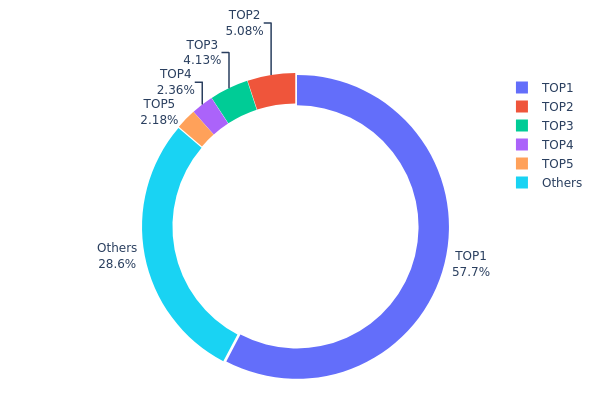
The address holdings distribution data reveals significant concentration in KTN token ownership. The top address holds a dominant 57.70% of the total supply, indicating a highly centralized distribution. The subsequent four largest holders collectively account for an additional 13.72%, bringing the total concentration among the top five addresses to 71.42%.
This level of concentration raises concerns about market stability and potential price manipulation. With a single address controlling over half the supply, there's a risk of significant market impact should this holder decide to liquidate or transfer large portions of their holdings. The high concentration also suggests limited circulation among a broader user base, potentially affecting liquidity and price discovery mechanisms.
From a market structure perspective, this distribution pattern indicates a low degree of decentralization for KTN. While blockchain technology aims to promote distributed ownership, the current state of KTN holdings suggests a more traditional, centralized ownership model. This could impact the token's resilience to market shocks and its ability to maintain a stable, organic price discovery process.
Click to view the current KTN Holdings Distribution
| Top | Address | Holding Qty | Holding (%) |
|---|---|---|---|
| 1 | 0x6063...0f43bd | 5770.02K | 57.70% |
| 2 | 0xcb12...5f8ebd | 507.82K | 5.07% |
| 3 | 0x0000...000002 | 413.21K | 4.13% |
| 4 | 0x21a0...70b3be | 235.81K | 2.35% |
| 5 | 0xd0be...529be0 | 217.74K | 2.17% |
| - | Others | 2855.40K | 28.58% |
II. Key Factors Affecting KTN's Future Price
Supply Mechanism
- Market Supply and Demand: The balance between supply and demand is a crucial factor influencing KTN's price.
- Historical Patterns: Past supply changes have shown significant impact on price fluctuations.
- Current Impact: Expected supply changes are likely to affect the price in the near future.
Macroeconomic Environment
- Monetary Policy Impact: Major central banks' policy expectations will play a role in KTN's price movement.
- Inflation Hedging Properties: KTN's performance in inflationary environments may influence its price.
- Geopolitical Factors: International situations and conflicts could affect KTN's value.
Technological Development and Ecosystem Building
- Ecosystem Applications: Major DApps and ecosystem projects related to KTN could drive its price.
III. KTN Price Prediction for 2025-2030
2025 Outlook
- Conservative prediction: $0.00911 - $0.01231
- Neutral prediction: $0.01231 - $0.01490
- Optimistic prediction: $0.01490 - $0.01748 (requires favorable market conditions)
2027-2028 Outlook
- Market phase expectation: Potential growth phase
- Price range forecast:
- 2027: $0.01273 - $0.01854
- 2028: $0.01130 - $0.01781
- Key catalysts: Increasing adoption and technological improvements
2029-2030 Long-term Outlook
- Base scenario: $0.01415 - $0.01869 (assuming steady market growth)
- Optimistic scenario: $0.01869 - $0.02676 (assuming strong market performance)
- Transformative scenario: $0.02676+ (assuming breakthrough innovations and mass adoption)
- 2030-12-31: KTN $0.02676 (potential peak price)
| 年份 | 预测最高价 | 预测平均价格 | 预测最低价 | 涨跌幅 |
|---|---|---|---|---|
| 2025 | 0.01748 | 0.01231 | 0.00911 | 0 |
| 2026 | 0.01653 | 0.0149 | 0.01177 | 21 |
| 2027 | 0.01854 | 0.01571 | 0.01273 | 27 |
| 2028 | 0.01781 | 0.01713 | 0.0113 | 39 |
| 2029 | 0.01869 | 0.01747 | 0.01415 | 41 |
| 2030 | 0.02676 | 0.01808 | 0.01302 | 46 |
IV. Professional Investment Strategies and Risk Management for KTN
KTN Investment Methodology
(1) Long-term Holding Strategy
- Suitable for: Risk-tolerant investors with a long-term perspective
- Operation suggestions:
- Accumulate KTN during market dips
- Set price targets for partial profit-taking
- Store KTN in secure non-custodial wallets
(2) Active Trading Strategy
- Technical analysis tools:
- Moving Averages: Monitor short-term and long-term trends
- RSI: Identify overbought and oversold conditions
- Key points for swing trading:
- Set stop-loss orders to limit potential losses
- Take profits at predetermined resistance levels
KTN Risk Management Framework
(1) Asset Allocation Principles
- Conservative investors: 1-3%
- Aggressive investors: 5-10%
- Professional investors: 10-20%
(2) Risk Hedging Solutions
- Diversification: Spread investments across multiple crypto assets
- Stop-loss orders: Implement to limit potential losses
(3) Secure Storage Solutions
- Hot wallet recommendation: Gate Web3 Wallet
- Cold storage solution: Hardware wallet for long-term holdings
- Security precautions: Enable two-factor authentication, use strong passwords
V. Potential Risks and Challenges for KTN
KTN Market Risks
- High volatility: KTN price can experience significant fluctuations
- Limited liquidity: May affect ability to execute large trades
- Market sentiment: Susceptible to broader crypto market trends
KTN Regulatory Risks
- Uncertain regulatory environment: Potential for stricter regulations
- Compliance issues: Risk of non-compliance with future regulations
- Cross-border restrictions: Possibility of limitations in certain jurisdictions
KTN Technical Risks
- Smart contract vulnerabilities: Potential for exploits or bugs
- Network congestion: May affect transaction speed and costs
- Technological obsolescence: Risk of being outpaced by newer projects
VI. Conclusion and Action Recommendations
KTN Investment Value Assessment
KTN presents a high-risk, high-potential investment opportunity in the professional trading terminal space. While it offers innovative solutions for crypto traders, its low market cap and limited adoption pose significant short-term risks.
KTN Investment Recommendations
✅ Beginners: Consider small, experimental positions after thorough research
✅ Experienced investors: Implement dollar-cost averaging with strict risk management
✅ Institutional investors: Conduct comprehensive due diligence and consider as part of a diversified crypto portfolio
KTN Trading Participation Methods
- Spot trading: Purchase KTN on Gate.com
- Limit orders: Set buy orders at desired entry points
- DCA strategy: Regularly invest small amounts to average out price volatility
Cryptocurrency investments carry extremely high risks, and this article does not constitute investment advice. Investors should make decisions carefully based on their own risk tolerance and are advised to consult professional financial advisors. Never invest more than you can afford to lose.
FAQ
What crypto has the highest price prediction?
Bitcoin is predicted to have the highest price in 2025, based on historical trends and market analysis.
What is the price target for CLNE in 2025?
The price target for CLNE in 2025 is $5, implying a 51% upside potential. CLNE ranks 4th in its sector.
Which AI is best for stock price prediction?
GARCH(1,1) combined with AI models is considered the best for stock price prediction.
Is the Kyber network a good investment today?
Yes, Kyber Network appears to be a promising investment. Current market analysis suggests a potential 5.27% ROI by 2026, indicating modest but positive growth prospects for the network.
Share
Content
Introduction: KTN's Market Position and Investment Value
I. KTN Price History Review and Current Market Status
II. Key Factors Affecting KTN's Future Price
III. KTN Price Prediction for 2025-2030
IV. Professional Investment Strategies and Risk Management for KTN
V. Potential Risks and Challenges for KTN
VI. Conclusion and Action Recommendations
FAQ

