2025 MORE Price Prediction: Analyzing Market Trends and Potential Growth Factors
Introduction: MORE's Market Position and Investment Value
Moonveil (MORE), as a full-stack Web3 gaming ecosystem, has made significant strides since its inception. As of 2025, Moonveil's market capitalization stands at $4,663,008, with a circulating supply of approximately 179,900,000 tokens, and a price hovering around $0.02592. This asset, often referred to as a "game-changer in Web3 gaming," is playing an increasingly crucial role in the intersection of blockchain technology and gaming.
This article will comprehensively analyze Moonveil's price trends from 2025 to 2030, taking into account historical patterns, market supply and demand, ecosystem development, and the macroeconomic environment, to provide investors with professional price predictions and practical investment strategies.
I. MORE Price History Review and Current Market Status
MORE Historical Price Evolution
- 2025: Project launch and token listing, price reached ATH of $0.22
- 2025: Market correction, price dropped to ATL of $0.01518
MORE Current Market Situation
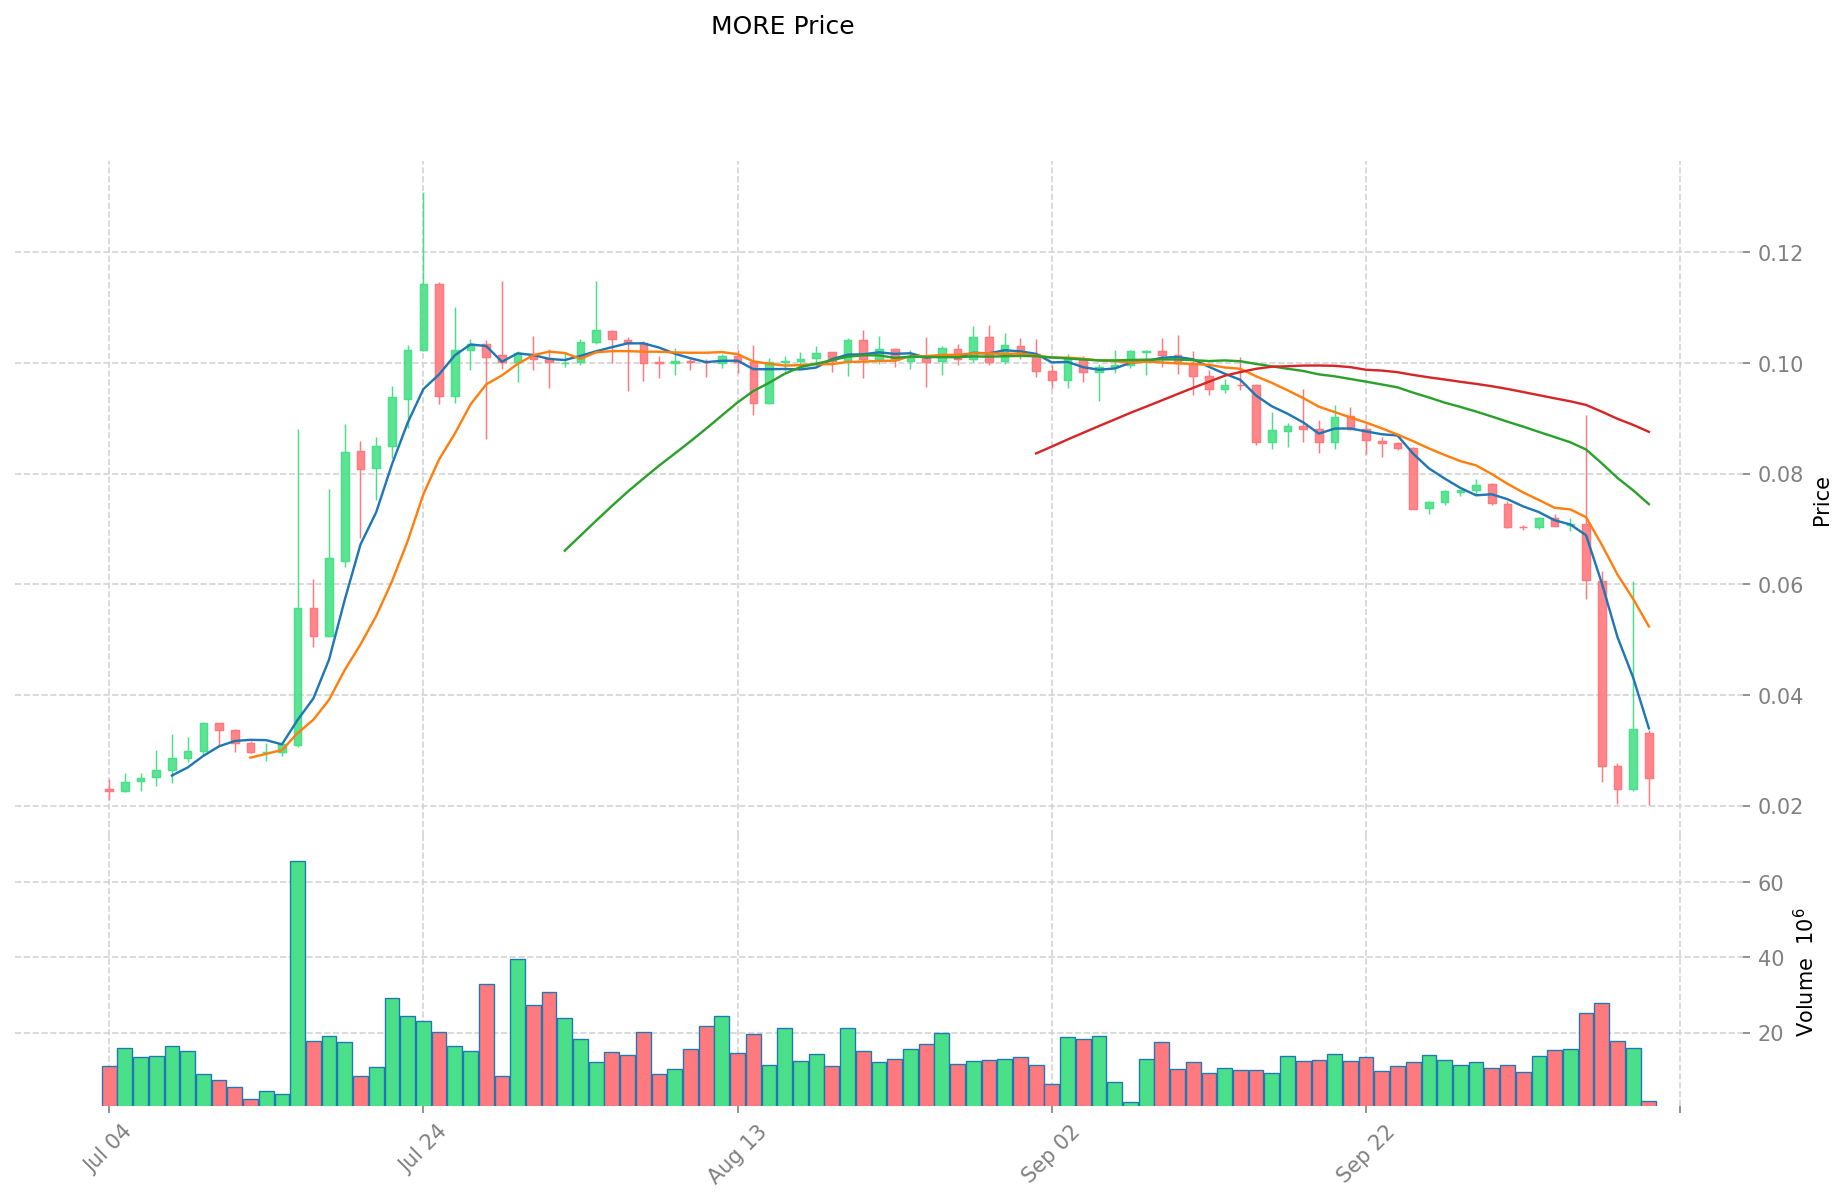
As of October 11, 2025, MORE is trading at $0.02592, with a 24-hour trading volume of $56,040.97. The token has experienced a significant decline of 20.6% in the past 24 hours. The current market capitalization stands at $4,663,008, ranking 1768th in the overall cryptocurrency market.
MORE's price is currently 88.22% below its all-time high of $0.22, which was recorded on June 27, 2025. On the other hand, it is trading 70.75% above its all-time low of $0.01518, also set on June 27, 2025.
The token has shown high volatility in recent periods, with a 63.81% decrease over the past week and a 74.18% drop in the last 30 days. The current market sentiment for MORE appears to be bearish, reflecting the overall cryptocurrency market conditions.
Click to view the current MORE market price
MORE Market Sentiment Indicator
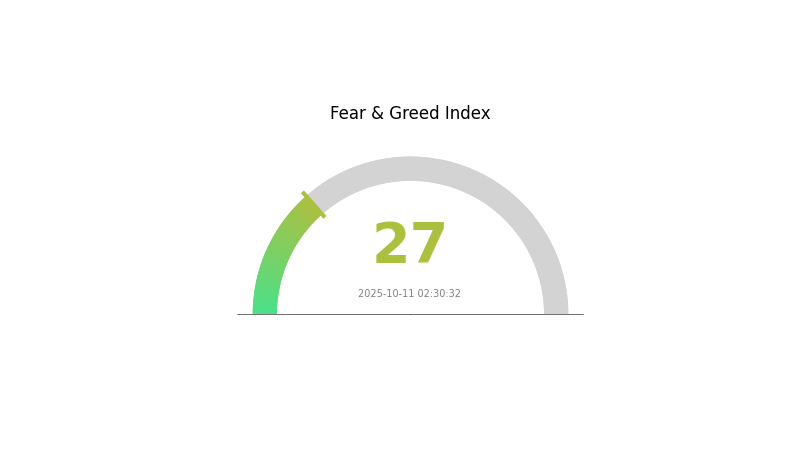
2025-10-11 Fear and Greed Index: 27 (Fear)
Click to view the current Fear & Greed Index
The crypto market sentiment remains cautious as the Fear and Greed Index stands at 27, indicating a state of fear. This suggests that investors are hesitant and uncertain about market conditions. During such periods, some seasoned traders may view it as a potential buying opportunity, adhering to the contrarian investment strategy of "be fearful when others are greedy, and greedy when others are fearful." However, it's crucial to conduct thorough research and risk assessment before making any investment decisions in the volatile crypto market.
MORE Holdings Distribution
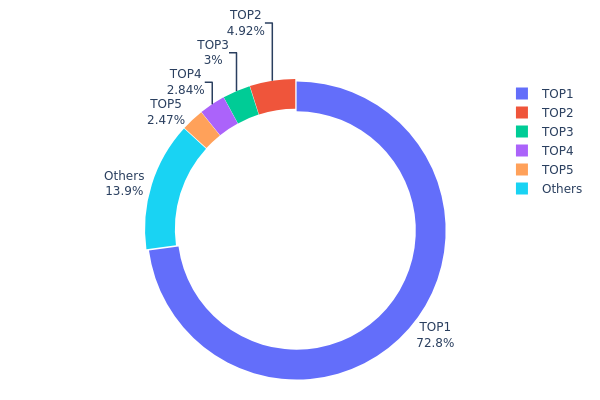
The address holdings distribution chart provides crucial insights into the concentration of MORE tokens among different wallet addresses. Analysis of the data reveals a highly centralized distribution pattern, with the top address holding a substantial 72.84% of the total supply, equivalent to 728,458.23K MORE tokens. This level of concentration raises significant concerns about the token's decentralization and market stability.
The top five addresses collectively control 86.04% of the total MORE supply, leaving only 13.96% distributed among all other holders. Such a skewed distribution could potentially lead to increased market volatility and susceptibility to price manipulation. The dominant position of the top address, in particular, poses a risk of large-scale sell-offs that could dramatically impact the token's value.
This concentration pattern suggests a relatively low level of decentralization for MORE, which may impact its resilience and governance structure. Potential investors should be aware that such a distribution could lead to increased price volatility and reduced liquidity in the market.
Click to view the current MORE Holdings Distribution
| Top | Address | Holding Qty | Holding (%) |
|---|---|---|---|
| 1 | 0x0beb...1b951f | 728458.23K | 72.84% |
| 2 | 0x2ff7...b4de41 | 49231.65K | 4.92% |
| 3 | 0x93de...85d976 | 29997.21K | 2.99% |
| 4 | 0x15c4...49c15c | 28368.06K | 2.83% |
| 5 | 0x73d8...4946db | 24673.50K | 2.46% |
| - | Others | 139271.35K | 13.96% |
II. Key Factors Influencing MORE's Future Price
Technical Development and Ecosystem Building
- Core Protocol Upgrades: Improvements in transaction privacy and efficiency through upgrades like Taproot, which implemented Schnorr signatures and Merkle Abstract Syntax Tree (MAST).
Macroeconomic Environment
- Monetary Policy Impact: Expected central bank policies, particularly interest rate decisions, will significantly influence MORE's price.
- Inflation Hedging Properties: MORE's performance in inflationary environments may affect its price trajectory.
- Geopolitical Factors: International political situations and conflicts could impact MORE's market value.
III. MORE Price Prediction for 2025-2030
2025 Outlook
- Conservative prediction: $0.01434 - $0.02608
- Neutral prediction: $0.02608 - $0.0339
- Optimistic prediction: $0.0339 - $0.04 (requires significant market recovery and increased adoption)
2027-2028 Outlook
- Market phase expectation: Potential growth phase with increased volatility
- Price range forecast:
- 2027: $0.01606 - $0.03401
- 2028: $0.02063 - $0.04618
- Key catalysts: Technological advancements, broader cryptocurrency market trends, and regulatory developments
2029-2030 Long-term Outlook
- Base scenario: $0.03947 - $0.04361 (assuming steady market growth and adoption)
- Optimistic scenario: $0.04775 - $0.06411 (assuming favorable market conditions and increased utility)
- Transformative scenario: $0.07 - $0.08 (assuming breakthrough innovations and mainstream adoption)
- 2030-12-31: MORE $0.06411 (potential peak based on optimistic projections)
| 年份 | 预测最高价 | 预测平均价格 | 预测最低价 | 涨跌幅 |
|---|---|---|---|---|
| 2025 | 0.0339 | 0.02608 | 0.01434 | 0 |
| 2026 | 0.03299 | 0.02999 | 0.02099 | 15 |
| 2027 | 0.03401 | 0.03149 | 0.01606 | 21 |
| 2028 | 0.04618 | 0.03275 | 0.02063 | 26 |
| 2029 | 0.04775 | 0.03947 | 0.02605 | 52 |
| 2030 | 0.06411 | 0.04361 | 0.02399 | 68 |
IV. MORE Professional Investment Strategies and Risk Management
MORE Investment Methodology
(1) Long-term Holding Strategy
- Suitable for: Long-term investors with high risk tolerance
- Operation suggestions:
- Accumulate MORE tokens during market dips
- Set price targets and regularly review portfolio
- Store tokens in secure non-custodial wallets
(2) Active Trading Strategy
- Technical analysis tools:
- Moving Averages: Use to identify trends and potential entry/exit points
- RSI (Relative Strength Index): Monitor overbought/oversold conditions
- Key points for swing trading:
- Monitor project developments and announcements
- Set stop-loss orders to manage downside risk
MORE Risk Management Framework
(1) Asset Allocation Principles
- Conservative investors: 1-3% of crypto portfolio
- Aggressive investors: 5-10% of crypto portfolio
- Professional investors: Up to 15% of crypto portfolio
(2) Risk Hedging Solutions
- Diversification: Spread investments across multiple crypto assets
- Dollar-Cost Averaging: Regular small purchases to reduce timing risk
(3) Secure Storage Solutions
- Hot wallet recommendation: Gate Web3 Wallet
- Cold storage solution: Hardware wallet for long-term holdings
- Security precautions: Enable 2FA, use strong passwords, and regularly update software
V. MORE Potential Risks and Challenges
MORE Market Risks
- High volatility: Significant price fluctuations common in crypto markets
- Liquidity risk: Potential difficulty in selling large amounts without affecting price
- Market sentiment: Susceptible to rapid changes based on news or trends
MORE Regulatory Risks
- Regulatory uncertainty: Potential for new regulations affecting crypto gaming
- Cross-border compliance: Challenges in adhering to varying international regulations
- Tax implications: Evolving tax laws may impact token holders
MORE Technical Risks
- Smart contract vulnerabilities: Potential for exploits or bugs in the protocol
- Scalability challenges: Possible network congestion as user base grows
- Interoperability issues: Risks associated with multi-chain compatibility
VI. Conclusion and Action Recommendations
MORE Investment Value Assessment
MORE presents a unique opportunity in the Web3 gaming ecosystem, combining game development, publishing, and L2 infrastructure. While it offers long-term potential in the growing blockchain gaming sector, investors should be aware of the high volatility and regulatory uncertainties in the short term.
MORE Investment Recommendations
✅ Beginners: Start with small investments, focus on learning about the project and ecosystem ✅ Experienced investors: Consider a balanced approach, combining long-term holding with strategic trading ✅ Institutional investors: Conduct thorough due diligence and consider larger positions as part of a diversified crypto portfolio
MORE Trading Participation Methods
- Spot trading: Buy and sell MORE tokens on Gate.com
- Staking: Participate in staking programs if available to earn additional rewards
- Node operation: Consider running a node to support the network (subject to availability)
Cryptocurrency investments carry extremely high risks, and this article does not constitute investment advice. Investors should make decisions carefully based on their own risk tolerance and are advised to consult professional financial advisors. Never invest more than you can afford to lose.
FAQ
Will Solana reach 1000?
While possible, Solana reaching $1,000 depends on market conditions and crypto trends. It's an ambitious target requiring significant growth and adoption.
How much will 1 Bitcoin be worth in 2030?
Based on various projections, 1 Bitcoin could be worth between $500,000 to $1,000,000 by 2030. However, these are speculative estimates and actual values may vary significantly.
What crypto has the highest price prediction?
Bitcoin has the highest price prediction, with forecasts reaching $139,249. Chainlink follows with a predicted peak of $59.67.
What is the price prediction for Bitcoin in 2025?
Bitcoin is expected to reach $126,000-$200,000 by the end of 2025, driven by ETF inflows and lower real yields. However, a stronger dollar could push it down to $95,000-$110,000.
Share
Content
Introduction: MORE's Market Position and Investment Value
I. MORE Price History Review and Current Market Status
II. Key Factors Influencing MORE's Future Price
III. MORE Price Prediction for 2025-2030
IV. MORE Professional Investment Strategies and Risk Management
V. MORE Potential Risks and Challenges
VI. Conclusion and Action Recommendations
FAQ

