2025 MPrice Prediction: Analyzing Future Trends and Market Dynamics for Sustainable Growth
Introduction: M's Market Position and Investment Value
MemeCore (M), as the first Layer 1 blockchain built for the Meme 2.0 era, has been transforming the meme coin landscape since its inception. As of 2025, MemeCore's market capitalization has reached $3.30 billion, with a circulating supply of approximately 1.68 billion tokens, and a price hovering around $1.97. This asset, hailed as the "Viral Economy Pioneer," is playing an increasingly crucial role in revolutionizing the meme coin ecosystem and digital culture economy.
This article will provide a comprehensive analysis of MemeCore's price trends from 2025 to 2030, combining historical patterns, market supply and demand, ecosystem development, and macroeconomic factors to offer professional price predictions and practical investment strategies for investors.
I. M Price History Review and Current Market Status
M Historical Price Evolution
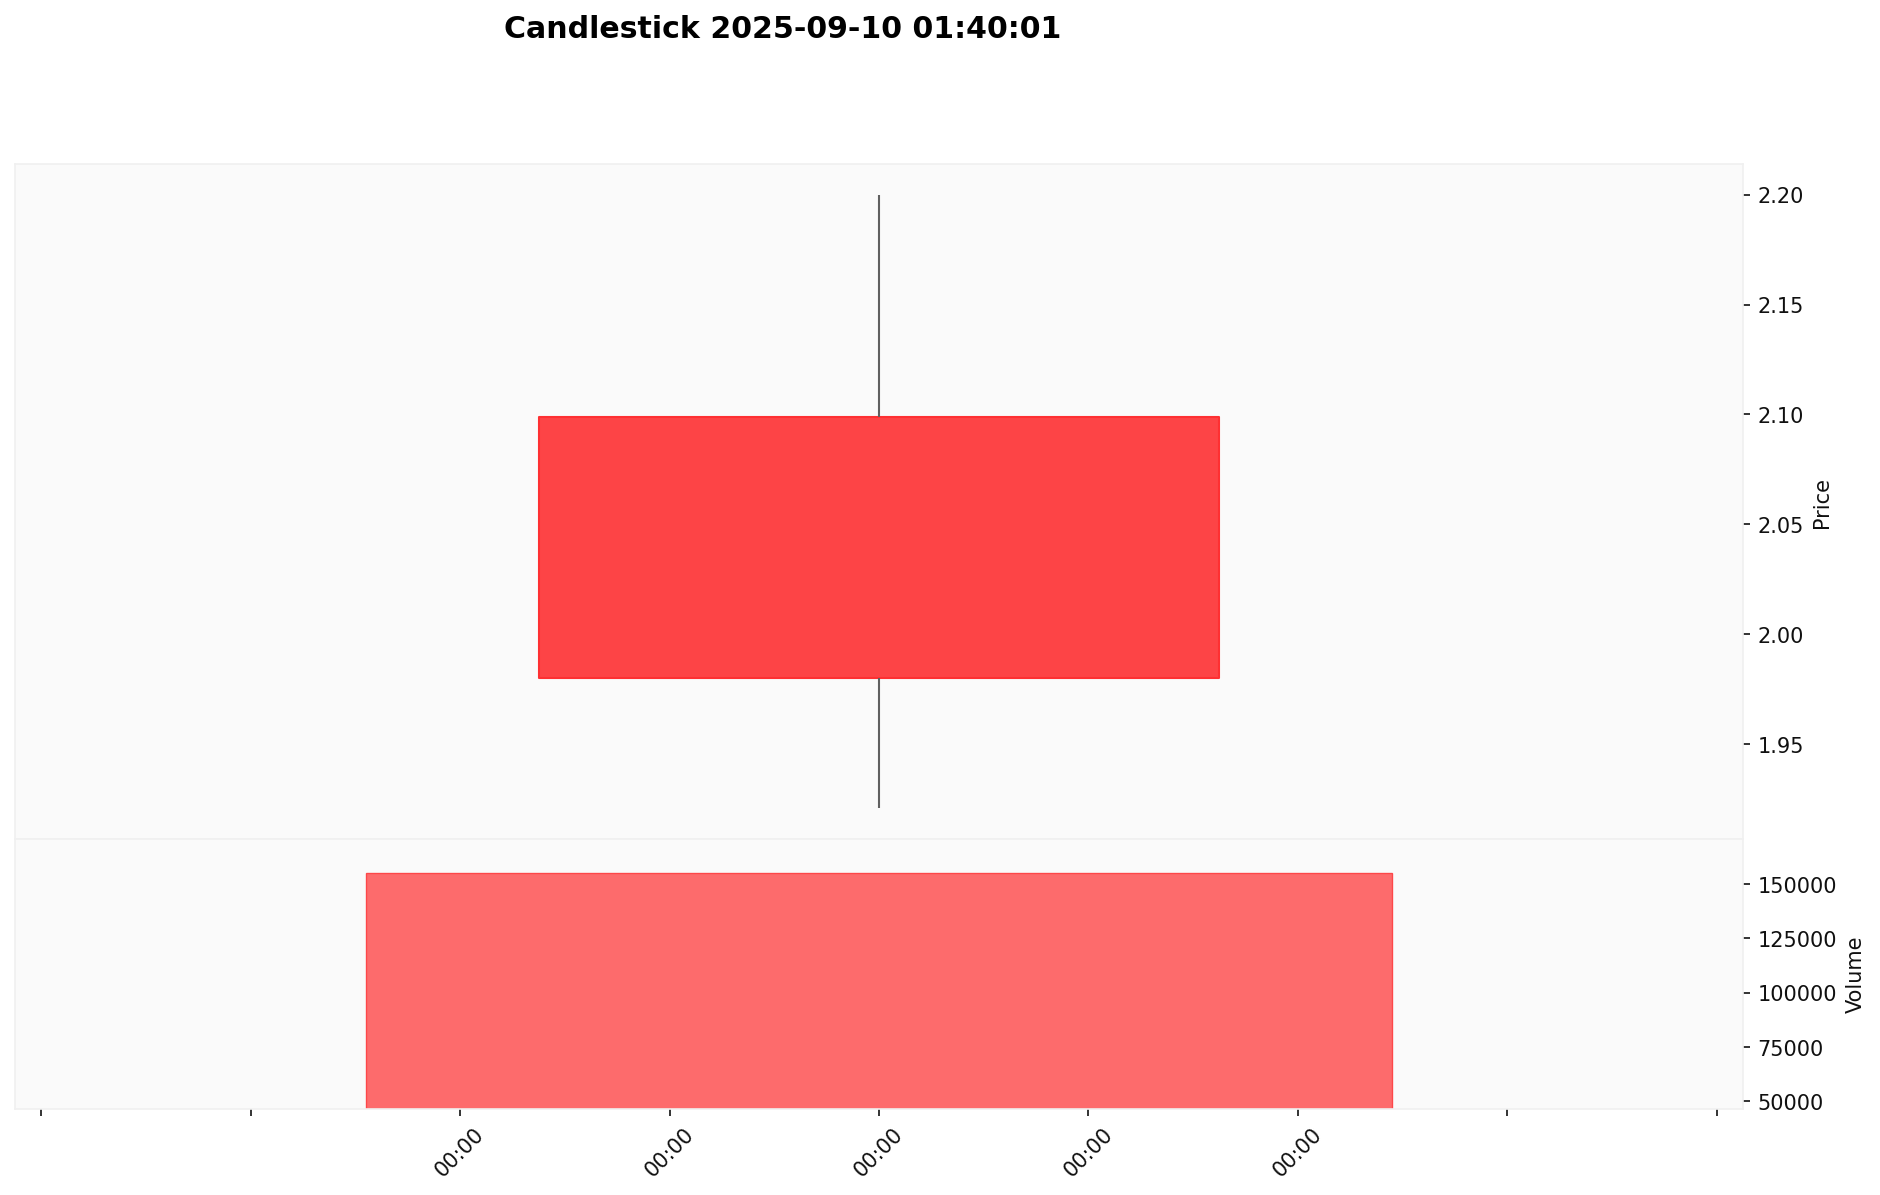
- 2025: MemeCore launch, price surged to $2.2 (ATH)
- 2025: Market correction, price dropped to $1.9185 (ATL)
M Current Market Situation
MemeCore (M) is currently trading at $1.9688, experiencing a 5.9% decrease in the last 24 hours. Despite this short-term dip, M has shown remarkable growth over longer periods, with a 138.26% increase in the past week and an impressive 318.91% gain over the last 30 days. The token's market capitalization stands at $3,302,221,413, ranking it 46th in the overall cryptocurrency market. With a circulating supply of 1,677,276,215 M tokens, representing 33.55% of the total supply, MemeCore has a fully diluted valuation of $9,844,000,000. The 24-hour trading volume is $321,962, indicating active market participation.
Click to view the current M market price
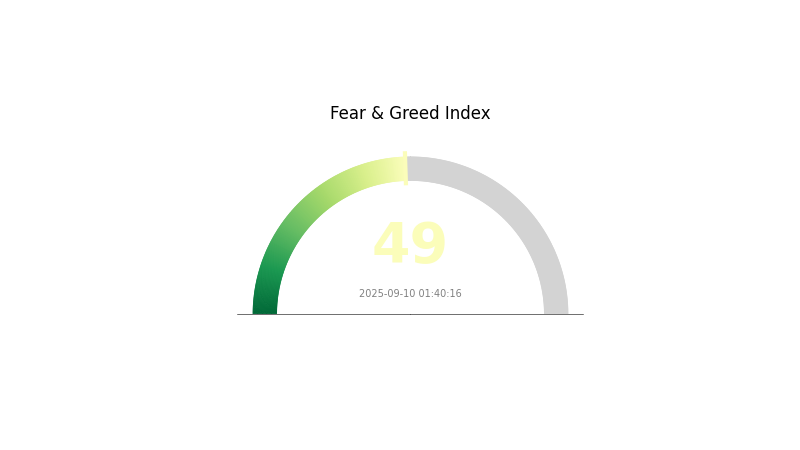
Market Sentiment Indicator
2025-09-10 Fear and Greed Index: 49 (Neutral)
Click to view the current Fear & Greed Index
The crypto market sentiment remains balanced as the Fear and Greed Index hovers at 49, indicating a neutral stance among investors. This equilibrium suggests a period of stability in the market, with neither extreme fear nor excessive optimism dominating trader behavior. Investors should remain vigilant and consider diversifying their portfolios while keeping an eye on potential market shifts. As always, it's crucial to conduct thorough research and manage risk effectively when making investment decisions in the volatile crypto space.
M Holdings Distribution
The address holdings distribution chart provides insight into the concentration of M tokens among different wallet addresses. Based on the provided data, it appears that there is currently no significant concentration of M tokens in any single address. This relatively even distribution suggests a healthy level of decentralization within the M network.
The lack of dominant holders reduces the risk of market manipulation and contributes to a more stable price structure for M. It indicates that no single entity has disproportionate control over the token supply, which is generally considered a positive sign for the token's market dynamics and overall ecosystem health.
This distribution pattern reflects positively on M's decentralization efforts and suggests a robust on-chain structure. It potentially indicates a diverse user base and could be interpreted as a sign of organic growth in the M ecosystem.
Click to view the current M Holdings Distribution

| Top | Address | Holding Qty | Holding (%) |
|---|
II. Key Factors Affecting M's Future Price
Supply Mechanism
- Fixed Maximum Supply: MemeCore (M) has a maximum supply of 10 billion tokens.
- Current Impact: With a circulating supply of 1,039,501,066 tokens out of a total supply of 5,264,317,858.42, the limited availability may create scarcity and potentially drive up prices.
Institutional and Whale Dynamics
- Enterprise Adoption: MemeCore is positioning itself as a platform for meme culture and digital assets, which may attract businesses looking to leverage meme marketing.
Macroeconomic Environment
- Inflation Hedging Properties: As a cryptocurrency, MemeCore may be viewed as a potential hedge against inflation, similar to other digital assets.
Technical Development and Ecosystem Building
- MemeCore Platform: The project aims to establish itself as a new cultural asset platform for memes, potentially driving long-term value.
- Ecosystem Applications: MemeCore is developing various applications within its ecosystem, including DeFi, staking, and Web3 services.
- Technological Upgrades: The project incorporates AI memes and IP memes, suggesting ongoing technological advancements in the meme creation and distribution process.
III. M Price Prediction for 2025-2030
2025 Outlook
- Conservative prediction: $1.71 - $1.85
- Neutral prediction: $1.85 - $2.00
- Optimistic prediction: $2.00 - $2.17 (requires favorable market conditions)
2027-2028 Outlook
- Market stage expectation: Potential growth phase
- Price range forecast:
- 2027: $2.14 - $3.09
- 2028: $2.47 - $3.48
- Key catalysts: Increased adoption, technological advancements
2030 Long-term Outlook
- Base scenario: $2.59 - $3.20 (assuming steady market growth)
- Optimistic scenario: $3.20 - $4.00 (assuming strong market performance)
- Transformative scenario: $4.00 - $4.74 (assuming breakthrough innovations and widespread adoption)
- 2030-12-31: M $3.20 (62% increase from 2025)
| 年份 | 预测最高价 | 预测平均价格 | 预测最低价 | 涨跌幅 |
|---|---|---|---|---|
| 2025 | 2.16843 | 1.9713 | 1.71503 | 0 |
| 2026 | 2.95991 | 2.06987 | 1.22122 | 4 |
| 2027 | 3.09331 | 2.51489 | 2.13765 | 27 |
| 2028 | 3.47708 | 2.8041 | 2.46761 | 41 |
| 2029 | 3.26621 | 3.14059 | 3.01497 | 59 |
| 2030 | 4.74103 | 3.2034 | 2.59476 | 62 |
IV. Professional Investment Strategies and Risk Management for M
M Investment Methodology
(1) Long-term Holding Strategy
- Suitable for: Long-term investors and believers in the MemeCore ecosystem
- Operation suggestions:
- Accumulate M tokens during market dips
- Participate in MemeCore's viral economy to earn rewards
- Store tokens in secure wallets with regular backups
(2) Active Trading Strategy
- Technical analysis tools:
- Moving Averages: Use to identify trends and potential entry/exit points
- Relative Strength Index (RSI): Monitor overbought/oversold conditions
- Key points for swing trading:
- Monitor social media sentiment and viral content trends
- Pay attention to transaction volume spikes on the MemeCore blockchain
M Risk Management Framework
(1) Asset Allocation Principles
- Conservative investors: 1-3% of crypto portfolio
- Aggressive investors: 5-10% of crypto portfolio
- Professional investors: Up to 15% of crypto portfolio
(2) Risk Hedging Solutions
- Diversification: Spread investments across different meme coins and blockchain projects
- Stop-loss orders: Set automatic sell orders to limit potential losses
(3) Secure Storage Solutions
- Hot wallet recommendation: Gate Web3 Wallet
- Cold storage solution: Hardware wallets for long-term holdings
- Security precautions: Enable two-factor authentication, use strong passwords, and be cautious of phishing attempts
V. Potential Risks and Challenges for M
M Market Risks
- High volatility: Meme coins are known for extreme price fluctuations
- Market sentiment shifts: Rapid changes in social media trends can impact value
- Competition: Other meme coins may emerge and capture market share
M Regulatory Risks
- Uncertain regulatory landscape: Potential for increased scrutiny of meme coins
- Cross-border restrictions: Some countries may impose limitations on meme coin trading
- Tax implications: Evolving tax laws may affect meme coin investments
M Technical Risks
- Smart contract vulnerabilities: Potential for bugs or exploits in the MemeCore blockchain
- Scalability challenges: Rapid growth may stress network capacity
- Cyber attacks: Risk of hacks or DDoS attacks on the MemeCore network
VI. Conclusion and Action Recommendations
M Investment Value Assessment
MemeCore (M) presents a unique proposition in the evolving meme coin landscape, offering potential long-term value through its viral economy model. However, it carries significant short-term risks due to high volatility and regulatory uncertainties.
M Investment Recommendations
✅ Beginners: Start with small investments, focus on understanding the MemeCore ecosystem ✅ Experienced investors: Consider allocating a portion of your crypto portfolio, actively engage in the viral economy ✅ Institutional investors: Conduct thorough due diligence, consider M as part of a diversified crypto strategy
M Trading Participation Methods
- Spot trading: Buy and hold M tokens on Gate.com
- Futures trading: Leverage positions with M perpetual contracts on Gate.com
- Participation in MemeCore's viral economy: Engage in content creation and sharing to earn rewards
Cryptocurrency investment carries extremely high risk. This article does not constitute investment advice. Investors should make decisions carefully based on their own risk tolerance and are advised to consult professional financial advisors. Never invest more than you can afford to lose.
FAQ
How much is Meta worth in 2025?
Meta's worth in 2025 is $1.89 trillion, based on its projected market capitalization.
What is the forecast for m stock?
The forecast for M stock shows a price target range of $6.06 to $24.27, with an average target of $13.50, based on Wall Street analysts' predictions for the next year.
What is the 12 month forecast for Moderna stock?
Based on analyst ratings, Moderna's 12-month price target is $46.00, with an 82.98% upside potential.
What is the price target for WM 2025?
The price target for WM in 2025 is projected to be between $229.00 and $277.00, with an average target representing a 16.52% upside.
Share
Content
Introduction: M's Market Position and Investment Value
I. M Price History Review and Current Market Status
II. Key Factors Affecting M's Future Price
III. M Price Prediction for 2025-2030
IV. Professional Investment Strategies and Risk Management for M
V. Potential Risks and Challenges for M
VI. Conclusion and Action Recommendations
FAQ

