2025 POWER Price Prediction: Navigating the Crypto Market's Future Landscape
Introduction: POWER's Market Position and Investment Value
Powerloom (POWER), as a composable data network ensuring hassle-free access to reliable, verifiable onchain insights for consumers in web3, has been making strides since its inception. As of 2025, POWER's market capitalization has reached $528,508, with a circulating supply of approximately 173,111,108 tokens, and a price hovering around $0.003053. This asset, dubbed the "Web3 Data Insight Enabler," is playing an increasingly crucial role in providing reliable and verifiable blockchain data insights.
This article will comprehensively analyze POWER's price trends from 2025 to 2030, combining historical patterns, market supply and demand, ecosystem development, and macroeconomic environment to provide investors with professional price predictions and practical investment strategies.
I. POWER Price History Review and Current Market Status
POWER Historical Price Evolution
- January 2025: POWER launched at $0.23, marking its entry into the cryptocurrency market
- October 2025: POWER reached its all-time high of $0.36, a 56.52% increase from its launch price
- November 2025: POWER experienced a significant decline, hitting its all-time low of $0.002501
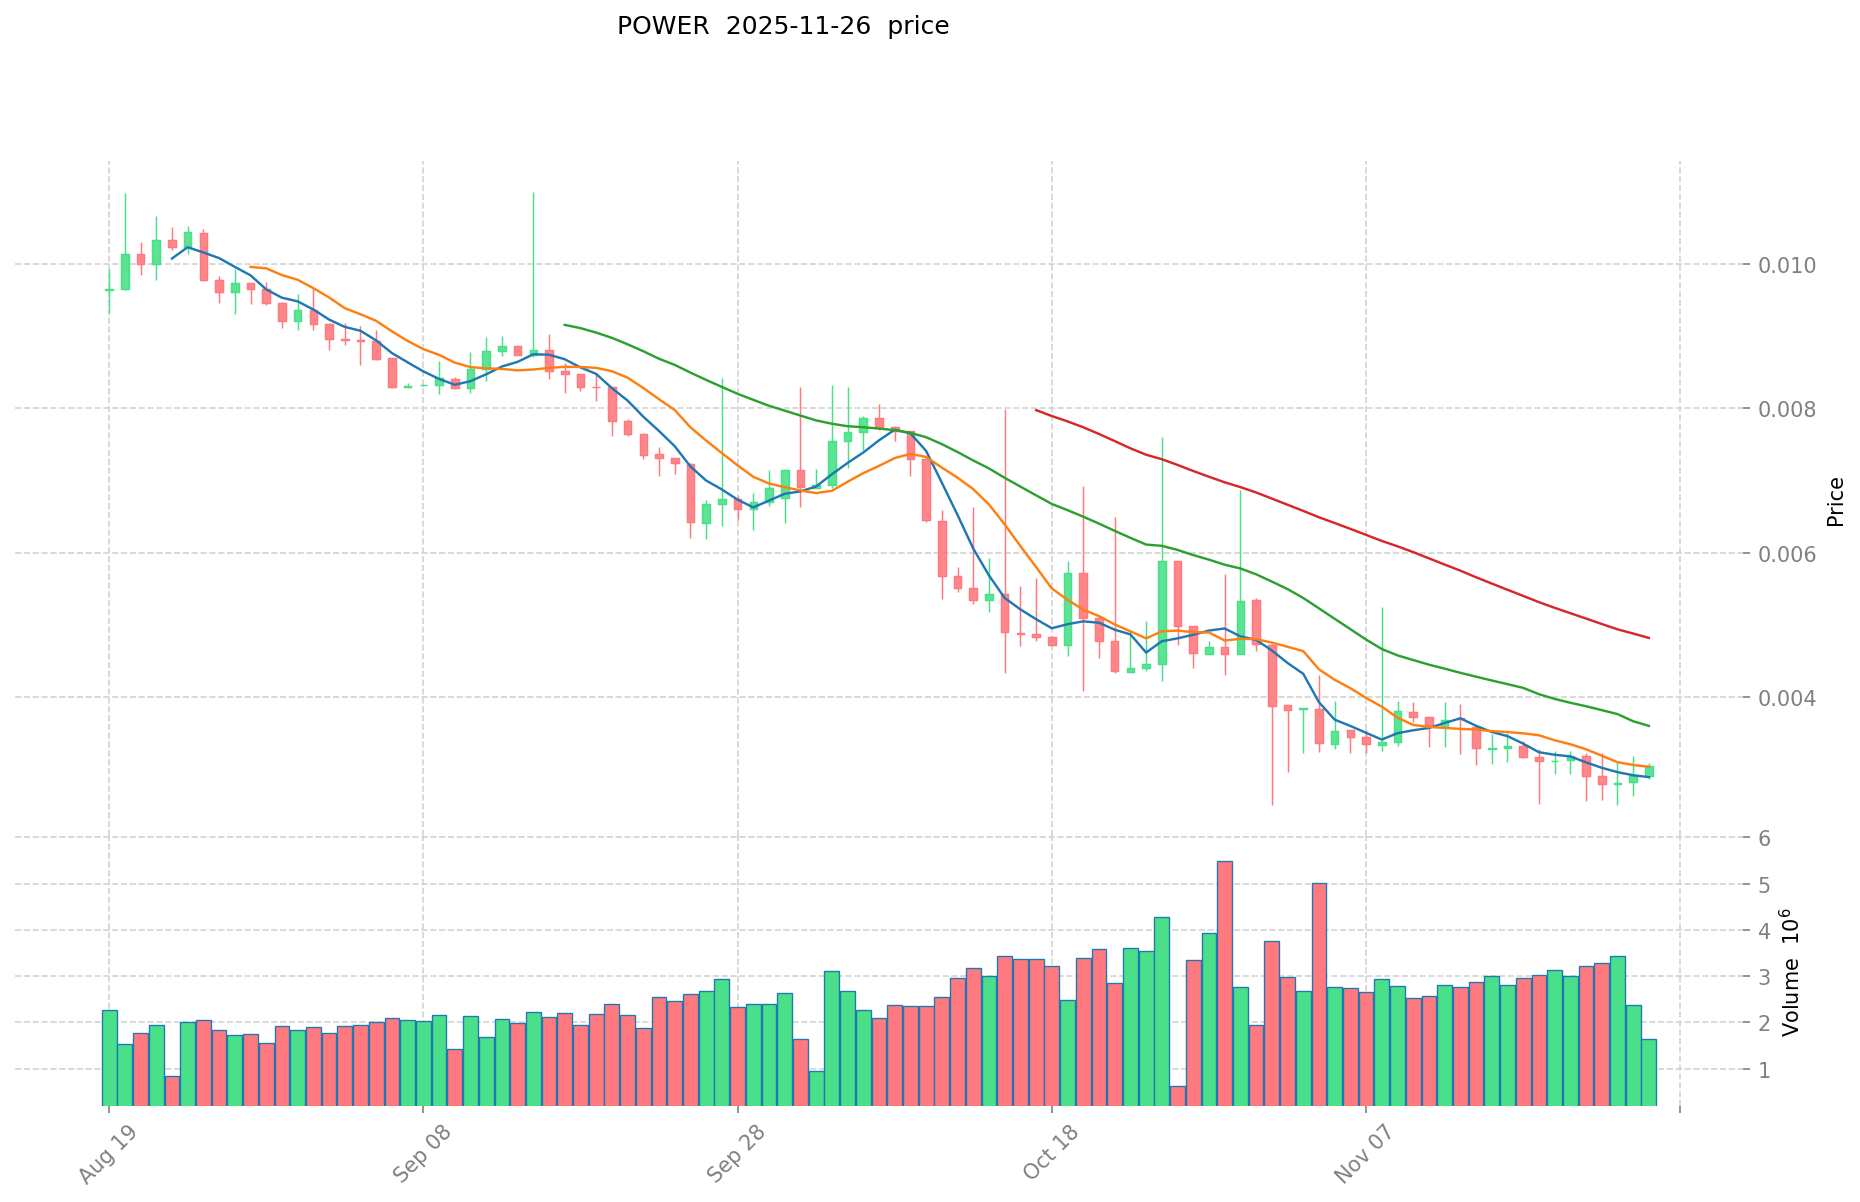
POWER Current Market Situation
As of November 27, 2025, POWER is trading at $0.003053. The token has seen a 0.72% increase in the last 24 hours, with a trading volume of $11,547.81. POWER's market capitalization stands at $528,508.21, ranking it at 3221 in the global cryptocurrency market.
The current price represents a substantial 99.15% decrease from its all-time high of $0.36, achieved on January 10, 2025. However, it's also 22.07% above its all-time low of $0.002501, recorded on November 1, 2025.
In terms of recent performance, POWER has shown mixed results across different timeframes. While it has seen slight gains of 0.33% in the past hour and 0.72% in the last 24 hours, it has experienced declines of 4.64% over the past week and a significant 33.47% drop in the last 30 days.
The token's circulating supply is 173,111,108 POWER, which represents 17.31% of its total supply of 1,000,000,000 tokens. This gives POWER a fully diluted market capitalization of $3,053,000.
Click to view the current POWER market price
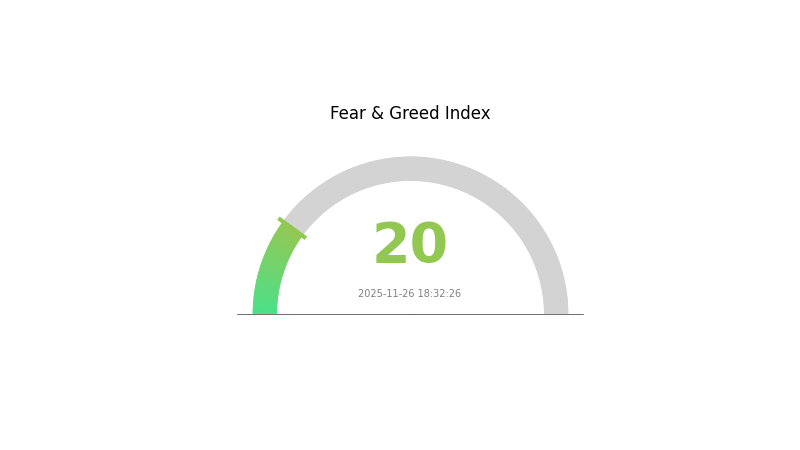
POWER Market Sentiment Indicator
2025-11-26 Fear and Greed Index: 20 (Extreme Fear)
Click to view the current Fear & Greed Index
The crypto market is experiencing extreme fear, with the sentiment index plummeting to 20. This level of pessimism often signals a potential buying opportunity for contrarian investors. However, it's crucial to approach with caution and conduct thorough research. While fear grips the market, savvy traders might consider dollar-cost averaging or exploring stable assets. Remember, market cycles are natural, and extreme sentiment can precede significant price movements. Stay informed and manage your risk wisely in these turbulent times.
POWER Holdings Distribution
The address holdings distribution data reveals a highly concentrated ownership structure for POWER tokens. The top five addresses collectively control 71.88% of the total supply, with the two largest holders each possessing over 20% of tokens. This level of concentration raises concerns about centralization and potential market manipulation.
Such a concentrated distribution can lead to increased price volatility and susceptibility to large-scale dumps. The dominance of a few major holders may also impact governance decisions if POWER implements on-chain voting mechanisms. However, it's worth noting that 28.12% of tokens are distributed among other addresses, which provides some level of broader market participation.
This concentration pattern suggests that POWER's current market structure lacks significant decentralization. While this may offer stability in terms of large holders potentially having long-term interests, it also introduces risks of price manipulation and reduced liquidity if major holders decide to sell substantial portions of their holdings.
Click to view the current POWER Holdings Distribution
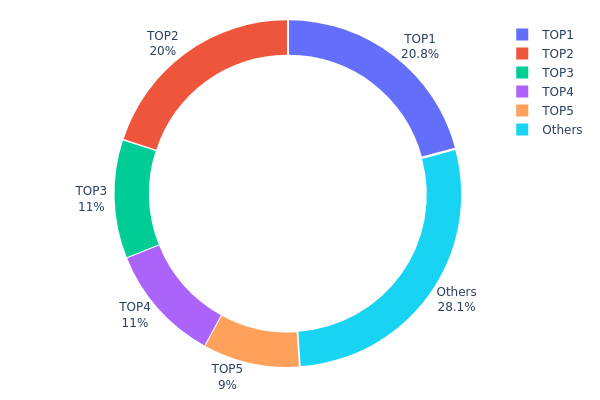
| Top | Address | Holding Qty | Holding (%) |
|---|---|---|---|
| 1 | 0x7b18...499107 | 208400.00K | 20.84% |
| 2 | 0x1fe3...44fd3f | 200000.00K | 20.00% |
| 3 | 0x1f77...ab07da | 110460.99K | 11.04% |
| 4 | 0x8d54...b63f6a | 110000.00K | 11.00% |
| 5 | 0x59f6...8a0549 | 90000.00K | 9.00% |
| - | Others | 281139.01K | 28.12% |
II. Core Factors Affecting POWER's Future Price
Macroeconomic Environment
- Inflation Hedging Properties: As a cryptocurrency, POWER may potentially serve as a hedge against inflation in certain economic conditions. However, its effectiveness as an inflation hedge would depend on various factors including market adoption and overall cryptocurrency market trends.
Technological Development and Ecosystem Building
- Ecosystem Applications: The POWER ecosystem likely includes various decentralized applications (DApps) and projects built on its blockchain. These applications could contribute to the network's utility and value proposition, potentially impacting the price of POWER tokens.
III. POWER Price Prediction for 2025-2030
2025 Outlook
- Conservative prediction: $0.00208 - $0.00306
- Neutral prediction: $0.00306 - $0.00369
- Optimistic prediction: $0.00369 - $0.00432 (requires favorable market conditions)
2026-2027 Outlook
- Market phase expectation: Gradual growth phase
- Price range forecast:
- 2026: $0.00299 - $0.00476
- 2027: $0.00283 - $0.00465
- Key catalysts: Increasing adoption and technological improvements
2028-2030 Long-term Outlook
- Base scenario: $0.00444 - $0.00577 (assuming steady market growth)
- Optimistic scenario: $0.00602 - $0.00739 (assuming strong market performance)
- Transformative scenario: $0.00739+ (assuming breakthrough developments in the POWER ecosystem)
- 2030-12-31: POWER $0.00739 (potential peak price)
| 年份 | 预测最高价 | 预测平均价格 | 预测最低价 | 涨跌幅 |
|---|---|---|---|---|
| 2025 | 0.00432 | 0.00306 | 0.00208 | 0 |
| 2026 | 0.00476 | 0.00369 | 0.00299 | 20 |
| 2027 | 0.00465 | 0.00423 | 0.00283 | 38 |
| 2028 | 0.00661 | 0.00444 | 0.00426 | 45 |
| 2029 | 0.00602 | 0.00552 | 0.00447 | 80 |
| 2030 | 0.00739 | 0.00577 | 0.00318 | 89 |
IV. POWER Professional Investment Strategies and Risk Management
POWER Investment Methodology
(1) Long-term Holding Strategy
- Suitable for: Patient investors with a high risk tolerance
- Operational suggestions:
- Accumulate POWER tokens during market dips
- Set price targets and stick to them
- Store tokens in a secure Gate Web3 wallet
(2) Active Trading Strategy
- Technical analysis tools:
- Moving Averages: Monitor short-term and long-term trends
- Relative Strength Index (RSI): Identify overbought/oversold conditions
- Key points for swing trading:
- Set stop-loss orders to limit potential losses
- Take profits at predetermined levels
POWER Risk Management Framework
(1) Asset Allocation Principles
- Conservative investors: 1-3% of crypto portfolio
- Aggressive investors: 5-10% of crypto portfolio
- Professional investors: Up to 15% of crypto portfolio
(2) Risk Hedging Solutions
- Diversification: Spread investments across multiple cryptocurrencies
- Stop-loss orders: Implement to limit potential losses
(3) Secure Storage Solutions
- Hot wallet recommendation: Gate Web3 wallet
- Cold storage option: Hardware wallet for long-term holdings
- Security precautions: Enable two-factor authentication, use strong passwords
V. Potential Risks and Challenges for POWER
POWER Market Risks
- High volatility: POWER's price may experience significant fluctuations
- Low liquidity: Limited trading volume may impact price stability
- Market sentiment: Susceptible to broader crypto market trends
POWER Regulatory Risks
- Uncertain regulations: Potential for new laws affecting token utility
- Compliance challenges: Adapting to evolving regulatory requirements
- Cross-border restrictions: Possible limitations on international use
POWER Technical Risks
- Smart contract vulnerabilities: Potential for exploits or bugs
- Network congestion: Ethereum-based token may face scalability issues
- Technological obsolescence: Risk of being outpaced by newer solutions
VI. Conclusion and Action Recommendations
POWER Investment Value Assessment
POWER offers potential as part of a data-centric Web3 ecosystem, but faces significant short-term volatility and adoption challenges. Long-term value depends on Powerloom's ability to deliver on its vision of reliable onchain insights.
POWER Investment Recommendations
✅ Beginners: Consider small, experimental positions with thorough research ✅ Experienced investors: Implement dollar-cost averaging strategy with strict risk management ✅ Institutional investors: Conduct in-depth due diligence and consider as part of a diversified crypto portfolio
POWER Trading Participation Methods
- Spot trading: Purchase POWER tokens on Gate.com
- Limit orders: Set buy and sell orders at specific price points
- DCA strategy: Regularly invest small amounts to average out price volatility
Cryptocurrency investments carry extremely high risk. This article does not constitute investment advice. Investors should make decisions based on their own risk tolerance and are advised to consult professional financial advisors. Never invest more than you can afford to lose.
FAQ
Is power price going up?
Based on market trends and increasing adoption, POWER price is likely to see an upward trajectory in the coming months.
Are energy prices dropping in 2025?
Yes, energy prices are expected to drop in 2025 due to increased renewable energy adoption and improved energy efficiency technologies.
Will Texas electricity rates go down in 2025?
Based on current trends, Texas electricity rates are likely to decrease slightly in 2025 due to increased renewable energy capacity and improved grid efficiency.
Will electricity rates go up in 2026?
Yes, electricity rates are likely to increase in 2026 due to rising energy costs and infrastructure investments.
Share
Content
Introduction: POWER's Market Position and Investment Value
I. POWER Price History Review and Current Market Status
II. Core Factors Affecting POWER's Future Price
III. POWER Price Prediction for 2025-2030
IV. POWER Professional Investment Strategies and Risk Management
V. Potential Risks and Challenges for POWER
VI. Conclusion and Action Recommendations
FAQ

