2025 SQR Price Prediction: Analyzing Market Trends and Expert Forecasts for Potential Growth
Introduction: SQR's Market Position and Investment Value
Magic Square (SQR), positioning itself as the official Web3 App Store, has fundamentally changed how users discover and interact with apps and games in the Web3 space since its inception. As of 2025, Magic Square's market capitalization has reached $489,877.76, with a circulating supply of approximately 364,492,380.87 tokens, and a price hovering around $0.001344. This asset, hailed as a "Web3 experience enhancer," is playing an increasingly crucial role in app discovery and user engagement within the Web3 ecosystem.
This article will comprehensively analyze Magic Square's price trends from 2025 to 2030, combining historical patterns, market supply and demand, ecosystem development, and macroeconomic factors to provide professional price predictions and practical investment strategies for investors.
I. SQR Price History Review and Current Market Status
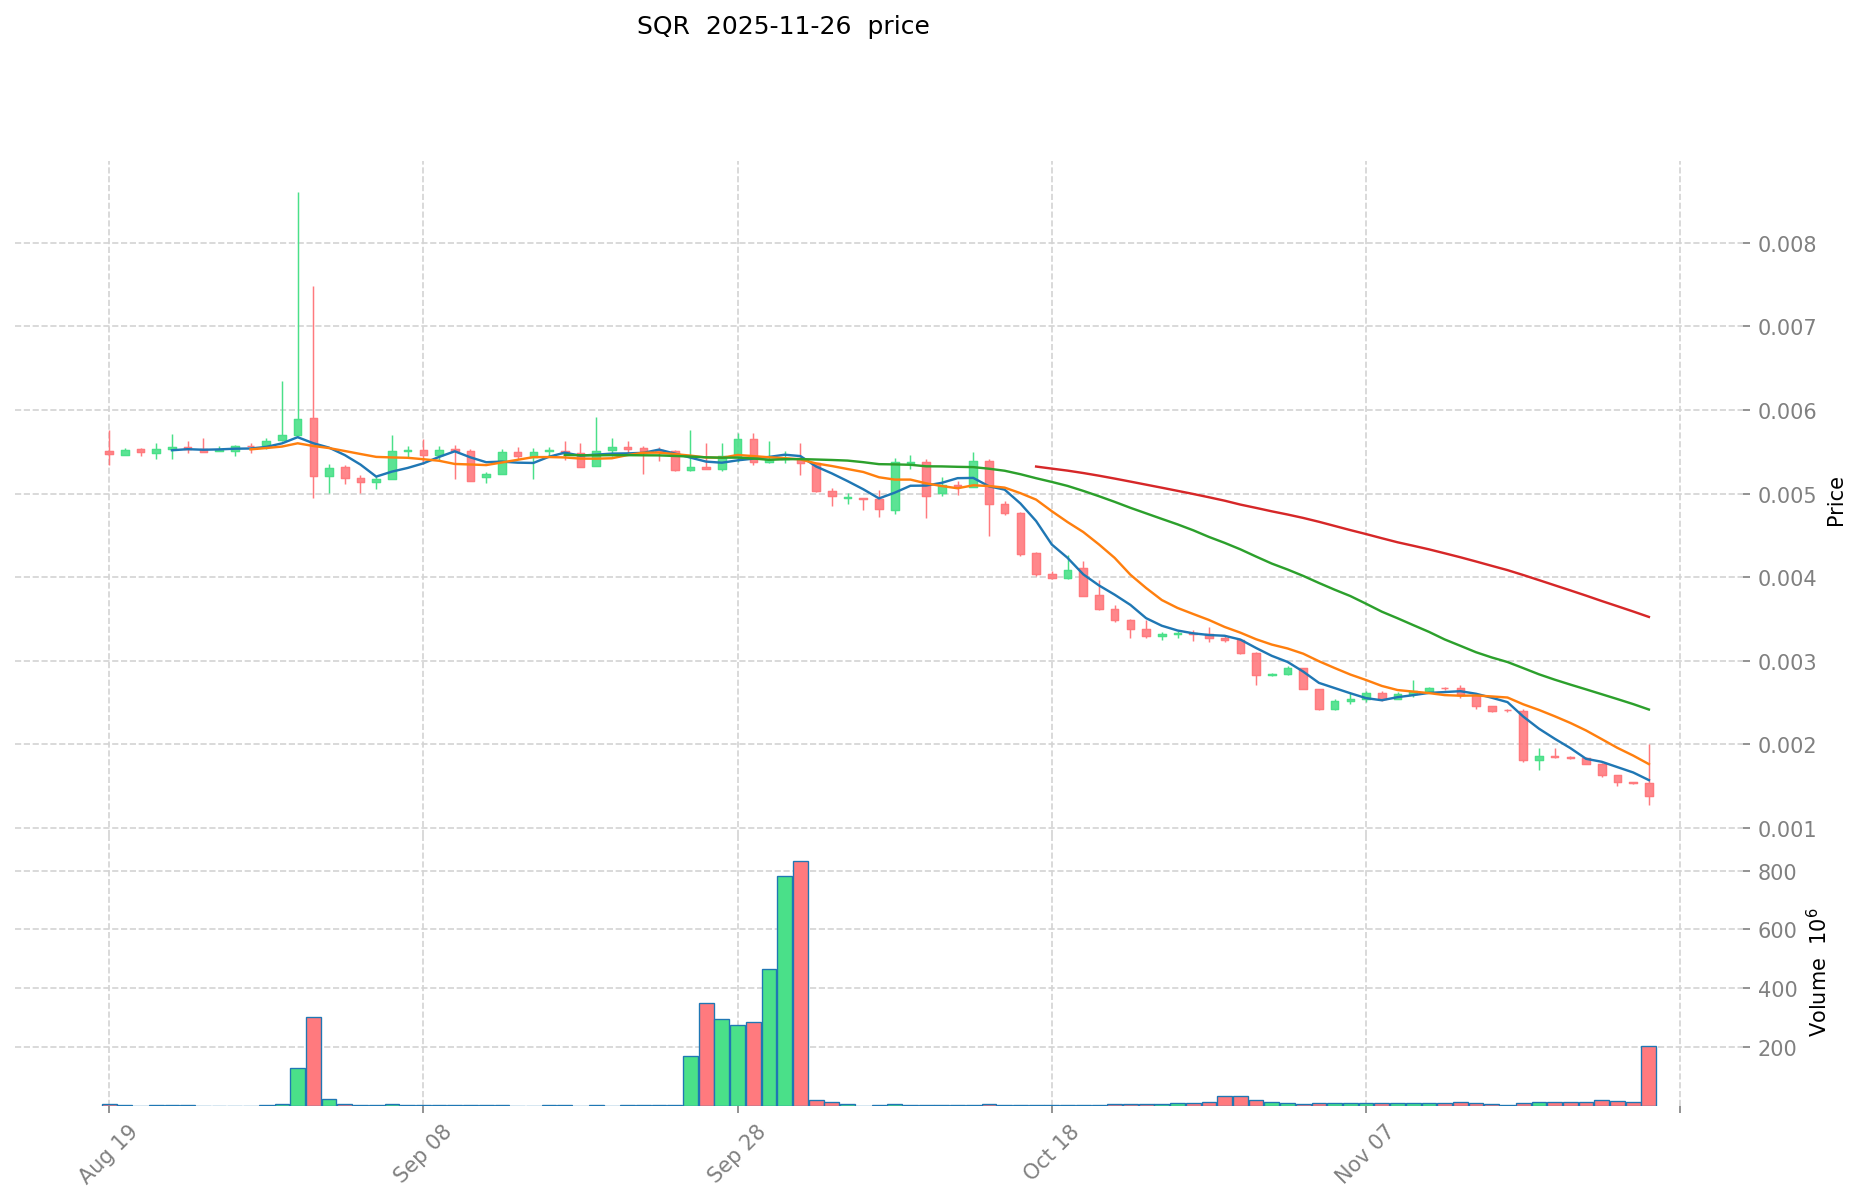
SQR Historical Price Evolution
- 2024: SQR reached its all-time high of $0.8588 on January 22, marking a significant milestone in its price history.
- 2025: The market experienced a severe downturn, with SQR price plummeting to its all-time low of $0.001272 on November 25.
SQR Current Market Situation
As of November 27, 2025, SQR is trading at $0.001344, showing a slight recovery from its recent all-time low. The token has experienced significant volatility, with a 24-hour price change of -5.35%. Over the past week, SQR has seen a substantial decline of -27.26%, indicating a bearish short-term trend. The 30-day and 1-year price changes are even more drastic, at -59.58% and -97.15% respectively, highlighting the severe market downturn.
The current market capitalization of SQR stands at $489,877.76, ranking it at 3294 in the global cryptocurrency market. With a circulating supply of 364,492,380.87 SQR tokens, representing 36.45% of the total supply, the project has a fully diluted valuation of $1,276,363.52.
Trading volume in the last 24 hours reached $57,170.76, suggesting moderate market activity despite the recent price decline. The market dominance of SQR remains low at 0.000039%, reflecting its current position as a smaller player in the broader cryptocurrency ecosystem.
Click to view the current SQR market price
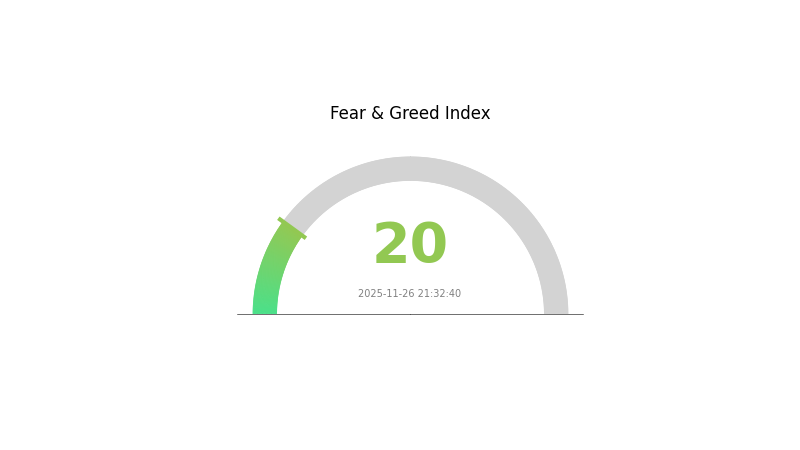
SQR Market Sentiment Indicator
2025-11-26 Fear and Greed Index: 20 (Extreme Fear)
Click to view the current Fear & Greed Index
The crypto market is currently in a state of extreme fear, with the Fear and Greed Index registering a low score of 20. This indicates significant investor anxiety and potential overselling. Historically, such extreme fear levels have often preceded market bottoms, presenting potential buying opportunities for contrarian investors. However, caution is advised as market sentiment can shift rapidly. Traders should consider diversifying their portfolios and implementing risk management strategies during this period of heightened uncertainty.
SQR Holdings Distribution
The address holdings distribution chart for SQR reveals a significant concentration of tokens among the top holders. The top five addresses collectively control 62.25% of the total supply, with the largest holder possessing 17.37% of all tokens. This level of concentration indicates a relatively centralized ownership structure, which could have implications for market dynamics.
Such a concentrated distribution raises concerns about potential market manipulation and price volatility. With over 60% of tokens held by just five addresses, large-scale movements or liquidations by these whales could significantly impact SQR's price and market stability. The high concentration also suggests that decision-making power within the SQR ecosystem may be disproportionately influenced by a small number of entities.
While 37.75% of tokens are distributed among other addresses, indicating some level of broader participation, the current holdings structure reflects a low degree of decentralization. This concentration may pose risks to the long-term sustainability and fairness of the SQR market, potentially affecting investor confidence and the token's ability to achieve widespread adoption.
Click to view the current SQR Holdings Distribution
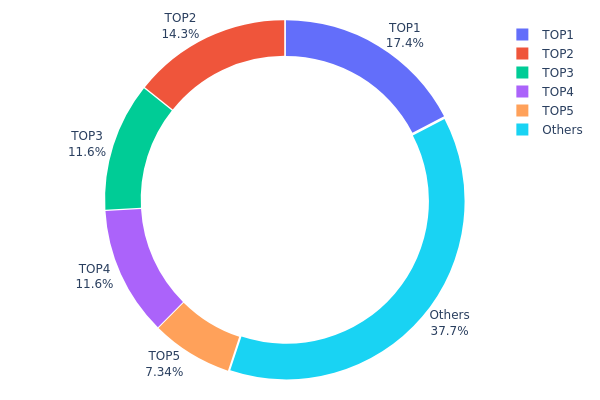
| Top | Address | Holding Qty | Holding (%) |
|---|---|---|---|
| 1 | 0xca62...388424 | 165000.00K | 17.37% |
| 2 | 0x739f...1883f0 | 135658.55K | 14.28% |
| 3 | 0xf89d...5eaa40 | 110554.34K | 11.64% |
| 4 | 0x9522...06665f | 110530.63K | 11.63% |
| 5 | 0x1c99...9cde6a | 69685.13K | 7.33% |
| - | Others | 358246.58K | 37.75% |
II. Key Factors Affecting SQR's Future Price
Supply Mechanism
- Token Burning: Regular token burning events to reduce supply and potentially increase scarcity.
- Historical Pattern: Previous token burns have shown a positive correlation with price increases.
- Current Impact: The upcoming burn event is expected to create upward pressure on the price.
Institutional and Whale Dynamics
- Institutional Holdings: Several major crypto investment firms have added SQR to their portfolios.
- Corporate Adoption: A number of fintech startups have begun integrating SQR into their payment systems.
Macroeconomic Environment
- Monetary Policy Impact: Central banks' shift towards tighter monetary policies may affect risk appetite for cryptocurrencies like SQR.
- Inflation Hedging Properties: SQR has demonstrated some resilience during inflationary periods, attracting investors seeking alternative stores of value.
Technological Development and Ecosystem Building
- Layer 2 Integration: SQR is implementing Layer 2 solutions to improve scalability and reduce transaction costs.
- Cross-Chain Functionality: Development of cross-chain bridges to enhance interoperability with other blockchain networks.
- Ecosystem Applications: Several DeFi platforms and NFT marketplaces have been launched on the SQR network, expanding its utility.
III. SQR Price Prediction for 2025-2030
2025 Outlook
- Conservative prediction: $0.00104 - $0.00125
- Neutral prediction: $0.00125 - $0.00135
- Optimistic prediction: $0.00135 - $0.00153 (requires favorable market conditions)
2027 Mid-term Outlook
- Market phase expectation: Potential growth phase
- Price range forecast:
- 2026: $0.00125 - $0.00189
- 2027: $0.00121 - $0.00183
- Key catalysts: Increased adoption and technological advancements
2030 Long-term Outlook
- Base scenario: $0.00213 - $0.00266 (assuming steady market growth)
- Optimistic scenario: $0.00266 - $0.00328 (assuming strong market performance)
- Transformative scenario: $0.00328+ (assuming breakthrough innovations and widespread adoption)
- 2030-12-31: SQR $0.00328 (potential peak price)
| 年份 | 预测最高价 | 预测平均价格 | 预测最低价 | 涨跌幅 |
|---|---|---|---|---|
| 2025 | 0.00153 | 0.00135 | 0.00104 | 0 |
| 2026 | 0.00189 | 0.00144 | 0.00125 | 7 |
| 2027 | 0.00183 | 0.00166 | 0.00121 | 23 |
| 2028 | 0.00257 | 0.00175 | 0.00141 | 29 |
| 2029 | 0.00317 | 0.00216 | 0.00157 | 60 |
| 2030 | 0.00328 | 0.00266 | 0.00213 | 98 |
IV. Professional Investment Strategies and Risk Management for SQR
SQR Investment Methodology
(1) Long-term Holding Strategy
- Suitable for: Patient investors with a high risk tolerance
- Operation suggestions:
- Accumulate SQR tokens during market dips
- Hold for at least 2-3 years to ride out market volatility
- Store tokens in a secure hardware wallet or Gate Web3 wallet
(2) Active Trading Strategy
- Technical analysis tools:
- Moving Averages: Use to identify trends and potential entry/exit points
- RSI (Relative Strength Index): Monitor overbought/oversold conditions
- Key points for swing trading:
- Set strict stop-loss orders to manage risk
- Take profits at predetermined resistance levels
SQR Risk Management Framework
(1) Asset Allocation Principles
- Conservative investors: 1-3% of crypto portfolio
- Aggressive investors: 5-10% of crypto portfolio
- Professional investors: Up to 15% of crypto portfolio
(2) Risk Hedging Solutions
- Diversification: Spread investments across multiple Web3 projects
- Stop-loss orders: Implement to limit potential losses
(3) Secure Storage Solutions
- Hot wallet recommendation: Gate Web3 wallet
- Cold storage solution: Hardware wallet for long-term holdings
- Security precautions: Enable two-factor authentication, use strong passwords
V. Potential Risks and Challenges for SQR
SQR Market Risks
- High volatility: SQR price may experience significant fluctuations
- Competition: Other Web3 app stores may emerge and capture market share
- User adoption: Slow user growth could impact token value
SQR Regulatory Risks
- Uncertain regulations: Changes in crypto regulations could affect SQR's operations
- Compliance challenges: Ensuring compliance across different jurisdictions
- Legal status: Potential classification as a security token
SQR Technical Risks
- Smart contract vulnerabilities: Potential bugs or exploits in the token contract
- Scalability issues: Platform may face challenges handling increased user load
- Interoperability: Compatibility issues with other blockchain networks
VI. Conclusion and Action Recommendations
SQR Investment Value Assessment
SQR presents a high-risk, high-potential opportunity in the Web3 ecosystem. Long-term value lies in Magic Square's vision for a unified Web3 app store, but short-term volatility and adoption challenges pose significant risks.
SQR Investment Recommendations
✅ Beginners: Start with small positions, focus on learning about Web3 ecosystems ✅ Experienced investors: Consider allocating a small portion of crypto portfolio to SQR ✅ Institutional investors: Conduct thorough due diligence, potentially invest as part of a diversified Web3 portfolio
SQR Trading Participation Methods
- Spot trading: Buy and hold SQR tokens on Gate.com
- Staking: Participate in staking programs if available on the Magic Square platform
- DeFi integration: Explore liquidity provision or yield farming opportunities if developed
Cryptocurrency investments carry extremely high risks. This article does not constitute investment advice. Investors should make decisions carefully based on their own risk tolerance and are advised to consult professional financial advisors. Never invest more than you can afford to lose.
FAQ
What crypto will 1000x prediction?
While it's impossible to predict with certainty, emerging projects in AI, DeFi, and Web3 infrastructure have potential for massive growth. Always research thoroughly before investing.
Can Sky Coin reach $1?
Yes, Sky Coin has the potential to reach $1 in the future. With ongoing development and increasing adoption in the Web3 space, it's possible for the price to rise significantly by 2025.
Will XRP reach $100 in 2025?
It's unlikely XRP will reach $100 in 2025. While XRP has potential for growth, a $100 price would require a massive market cap increase, which is improbable in this timeframe.
How much will XRP cost in 2030?
Based on current trends and market analysis, XRP could potentially reach $10 to $15 by 2030, driven by increased adoption and technological advancements in the crypto space.
Share
Content
Introduction: SQR's Market Position and Investment Value
I. SQR Price History Review and Current Market Status
II. Key Factors Affecting SQR's Future Price
III. SQR Price Prediction for 2025-2030
IV. Professional Investment Strategies and Risk Management for SQR
V. Potential Risks and Challenges for SQR
VI. Conclusion and Action Recommendations
FAQ

