AINN vs LINK: The Battle for AI Supremacy in Blockchain Networks
Introduction: Investment Comparison between AINN and LINK
In the cryptocurrency market, the comparison between AINN vs LINK has always been a topic that investors cannot avoid. The two not only have significant differences in market cap ranking, application scenarios, and price performance, but also represent different crypto asset positioning.
AINN (AINN): Since its launch in 2023, it has gained market recognition for its positioning in the integration of Web3 and AI.
ChainLink (LINK): Since its inception in 2017, it has been hailed as a decentralized oracle network, and is one of the cryptocurrencies with the highest global trading volume and market capitalization.
This article will comprehensively analyze the investment value comparison between AINN vs LINK, focusing on historical price trends, supply mechanisms, institutional adoption, technological ecosystems, and future predictions, and attempt to answer the question that investors care about most:
"Which is the better buy right now?"
I. Price History Comparison and Current Market Status
AINN and LINK Historical Price Trends
- 2023: AINN was deployed in May as a leaderless inscription on the BRC20 protocol, representing a strong consensus on the combination of web3 and AI.
- 2021: LINK reached its all-time high of $52.7 on May 10, driven by increased adoption of its oracle services.
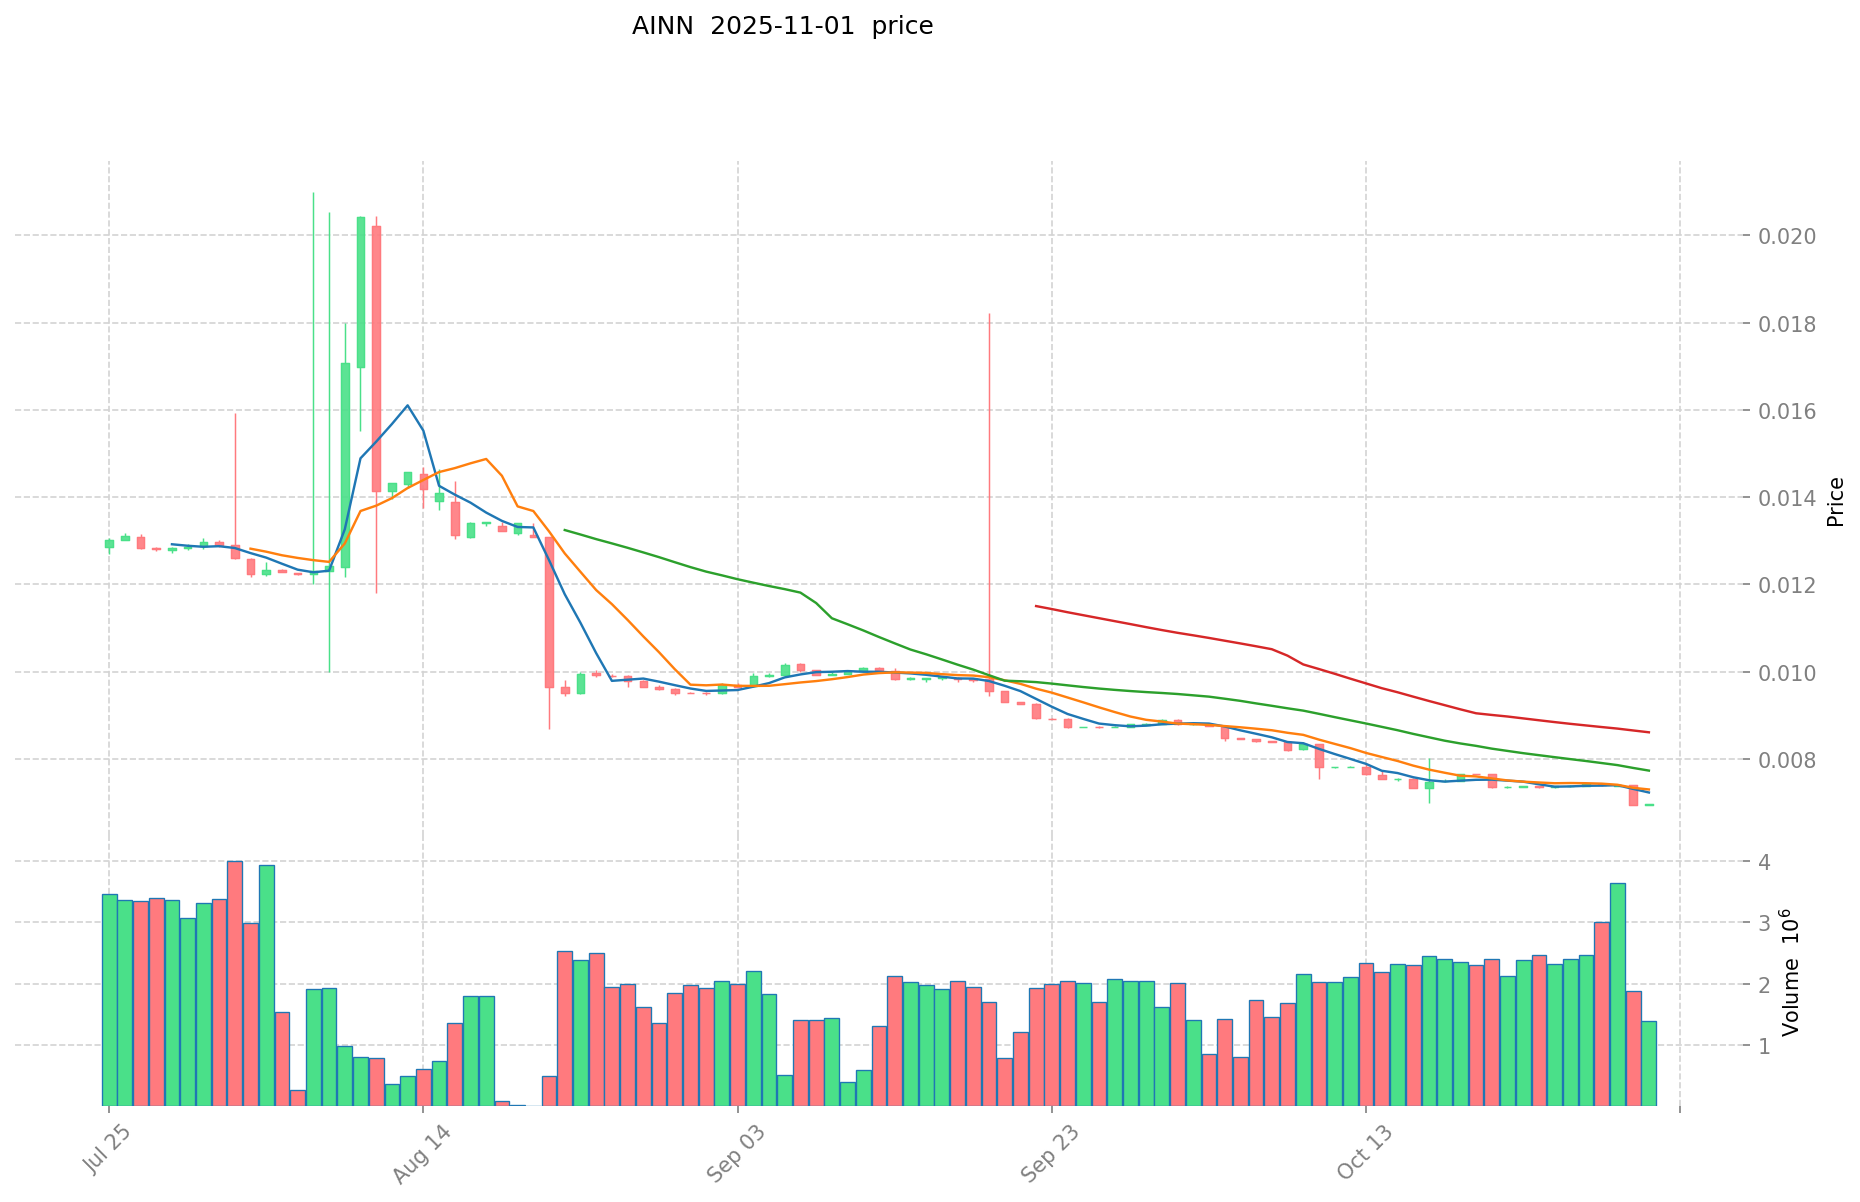
- Comparative analysis: In the current market cycle, AINN has dropped from its all-time high of $2.96 to a low of $0.006936, while LINK has shown more stability, currently trading at $17.199.
Current Market Situation (2025-11-01)
- AINN current price: $0.006976
- LINK current price: $17.199
- 24-hour trading volume: AINN $9,910.96 vs LINK $4,041,193.79
- Market Sentiment Index (Fear & Greed Index): 33 (Fear)
Click to view real-time prices:
- View AINN current price Market Price
- View LINK current price Market Price

II. Core Factors Affecting AINN vs LINK Investment Value
Market Competition and Macroeconomic Factors
- AINN: Valuation heavily influenced by competitive positioning in the AI sector and market share
- LINK: Price performance driven by whale accumulation patterns with recent large holders adding 2.5 million tokens worth over $61 million
- 📌 Historical Pattern: Market sentiment and broader economic conditions affect both assets' price movements
Institutional Adoption and Market Applications
- Institutional Holdings: Large addresses holding 100,000-1,000,000 LINK tokens show increased accumulation, signaling long-term institutional confidence
- Enterprise Adoption: AINN positioning focuses on combining investment with charitable initiatives, while LINK serves as oracle infrastructure
- Regulatory Environment: Both assets subject to evolving regulatory frameworks across jurisdictions
Technical Development and Ecosystem Building
- AINN Technical Focus: Positioned as a core platform promoting social responsibility through technology
- LINK Chain Activity: On-chain metrics serve as key indicators of network health and adoption
- Ecosystem Comparison: LINK benefits from established oracle network integration across DeFi applications
Macroeconomic Environment and Market Cycles
- Inflation Performance: Both assets influenced by broader market reactions to inflation data
- Monetary Policy Impact: Interest rates, inflation rates, and economic growth directly affect investor appetite for both tokens
- Investor Psychology: Clear investment direction helps avoid being swayed by short-term volatility and market noise
III. 2025-2030 Price Prediction: AINN vs LINK
Short-term Prediction (2025)
- AINN: Conservative $0.00507642 - $0.006954 | Optimistic $0.006954 - $0.00757986
- LINK: Conservative $11.3487 - $17.195 | Optimistic $17.195 - $24.7608
Mid-term Prediction (2027)
- AINN may enter a growth phase, with prices expected in the range of $0.007098337224 - $0.009195573222
- LINK may enter a bullish market, with prices expected in the range of $21.57577015 - $37.56722332
- Key drivers: Institutional capital inflow, ETF, ecosystem development
Long-term Prediction (2030)
- AINN: Base scenario $0.01211631918321 - $0.016478194089166 | Optimistic scenario $0.016478194089166+
- LINK: Base scenario $35.27565620338188 - $37.930813121916 | Optimistic scenario $37.930813121916 - $42.10320256532676
Disclaimer: This analysis is based on historical data and current market trends. Cryptocurrency markets are highly volatile and unpredictable. These predictions should not be considered as financial advice. Always conduct your own research before making any investment decisions.
AINN:
| 年份 | 预测最高价 | 预测平均价格 | 预测最低价 | 涨跌幅 |
|---|---|---|---|---|
| 2025 | 0.00757986 | 0.006954 | 0.00507642 | 0 |
| 2026 | 0.0088656546 | 0.00726693 | 0.0055955361 | 4 |
| 2027 | 0.009195573222 | 0.0080662923 | 0.007098337224 | 15 |
| 2028 | 0.01216961519301 | 0.008630932761 | 0.00655950889836 | 23 |
| 2029 | 0.013832364389416 | 0.010400273977005 | 0.007904208222523 | 49 |
| 2030 | 0.016478194089166 | 0.01211631918321 | 0.009450728962904 | 73 |
LINK:
| 年份 | 预测最高价 | 预测平均价格 | 预测最低价 | 涨跌幅 |
|---|---|---|---|---|
| 2025 | 24.7608 | 17.195 | 11.3487 | 0 |
| 2026 | 29.788618 | 20.9779 | 17.831215 | 21 |
| 2027 | 37.56722332 | 25.383259 | 21.57577015 | 47 |
| 2028 | 33.3637556296 | 31.47524116 | 27.3834598092 | 83 |
| 2029 | 43.442127849032 | 32.4194983948 | 20.424283988724 | 88 |
| 2030 | 42.10320256532676 | 37.930813121916 | 35.27565620338188 | 120 |
IV. Investment Strategy Comparison: AINN vs LINK
Long-term vs Short-term Investment Strategy
- AINN: Suitable for investors focused on AI integration and social responsibility initiatives
- LINK: Suitable for investors seeking established infrastructure and oracle network adoption
Risk Management and Asset Allocation
- Conservative investors: AINN: 20% vs LINK: 80%
- Aggressive investors: AINN: 40% vs LINK: 60%
- Hedging tools: Stablecoin allocation, options, cross-currency combinations
V. Potential Risk Comparison
Market Risk
- AINN: High volatility due to newer market positioning and lower liquidity
- LINK: Exposure to broader DeFi market fluctuations and oracle demand
Technical Risk
- AINN: Scalability, network stability
- LINK: Oracle reliability, potential smart contract vulnerabilities
Regulatory Risk
- Global regulatory policies may impact both assets differently, with LINK potentially facing more scrutiny due to its wider adoption
VI. Conclusion: Which Is the Better Buy?
📌 Investment Value Summary:
- AINN advantages: Potential growth in AI and Web3 integration, social responsibility focus
- LINK advantages: Established oracle network, strong institutional adoption, critical DeFi infrastructure
✅ Investment Advice:
- New investors: Consider a smaller allocation to AINN for potential growth, larger allocation to LINK for stability
- Experienced investors: Balanced portfolio with both assets, adjusting based on risk tolerance
- Institutional investors: Focus on LINK for its established market position and infrastructure role
⚠️ Risk Warning: Cryptocurrency markets are highly volatile. This article does not constitute investment advice. None
VII. FAQ
Q1: What are the main differences between AINN and LINK? A: AINN is a newer cryptocurrency focused on integrating Web3 and AI, launched in 2023. LINK, launched in 2017, is an established decentralized oracle network. AINN has a smaller market cap and higher volatility, while LINK has wider adoption and serves as critical DeFi infrastructure.
Q2: Which cryptocurrency has shown better price performance recently? A: LINK has shown more stability in recent market conditions. As of November 1, 2025, LINK is trading at $17.199, while AINN is at $0.006976. LINK has also maintained a higher trading volume and market capitalization.
Q3: What factors are driving the growth of AINN and LINK? A: AINN's growth is driven by its positioning in AI and Web3 integration, as well as its focus on social responsibility. LINK's growth is fueled by increased adoption of its oracle services, institutional investment, and its critical role in the DeFi ecosystem.
Q4: How do the long-term price predictions for AINN and LINK compare? A: By 2030, AINN is predicted to reach between $0.01211631918321 and $0.016478194089166 in the base scenario. LINK is expected to reach between $35.27565620338188 and $37.930813121916 in the same timeframe. LINK is projected to have a higher percentage increase from current prices.
Q5: What are the main risks associated with investing in AINN and LINK? A: Both cryptocurrencies face market risks due to volatility. AINN has higher technical risks due to its newer status and potential scalability issues. LINK faces risks related to oracle reliability and smart contract vulnerabilities. Both are subject to evolving regulatory risks, with LINK potentially facing more scrutiny due to its wider adoption.
Q6: How should investors allocate their portfolio between AINN and LINK? A: Conservative investors might consider allocating 20% to AINN and 80% to LINK. More aggressive investors could opt for a 40% AINN and 60% LINK split. The exact allocation should be based on individual risk tolerance and investment goals.
Q7: Which cryptocurrency is better suited for long-term investment? A: LINK may be better suited for long-term investment due to its established position, wider adoption, and critical role in the DeFi ecosystem. However, AINN offers potential for higher growth due to its focus on emerging technologies. A balanced approach considering both assets may be prudent for long-term investors.
Share
Content
Introduction: Investment Comparison between AINN and LINK
I. Price History Comparison and Current Market Status
II. Core Factors Affecting AINN vs LINK Investment Value
III. 2025-2030 Price Prediction: AINN vs LINK
IV. Investment Strategy Comparison: AINN vs LINK
V. Potential Risk Comparison
VI. Conclusion: Which Is the Better Buy?
VII. FAQ

