BOOP vs APT: The Battle of Cybersecurity Strategies in the Digital Age
Introduction: BOOP vs APT Investment Comparison
In the cryptocurrency market, the comparison between BOOP and APT has been an unavoidable topic for investors. The two not only show significant differences in market cap ranking, application scenarios, and price performance but also represent different cryptocurrency asset positions.
BOOP (BOOP): Since its launch, it has gained market recognition for rewarding meme makers and adventurers in the Solana ecosystem.
Aptos (APT): Since its inception in 2022, it has been hailed as a high-performance PoS Layer 1 project, focusing on delivering a secure and scalable Layer 1 blockchain.
This article will comprehensively analyze the investment value comparison between BOOP and APT, focusing on historical price trends, supply mechanisms, institutional adoption, technological ecosystems, and future predictions, attempting to answer the question investors care about most:
"Which is the better buy right now?"
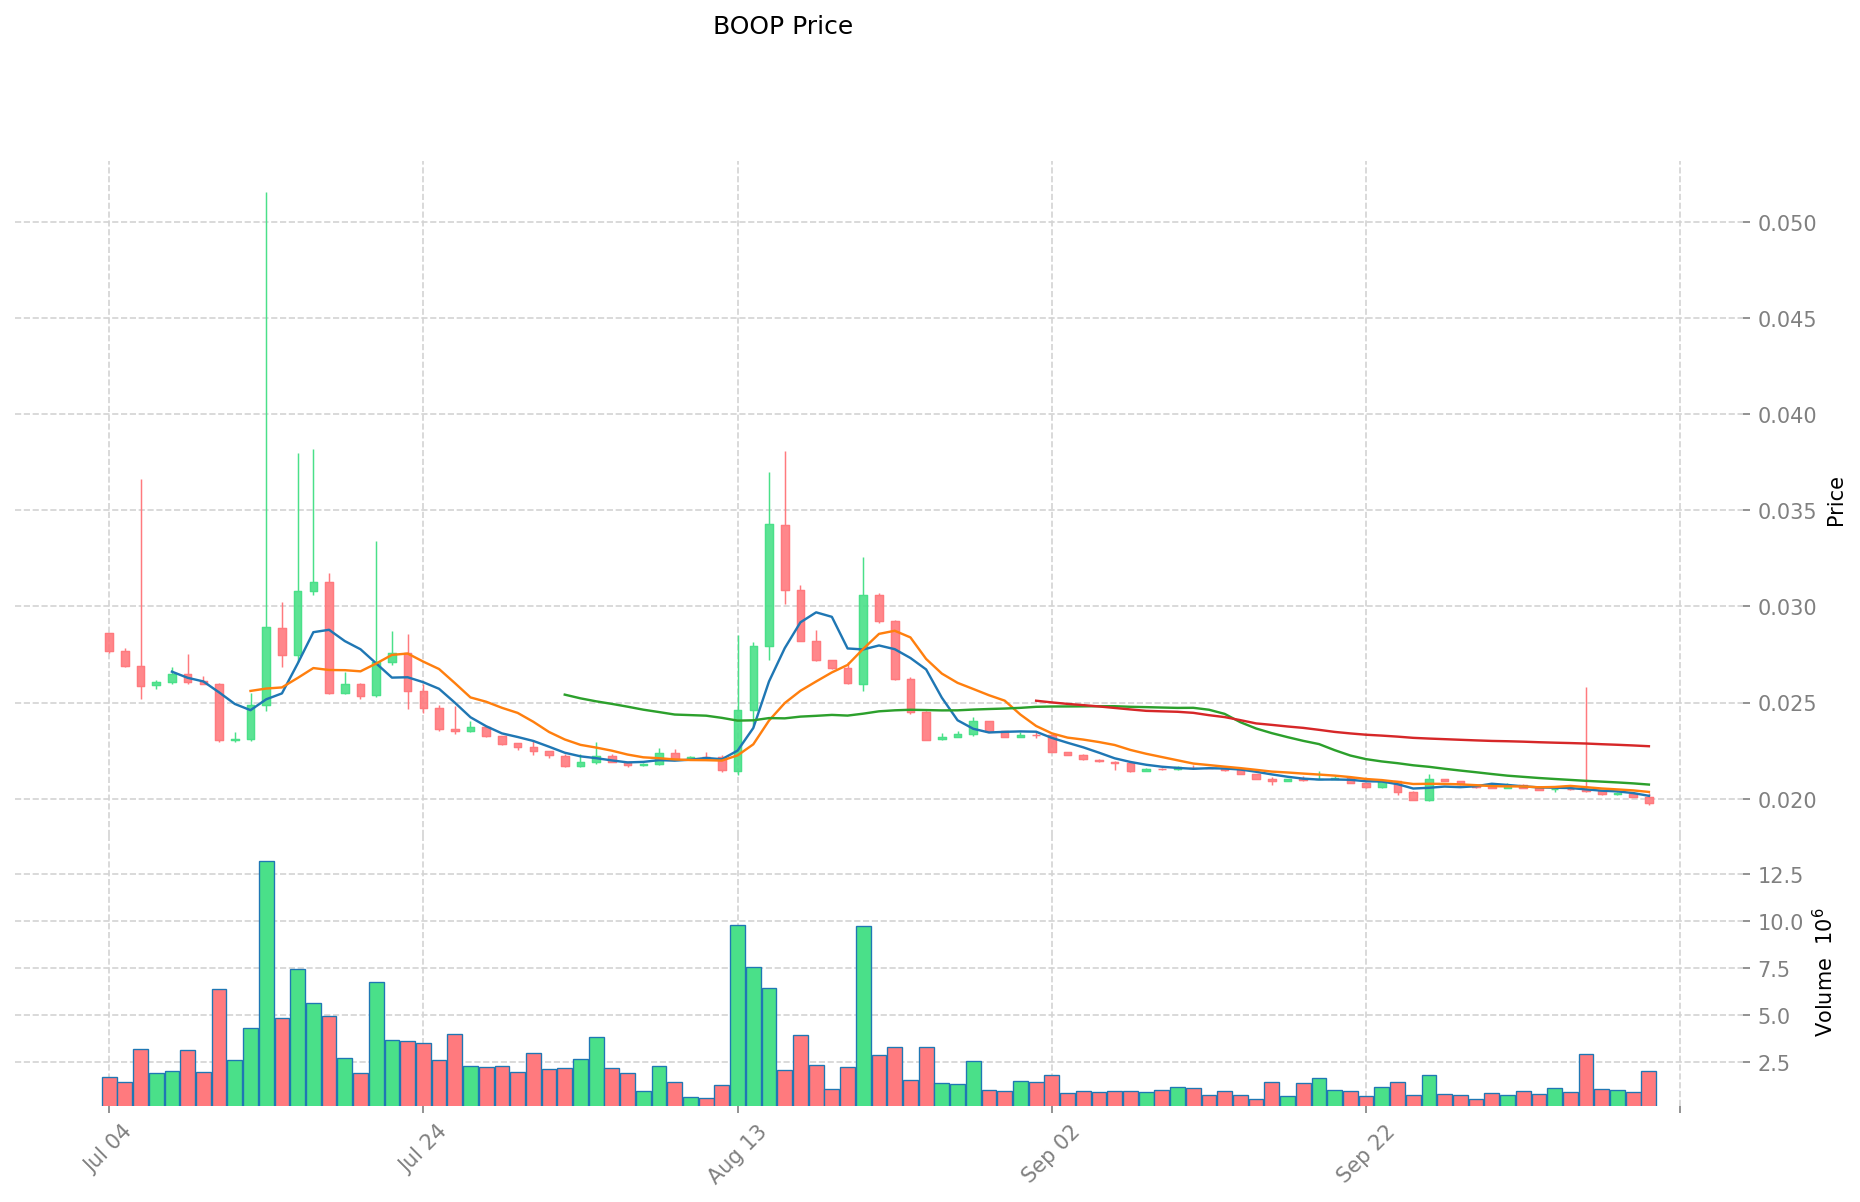
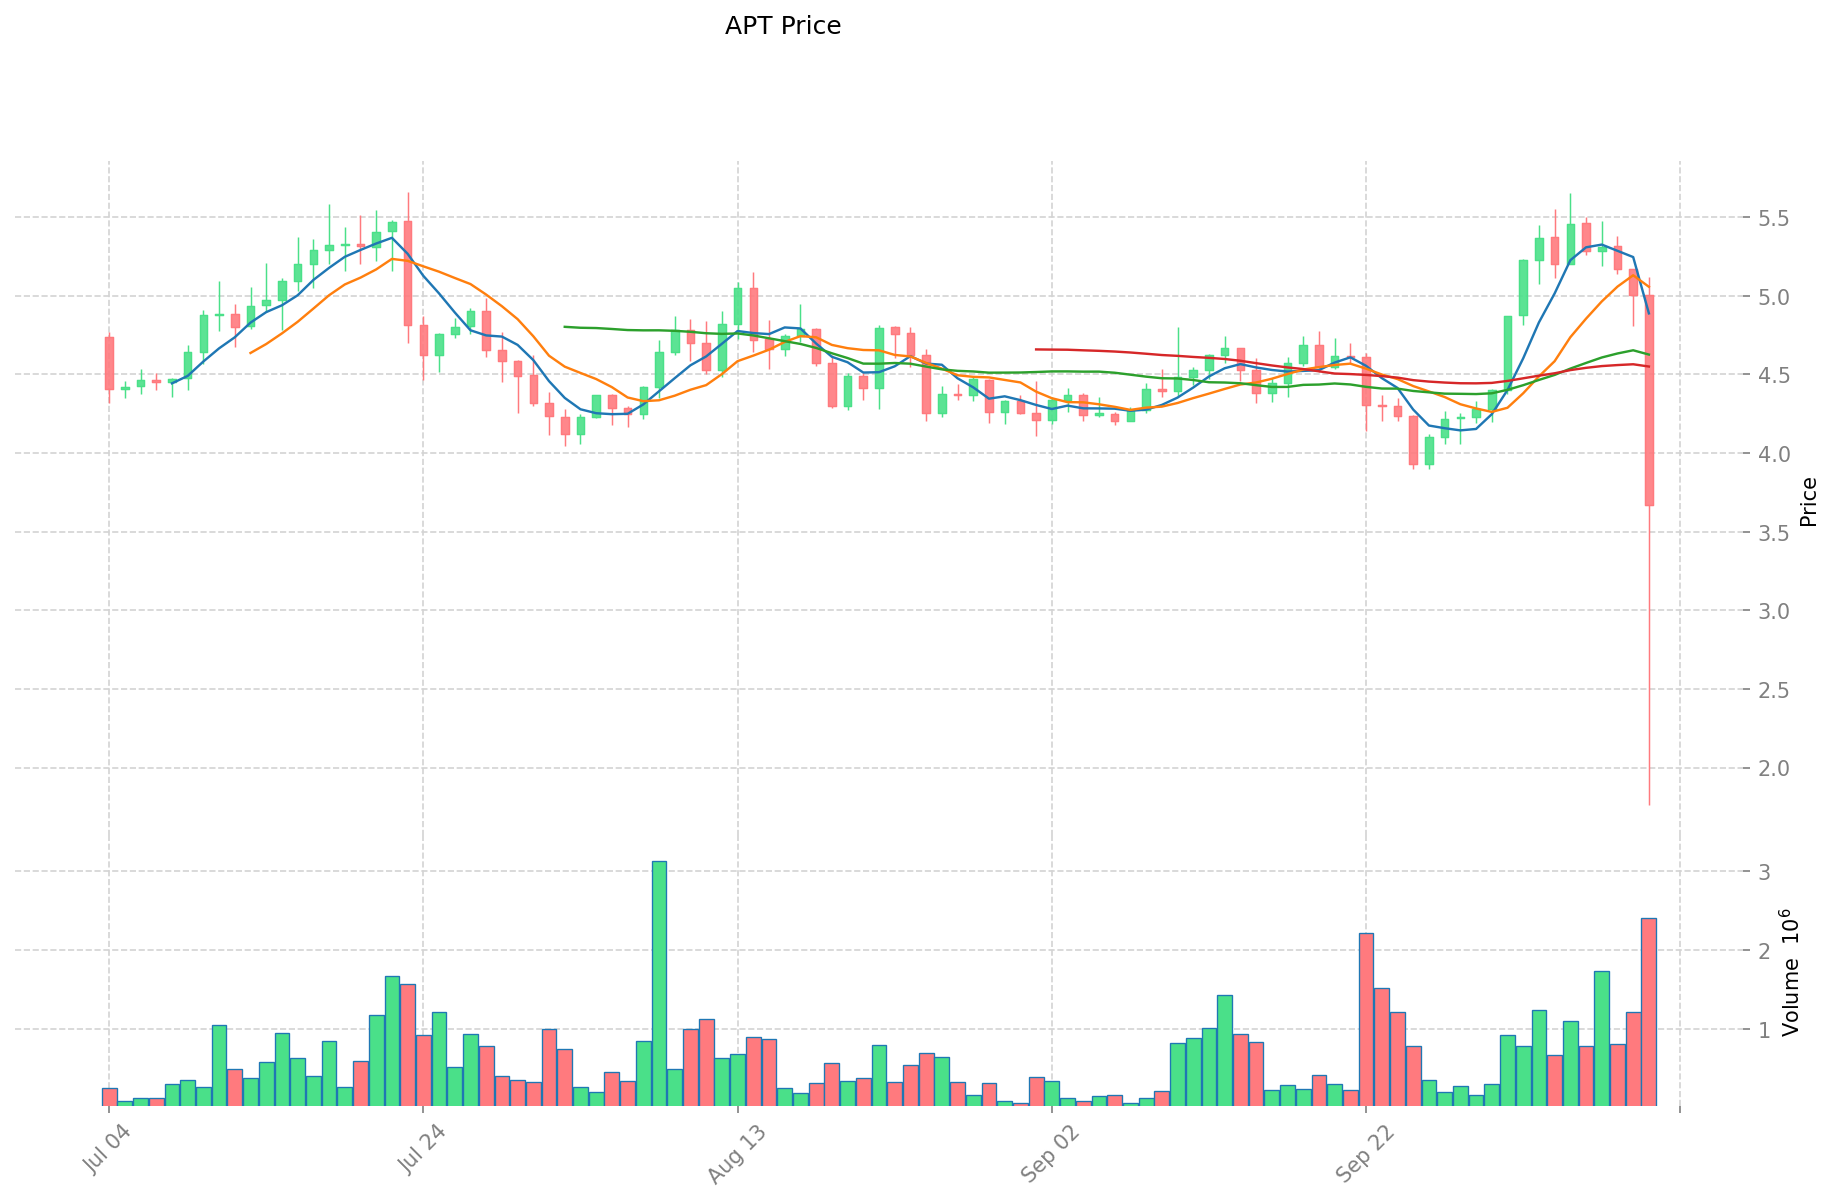
I. Price History Comparison and Current Market Status
BOOP and APT Historical Price Trends
- 2025: BOOP reached an all-time high of $0.3494, likely due to increased adoption in the Solana ecosystem.
- 2025: APT experienced significant volatility, dropping from its all-time high of $19.92 to a low of $2.8.
- Comparative analysis: In this market cycle, BOOP has fallen from $0.3494 to $0.01979, while APT has shown more resilience, currently trading at $3.709.
Current Market Situation (2025-10-11)
- BOOP current price: $0.01979
- APT current price: $3.709
- 24-hour trading volume: BOOP $40,228.78 vs APT $10,268,299.96
- Market Sentiment Index (Fear & Greed Index): 64 (Greed)
Click to view real-time prices:
- Check BOOP current price Market Price
- Check APT current price Market Price
II. Key Factors Affecting BOOP vs APT Investment Value
Supply Mechanism Comparison (Tokenomics)
- BOOP: Core tokenomics centered around airdrop mechanisms, with staking reward system to build community engagement and create a "cult-like" spreading atmosphere
- APT: Based on Layer 1 infrastructure technology, focusing on technical innovation as the driving force for cryptocurrency industry development
- 📌 Historical Pattern: BOOP's community-driven model relies on incentive design, while APT depends more on technical advancement and ecosystem adoption.
Institutional Adoption and Market Applications
- Institutional Holdings: APT appears more positioned for institutional interest as part of Layer 1 infrastructure projects attracting funds flowing into Ethereum ecosystem
- Enterprise Adoption: Technical innovation positions APT more favorably for long-term institutional integration
- Regulatory Policies: Regulatory environment remains a critical factor affecting both tokens, with policies across different jurisdictions impacting their investment potential
Technical Development and Ecosystem Building
- BOOP Technical Updates: Creator dingaling announced early termination of current airdrop plan due to design flaws, with new incentive system planned within 1-2 weeks to support more meaningful project launches
- APT Technical Development: Positioned as a Layer 1 infrastructure project with focus on technological innovation as core driver
- Ecosystem Comparison: BOOP focuses on subcultural identity through "online addict" and "meme creator" communities with KOL partnerships, while APT emphasizes technological infrastructure
Macroeconomic and Market Cycles
- Performance in Inflationary Environment: Market sentiment and macroeconomic policy improvements have been noted as factors in recent crypto market rebounds
- Macro Monetary Policy Effects: Economic policy shifts have contributed to price corrections and market sentiment shifts
- Geopolitical Factors: US cryptocurrency policy benefits have influenced the broader market, with ETF applications representing a connection point between traditional finance and crypto markets
III. 2025-2030 Price Prediction: BOOP vs APT
Short-term Forecast (2025)
- BOOP: Conservative $0.0142 - $0.0198 | Optimistic $0.0198 - $0.0241
- APT: Conservative $2.63 - $3.65 | Optimistic $3.65 - $5.19
Mid-term Forecast (2027)
- BOOP may enter a growth phase, with prices expected in the range of $0.0125 - $0.0234
- APT may enter a bullish market, with prices expected in the range of $4.90 - $6.02
- Key drivers: Institutional capital inflow, ETF developments, ecosystem growth
Long-term Forecast (2030)
- BOOP: Base scenario $0.0199 - $0.0332 | Optimistic scenario $0.0332 - $0.0411
- APT: Base scenario $4.34 - $7.23 | Optimistic scenario $7.23 - $9.40
Disclaimer: The above forecasts are based on historical data and market analysis. Cryptocurrency markets are highly volatile and unpredictable. This information should not be considered as financial advice. Always conduct your own research before making investment decisions.
BOOP:
| 年份 | 预测最高价 | 预测平均价格 | 预测最低价 | 涨跌幅 |
|---|---|---|---|---|
| 2025 | 0.0241438 | 0.01979 | 0.0142488 | 0 |
| 2026 | 0.022625907 | 0.0219669 | 0.018012858 | 11 |
| 2027 | 0.023411223675 | 0.0222964035 | 0.01248598596 | 12 |
| 2028 | 0.03245241529425 | 0.0228538135875 | 0.01508351696775 | 15 |
| 2029 | 0.038714360217225 | 0.027653114440875 | 0.02654698986324 | 39 |
| 2030 | 0.041147834288022 | 0.03318373732905 | 0.01991024239743 | 67 |
APT:
| 年份 | 预测最高价 | 预测平均价格 | 预测最低价 | 涨跌幅 |
|---|---|---|---|---|
| 2025 | 5.18584 | 3.652 | 2.62944 | -1 |
| 2026 | 5.7887852 | 4.41892 | 2.8281088 | 19 |
| 2027 | 6.022546068 | 5.1038526 | 4.899698496 | 37 |
| 2028 | 6.89836717416 | 5.563199334 | 4.83998342058 | 49 |
| 2029 | 8.2246338953856 | 6.23078325408 | 4.9223187707232 | 67 |
| 2030 | 9.39602114715264 | 7.2277085747328 | 4.33662514483968 | 94 |
IV. Investment Strategy Comparison: BOOP vs APT
Long-term vs Short-term Investment Strategies
- BOOP: Suitable for investors focused on community engagement and meme culture potential
- APT: Suitable for investors interested in Layer 1 infrastructure and technological innovation
Risk Management and Asset Allocation
- Conservative investors: BOOP: 10% vs APT: 90%
- Aggressive investors: BOOP: 30% vs APT: 70%
- Hedging tools: Stablecoin allocation, options, cross-currency portfolios
V. Potential Risk Comparison
Market Risks
- BOOP: High volatility due to community-driven nature and meme-based value
- APT: Susceptibility to broader Layer 1 competition and market cycles
Technical Risks
- BOOP: Dependency on Solana ecosystem, potential design flaws in incentive systems
- APT: Scalability challenges, network stability issues
Regulatory Risks
- Global regulatory policies may have differing impacts on both tokens, with APT potentially facing more scrutiny as a Layer 1 project
VI. Conclusion: Which Is the Better Buy?
📌 Investment Value Summary:
- BOOP advantages: Strong community engagement, potential for viral growth
- APT advantages: Solid technological foundation, potential for institutional adoption
✅ Investment Advice:
- New investors: Consider a small allocation to BOOP for exposure to community-driven projects, with a larger focus on APT for its technological potential
- Experienced investors: Balanced approach with a tilt towards APT for its long-term infrastructure play
- Institutional investors: Primary focus on APT due to its positioning as a Layer 1 project with potential for enterprise integration
⚠️ Risk Warning: The cryptocurrency market is highly volatile. This article does not constitute investment advice. None
VII. FAQ
Q1: What are the main differences between BOOP and APT? A: BOOP is a community-driven token in the Solana ecosystem focused on rewarding meme creators, while APT is a Layer 1 blockchain project emphasizing technological innovation and scalability.
Q2: Which token has shown better price performance recently? A: As of October 11, 2025, APT has shown more price resilience, trading at $3.709, while BOOP has fallen to $0.01979 from its all-time high of $0.3494.
Q3: How do the supply mechanisms differ between BOOP and APT? A: BOOP's tokenomics centers around airdrop mechanisms and staking rewards to build community engagement, while APT focuses on technical innovation as the driving force for value creation.
Q4: Which token is more likely to attract institutional investment? A: APT is more positioned for institutional interest due to its status as a Layer 1 infrastructure project, potentially attracting funds flowing into the broader blockchain ecosystem.
Q5: What are the long-term price predictions for BOOP and APT by 2030? A: For BOOP, the base scenario predicts $0.0199 - $0.0332, with an optimistic scenario of $0.0332 - $0.0411. For APT, the base scenario predicts $4.34 - $7.23, with an optimistic scenario of $7.23 - $9.40.
Q6: How should investors allocate their portfolio between BOOP and APT? A: Conservative investors might consider 10% BOOP and 90% APT, while aggressive investors might opt for 30% BOOP and 70% APT. However, individual allocations should be based on personal risk tolerance and investment goals.
Q7: What are the main risks associated with investing in BOOP and APT? A: BOOP faces high volatility due to its community-driven nature, while APT is susceptible to broader Layer 1 competition. Both tokens are subject to market, technical, and regulatory risks, with APT potentially facing more regulatory scrutiny as a Layer 1 project.
Share
Content
Introduction: BOOP vs APT Investment Comparison
I. Price History Comparison and Current Market Status
II. Key Factors Affecting BOOP vs APT Investment Value
III. 2025-2030 Price Prediction: BOOP vs APT
IV. Investment Strategy Comparison: BOOP vs APT
V. Potential Risk Comparison
VI. Conclusion: Which Is the Better Buy?
VII. FAQ

