DYP vs OP: The Battle for Supremacy in Mobile Gaming
Introduction: DYP vs OP Investment Comparison
In the cryptocurrency market, the comparison between Dypius (DYP) and Optimism (OP) has been an unavoidable topic for investors. The two not only show significant differences in market cap ranking, application scenarios, and price performance, but also represent different positioning in crypto assets.
Dypius (DYP): Since its launch in 2020, it has gained market recognition for its focus on scalability, security, and global adoption through next-gen infrastructure.
Optimism (OP): Introduced in 2022, it has been hailed as a low-cost, lightning-fast Ethereum Layer 2 solution, becoming one of the most prominent scaling solutions in the crypto space.
This article will provide a comprehensive analysis of the investment value comparison between DYP and OP, focusing on historical price trends, supply mechanisms, institutional adoption, technological ecosystems, and future predictions, attempting to answer the question most crucial to investors:
"Which is the better buy right now?"
I. Price History Comparison and Current Market Status
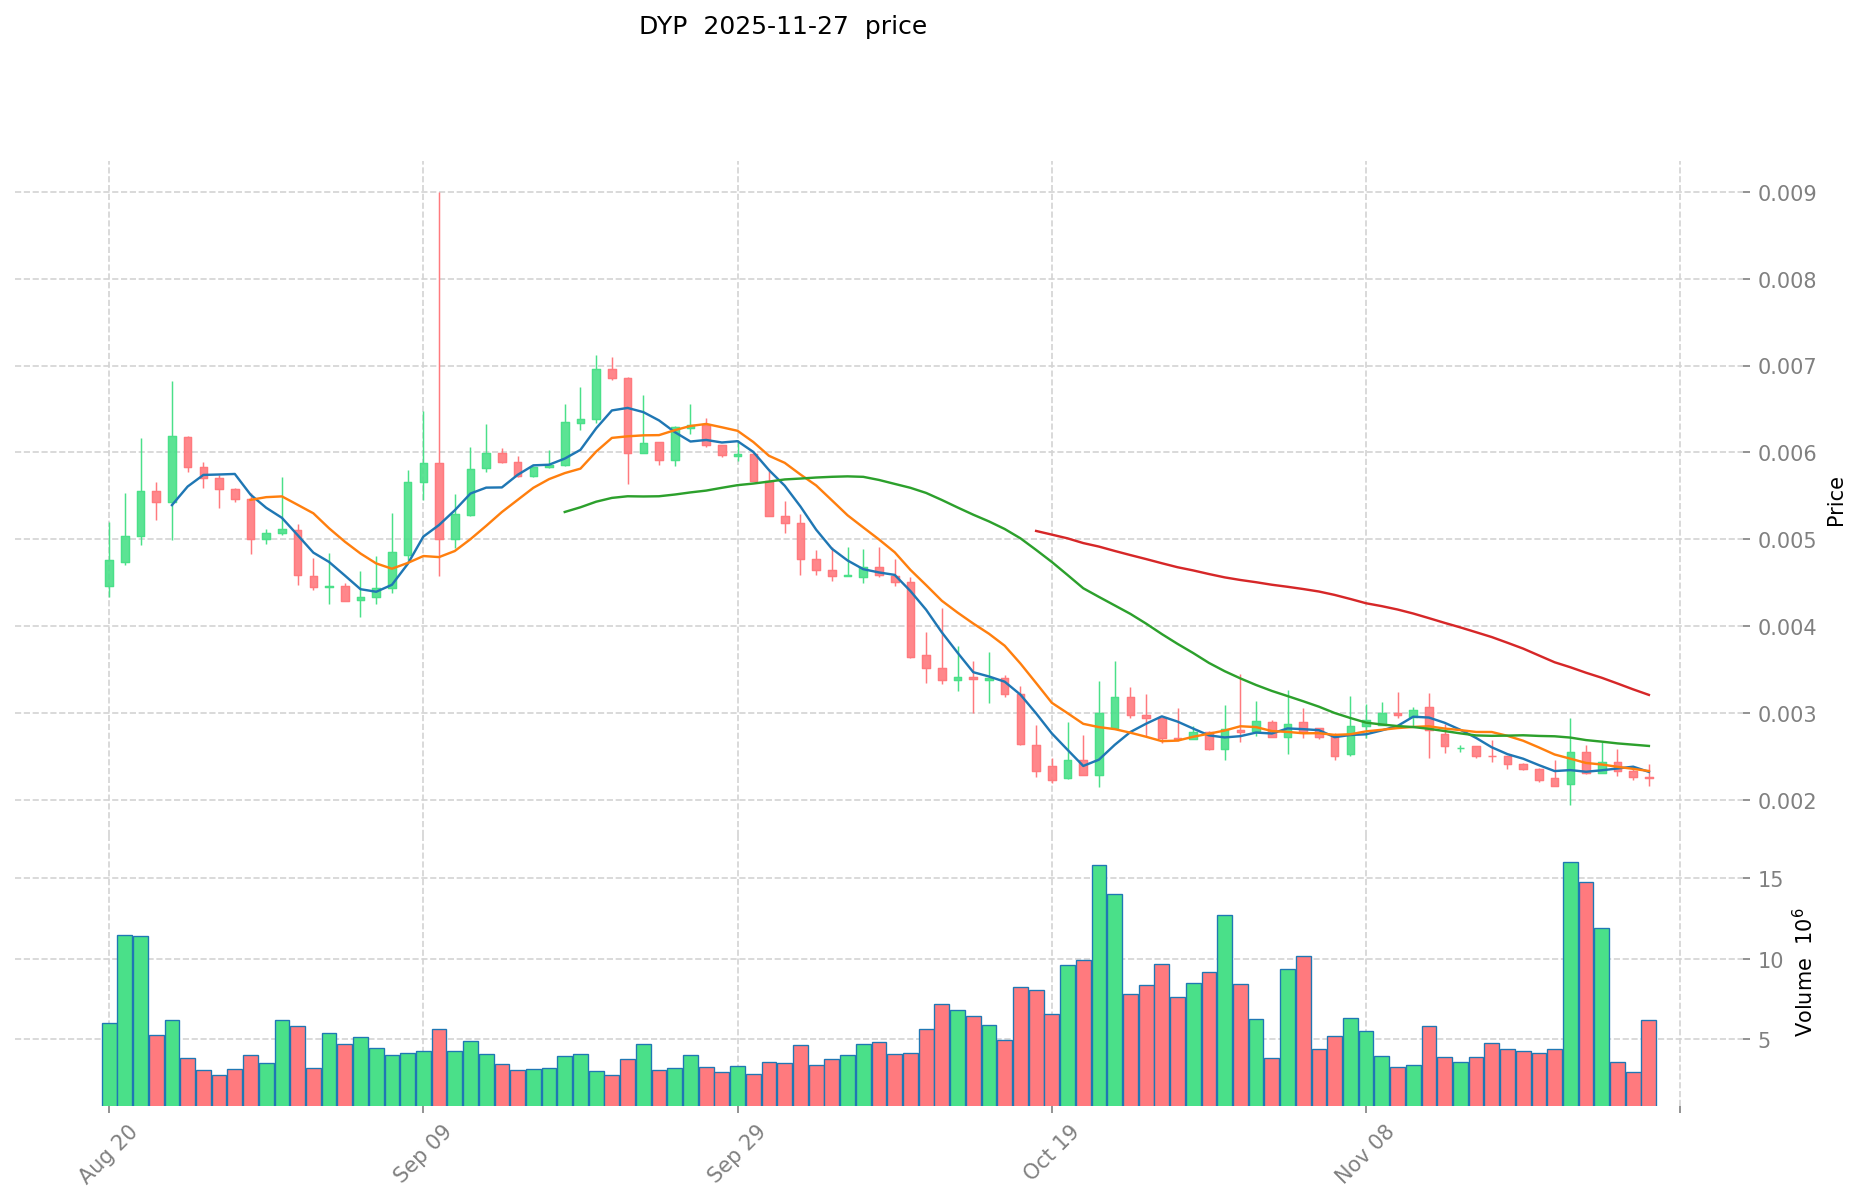
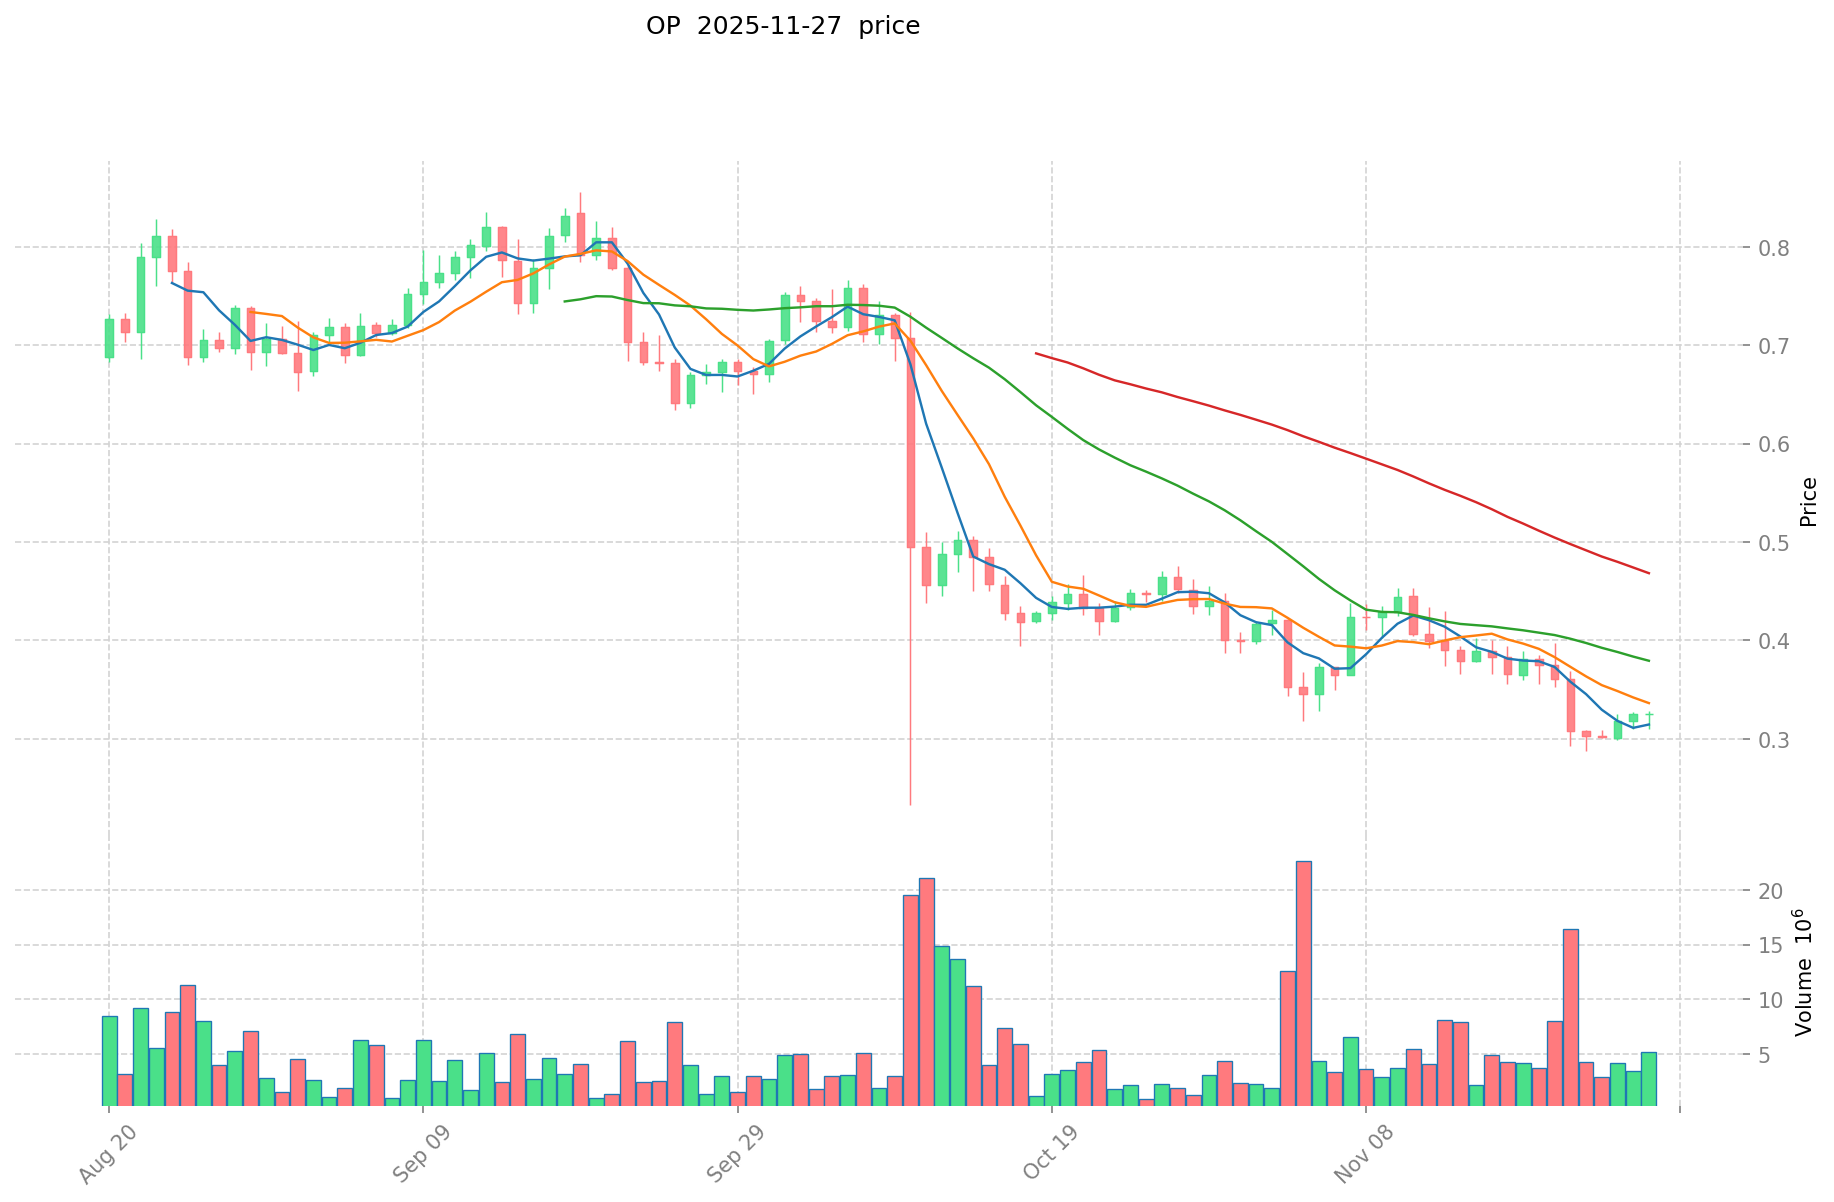
DYP (Coin A) and OP (Coin B) Historical Price Trends
- 2024: OP reached its all-time high of $4.84 on March 6, 2024, likely due to significant ecosystem growth or market optimism.
- 2025: Both DYP and OP experienced substantial price declines, with DYP reaching its all-time low of $0.00193045 on November 21, 2025, and OP hitting its all-time low of $0.288846 on November 22, 2025.
- Comparative Analysis: In the current market cycle, DYP has fallen from its all-time high of $0.211299 to its current price of $0.002194, representing a 98.96% decrease. Similarly, OP has dropped from its peak of $4.84 to $0.3256, a 93.27% decline.
Current Market Situation (2025-11-27)
- DYP current price: $0.002194
- OP current price: $0.3256
- 24-hour trading volume: $13,497.39 (DYP) vs $1,759,894.73 (OP)
- Market Sentiment Index (Fear & Greed Index): 22 (Extreme Fear)
Click to view real-time prices:
- View DYP current price Market Price
- View OP current price Market Price
II. Key Factors Affecting DYP vs OP Investment Value
Supply Mechanism Comparison (Tokenomics)
- DYP: Fixed maximum supply of 30 million tokens, with a current circulating supply of 24.75 million
- OP: Maximum supply of 4.3 billion tokens, distributed across community treasury (25%), investors (20%), core contributors (19%), etc.
- 📌 Historical pattern: Fixed supply tokens like DYP tend to become more scarce over time, while OP's gradual release through airdrops and ecosystem funding creates different price dynamics.
Institutional Adoption and Market Applications
- Institutional holdings: OP has gained more institutional traction, with backing from a16z and other prominent investors
- Enterprise adoption: OP has stronger enterprise adoption through the Optimism ecosystem, supporting major DeFi protocols
- Regulatory attitudes: Both tokens operate in similar regulatory environments, though OP's focus on Ethereum scaling may receive less scrutiny than DYP's yield products
Technical Development and Ecosystem Building
- DYP technical upgrades: Recent implementation of zero-fee instant staking and yield farming capabilities
- OP technical development: Continuous improvements to the Optimism layer-2 scaling solution, with regular updates to enhance efficiency
- Ecosystem comparison: OP has a significantly larger ecosystem with many major DeFi protocols building on Optimism, while DYP focuses specifically on yield optimization tools
Macroeconomic Factors and Market Cycles
- Performance during inflation: Both tokens have struggled during high inflation periods, but OP has shown more resilience due to broader ecosystem utility
- Macroeconomic monetary policy: Rising interest rates have negatively impacted both tokens, with traditional yield options becoming more competitive
- Geopolitical factors: OP's role in Ethereum scaling positions it better for global adoption as layer-2 solutions gain importance in the blockchain space
III. 2025-2030 Price Prediction: DYP vs OP
Short-term Prediction (2025)
- DYP: Conservative $0.00201383 - $0.002213 | Optimistic $0.002213 - $0.00227939
- OP: Conservative $0.234864 - $0.3262 | Optimistic $0.3262 - $0.433846
Mid-term Prediction (2027)
- DYP may enter a growth phase, with prices expected in the range of $0.001448795775 - $0.003380523475
- OP may enter a bullish market, with prices expected in the range of $0.2992681125 - $0.4987801875
- Key drivers: Institutional capital inflow, ETF developments, ecosystem growth
Long-term Prediction (2030)
- DYP: Base scenario $0.00371876899527 - $0.00524346428333 | Optimistic scenario $0.00524346428333+
- OP: Base scenario $0.5219834418225 - $0.683798308787475 | Optimistic scenario $0.683798308787475+
Disclaimer: The above predictions are based on historical data and current market trends. Cryptocurrency markets are highly volatile and subject to rapid changes. These forecasts should not be considered as financial advice. Always conduct your own research before making investment decisions.
DYP:
| 年份 | 预测最高价 | 预测平均价格 | 预测最低价 | 涨跌幅 |
|---|---|---|---|---|
| 2025 | 0.00227939 | 0.002213 | 0.00201383 | 0 |
| 2026 | 0.00258312425 | 0.002246195 | 0.001347717 | 2 |
| 2027 | 0.003380523475 | 0.002414659625 | 0.001448795775 | 10 |
| 2028 | 0.0031004229585 | 0.00289759155 | 0.001622651268 | 32 |
| 2029 | 0.00443853073629 | 0.00299900725425 | 0.002369215730857 | 36 |
| 2030 | 0.00524346428333 | 0.00371876899527 | 0.002305636777067 | 69 |
OP:
| 年份 | 预测最高价 | 预测平均价格 | 预测最低价 | 涨跌幅 |
|---|---|---|---|---|
| 2025 | 0.433846 | 0.3262 | 0.234864 | 0 |
| 2026 | 0.4180253 | 0.380023 | 0.34582093 | 16 |
| 2027 | 0.4987801875 | 0.39902415 | 0.2992681125 | 22 |
| 2028 | 0.574594776 | 0.44890216875 | 0.3097424964375 | 37 |
| 2029 | 0.53221841127 | 0.511748472375 | 0.35310644593875 | 57 |
| 2030 | 0.683798308787475 | 0.5219834418225 | 0.412366919039775 | 60 |
IV. Investment Strategy Comparison: DYP vs OP
Long-term vs Short-term Investment Strategies
- DYP: Suitable for investors focused on yield farming and DeFi ecosystems
- OP: Suitable for investors interested in Ethereum scaling solutions and Layer 2 technologies
Risk Management and Asset Allocation
- Conservative investors: DYP: 20% vs OP: 80%
- Aggressive investors: DYP: 40% vs OP: 60%
- Hedging tools: Stablecoin allocation, options, cross-currency portfolios
V. Potential Risk Comparison
Market Risks
- DYP: Higher volatility due to smaller market cap and lower liquidity
- OP: Susceptible to broader Ethereum ecosystem trends and Layer 2 competition
Technical Risks
- DYP: Scalability, network stability
- OP: Dependency on Ethereum's development, potential vulnerabilities in Layer 2 technology
Regulatory Risks
- Global regulatory policies may impact both tokens differently, with OP potentially facing less scrutiny due to its focus on scaling solutions
VI. Conclusion: Which Is the Better Buy?
📌 Investment Value Summary:
- DYP advantages: Focus on yield optimization, fixed supply tokenomics
- OP advantages: Strong institutional backing, larger ecosystem, crucial role in Ethereum scaling
✅ Investment Advice:
- New investors: Consider OP for its more established ecosystem and institutional support
- Experienced investors: Balanced portfolio with both DYP and OP, leveraging DYP for yield strategies
- Institutional investors: Focus on OP due to its strategic importance in the Ethereum ecosystem
⚠️ Risk Warning: The cryptocurrency market is highly volatile, and this article does not constitute investment advice. None
VII. FAQ
Q1: What are the main differences between DYP and OP? A: DYP focuses on yield optimization and has a fixed supply of 30 million tokens, while OP is an Ethereum Layer 2 scaling solution with a maximum supply of 4.3 billion tokens. OP has stronger institutional backing and a larger ecosystem, while DYP specializes in yield farming and DeFi tools.
Q2: Which token has performed better historically? A: OP has shown better historical performance. While both tokens have experienced significant price declines from their all-time highs, OP has fallen 93.27% compared to DYP's 98.96% decrease. OP also maintains a higher current price and trading volume.
Q3: How do the future price predictions compare for DYP and OP? A: Long-term predictions for 2030 suggest OP may have higher potential, with a base scenario range of $0.5219834418225 - $0.683798308787475, compared to DYP's $0.00371876899527 - $0.00524346428333. However, these predictions are speculative and subject to market volatility.
Q4: What are the key risk factors for each token? A: DYP faces higher volatility due to its smaller market cap and lower liquidity, as well as potential scalability issues. OP's main risks include dependency on Ethereum's development and competition from other Layer 2 solutions.
Q5: How might institutional investors view DYP vs OP? A: Institutional investors are likely to favor OP due to its stronger institutional backing, larger ecosystem, and strategic importance in Ethereum scaling. OP has gained more traction with prominent investors and supports major DeFi protocols.
Q6: What allocation strategy is recommended for different types of investors? A: Conservative investors might consider allocating 20% to DYP and 80% to OP, while aggressive investors could opt for 40% DYP and 60% OP. New investors may prefer OP for its more established ecosystem, while experienced investors might balance both tokens in their portfolio.
Q7: How might regulatory factors affect DYP and OP differently? A: While both tokens operate in similar regulatory environments, OP's focus on Ethereum scaling may receive less scrutiny than DYP's yield products. Global regulatory policies could impact the tokens differently, potentially favoring OP's scaling solution approach.
Share
Content
Introduction: DYP vs OP Investment Comparison
I. Price History Comparison and Current Market Status
II. Key Factors Affecting DYP vs OP Investment Value
III. 2025-2030 Price Prediction: DYP vs OP
IV. Investment Strategy Comparison: DYP vs OP
V. Potential Risk Comparison
VI. Conclusion: Which Is the Better Buy?
VII. FAQ

