EQTY vs TRX: Comparing Two Blockchain Platforms for Decentralized Applications
Introduction: Investment Comparison of EQTY vs TRX
In the cryptocurrency market, the comparison between EQTY vs TRX has been an unavoidable topic for investors. The two not only show significant differences in market cap ranking, application scenarios, and price performance, but also represent different positions in the crypto asset landscape.
EQTY (EQTY): Since its launch, it has gained market recognition for bridging real-world legal ownership with blockchain liquidity.
TRON (TRX): Introduced in 2017, it has been hailed as a decentralized platform for content sharing and entertainment, becoming one of the cryptocurrencies with the highest global trading volume and market capitalization.
This article will comprehensively analyze the investment value comparison between EQTY vs TRX, focusing on historical price trends, supply mechanisms, institutional adoption, technological ecosystems, and future predictions, attempting to answer the question most concerning to investors:
"Which is the better buy right now?"
I. Price History Comparison and Current Market Status
EQTY and TRX Historical Price Trends
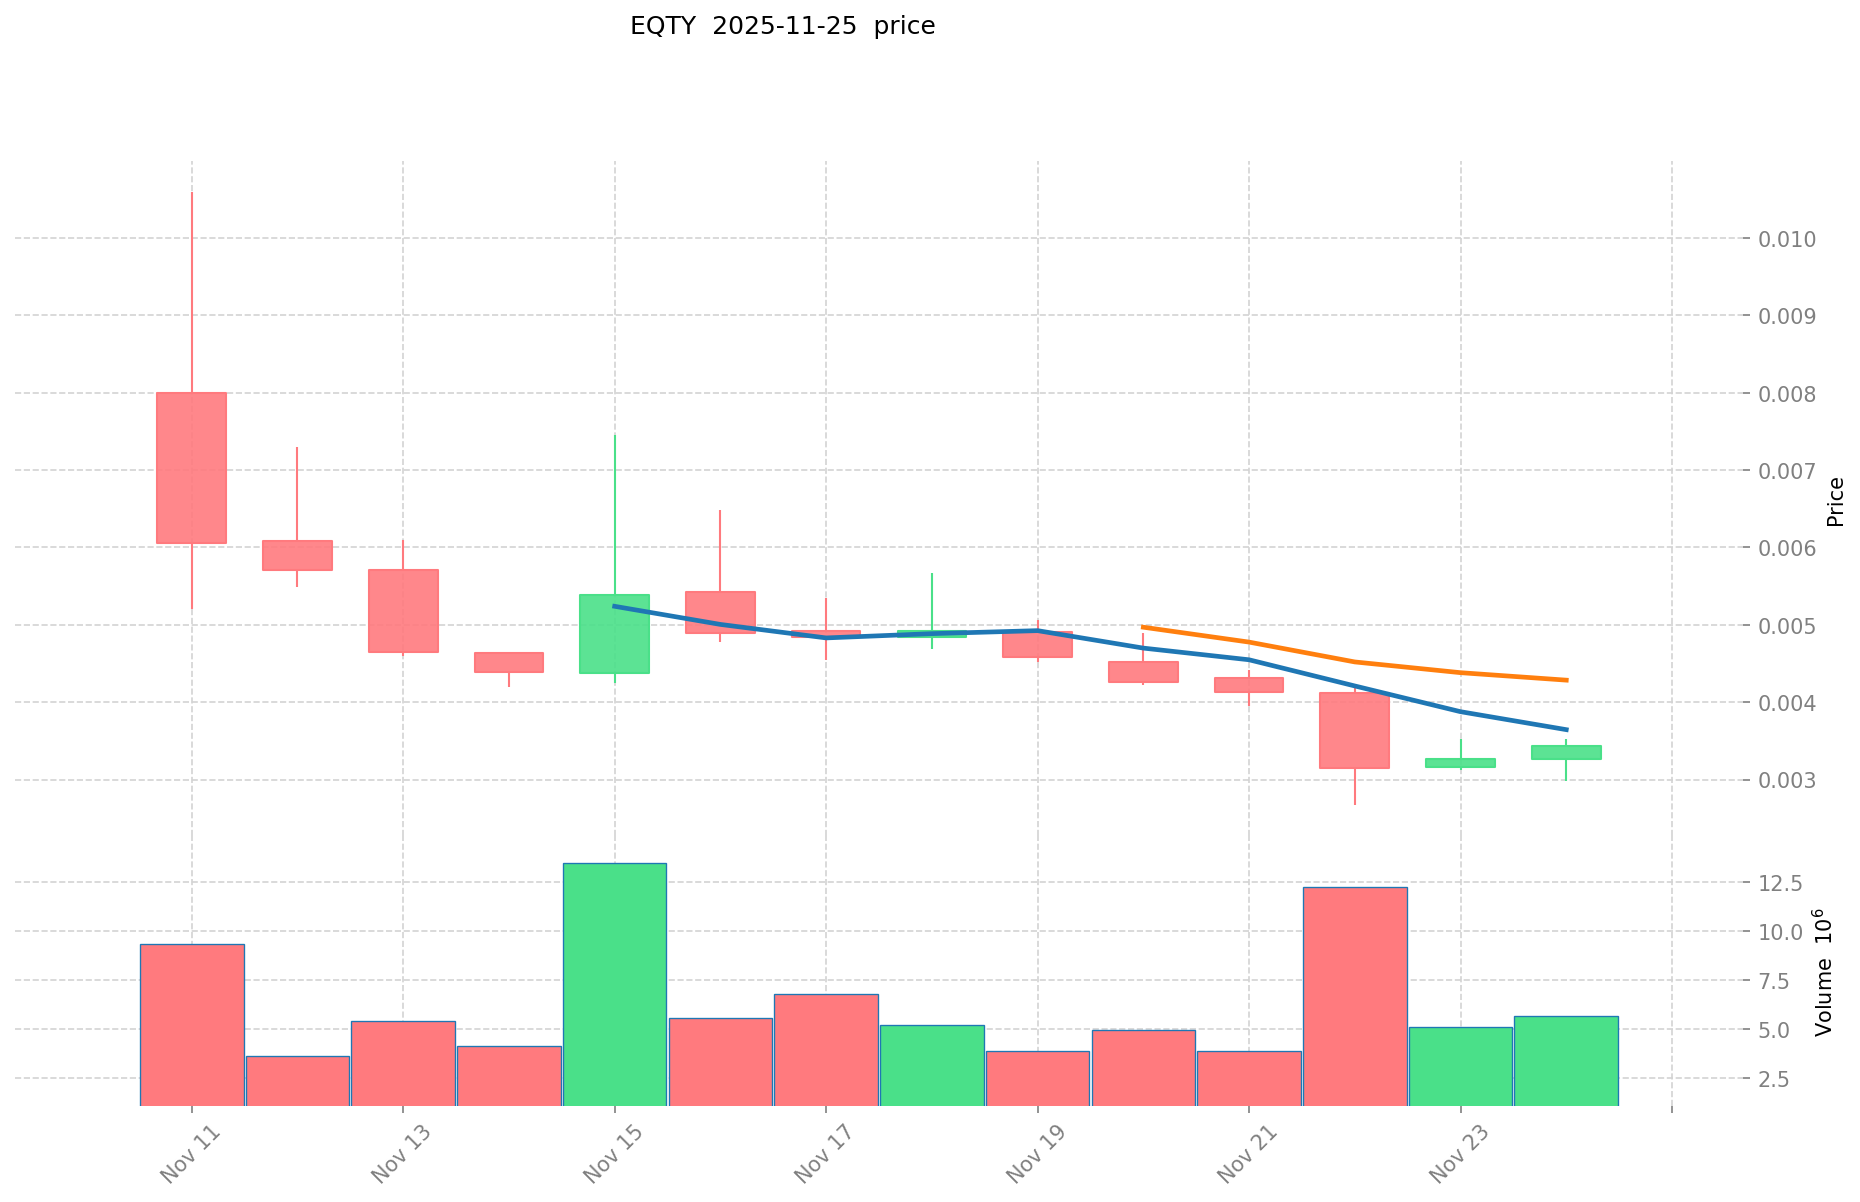
- 2025: EQTY reached an all-time high of $0.0106 on November 11, then declined to $0.002666 on November 22.
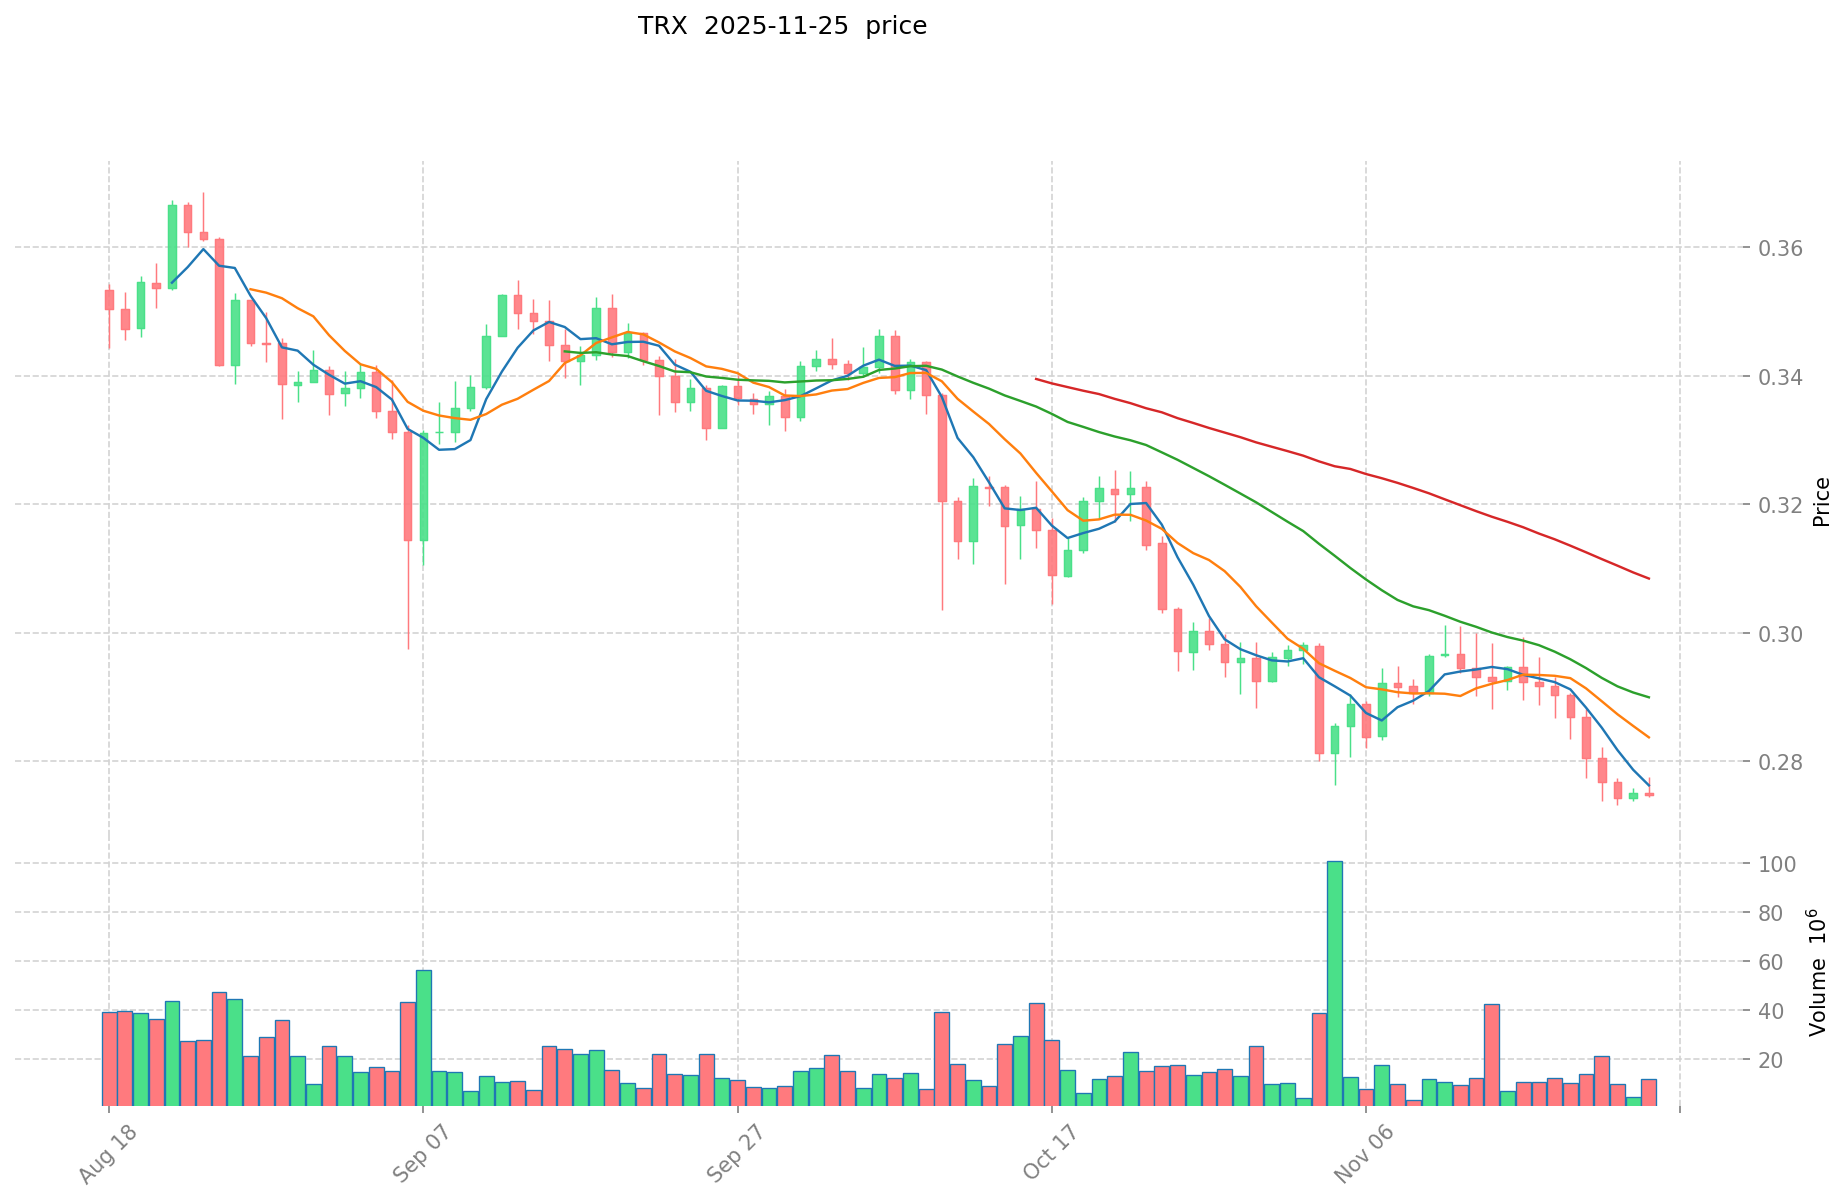
- 2024: TRX hit its all-time high of $0.431288 on December 4, marking a significant milestone for the project.
- Comparative Analysis: In the recent market cycle, EQTY dropped from $0.0106 to $0.002666, while TRX has shown more stability, maintaining a price above $0.27.
Current Market Situation (2025-11-26)
- EQTY current price: $0.003117
- TRX current price: $0.2739
- 24-hour trading volume: EQTY $8,929.70 vs TRX $4,539,103.50
- Market Sentiment Index (Fear & Greed Index): 20 (Extreme Fear)
Click to view real-time prices:
- View EQTY current price Market Price
- View TRX current price Market Price
II. Core Factors Affecting EQTY vs TRX Investment Value
Supply Mechanism Comparison (Tokenomics)
- TRX: Through reverse merger, TRX has become a core asset of the company, with potential dividend mechanism planned for future implementation
- EQTY: The company's core value driver is not traditional operating profit, but rather the holding and growth of digital assets
Institutional Adoption and Market Applications
- Institutional Holdings: TRX's on-chain performance and market value are being directly mapped to capital market valuations through listed company financial statements
- Corporate Adoption: PIPE (Private Investment in Public Equity) transactions are enabling public companies to become on-chain protocols
- Regulatory Attitudes: Future developments may include political and family factors in the TRX ecosystem
Technical Development and Ecosystem Building
- TRX Technical Development: Future plans may include the introduction of a TRX dividend mechanism
- Ecosystem Comparison: The DAT (Digital Asset Treasury) model represents a new investment tool that helps digital assets accumulate lasting value
Macroeconomic and Market Cycles
- Performance in Inflationary Environments: MSCI's January 15th decision could trigger billions in passive fund outflows due to reassessment of balance sheets with high digital asset ratios
- Impact of Monetary Policy: The DAT model's inherent leverage effect means that when market sentiment is high, a 1% increase in crypto prices could drive stock prices up by 2% or more (and vice versa)
- Geopolitical Factors: In the Trump 2.0 era, the cryptocurrency industry is expected to experience disruptive development, with potentially $9 trillion in pension funds flowing into the crypto market
III. 2025-2030 Price Prediction: EQTY vs TRX
Short-term Prediction (2025)
- EQTY: Conservative $0.00197001 - $0.003127 | Optimistic $0.003127 - $0.00425272
- TRX: Conservative $0.1561173 - $0.27389 | Optimistic $0.27389 - $0.3779682
Mid-term Prediction (2027)
- EQTY may enter a growth phase, with estimated price range $0.002763889633 - $0.005216355082
- TRX may enter a stable growth phase, with estimated price range $0.23092076735 - $0.41210475404
- Key drivers: Institutional capital inflow, ETF, ecosystem development
Long-term Prediction (2030)
- EQTY: Base scenario $0.005641664394323 - $0.006338948757666 | Optimistic scenario $0.006338948757666 - $0.007163012096163
- TRX: Base scenario $0.414829743436681 - $0.538739926541145 | Optimistic scenario $0.538739926541145 - $0.581839120664436
Disclaimer: This information is for educational purposes only and should not be considered as financial advice. Cryptocurrency markets are highly volatile and unpredictable. Always conduct your own research before making any investment decisions.
EQTY:
| 年份 | 预测最高价 | 预测平均价格 | 预测最低价 | 涨跌幅 |
|---|---|---|---|---|
| 2025 | 0.00425272 | 0.003127 | 0.00197001 | 0 |
| 2026 | 0.0040957446 | 0.00368986 | 0.0029149894 | 18 |
| 2027 | 0.005216355082 | 0.0038928023 | 0.002763889633 | 24 |
| 2028 | 0.00596649808521 | 0.004554578691 | 0.00432684975645 | 46 |
| 2029 | 0.007417359127228 | 0.005260538388105 | 0.003366744568387 | 68 |
| 2030 | 0.007163012096163 | 0.006338948757666 | 0.005641664394323 | 103 |
TRX:
| 年份 | 预测最高价 | 预测平均价格 | 预测最低价 | 涨跌幅 |
|---|---|---|---|---|
| 2025 | 0.3779682 | 0.27389 | 0.1561173 | 0 |
| 2026 | 0.384596338 | 0.3259291 | 0.254224698 | 19 |
| 2027 | 0.41210475404 | 0.355262719 | 0.23092076735 | 29 |
| 2028 | 0.517973044302 | 0.38368373652 | 0.3606627123288 | 40 |
| 2029 | 0.62665146267129 | 0.450828390411 | 0.25697218253427 | 64 |
| 2030 | 0.581839120664436 | 0.538739926541145 | 0.414829743436681 | 96 |
IV. Investment Strategy Comparison: EQTY vs TRX
Long-term vs Short-term Investment Strategies
- EQTY: Suitable for investors focusing on real-world asset tokenization and blockchain liquidity
- TRX: Suitable for investors interested in content sharing platforms and high trading volume cryptocurrencies
Risk Management and Asset Allocation
- Conservative investors: EQTY: 20% vs TRX: 80%
- Aggressive investors: EQTY: 40% vs TRX: 60%
- Hedging tools: Stablecoin allocation, options, cross-currency portfolios
V. Potential Risk Comparison
Market Risk
- EQTY: High volatility due to recent launch and lower trading volume
- TRX: Potential market saturation in content sharing platforms
Technical Risk
- EQTY: Scalability, network stability
- TRX: Computing power concentration, security vulnerabilities
Regulatory Risk
- Different impacts of global regulatory policies on both assets
VI. Conclusion: Which Is the Better Buy?
📌 Investment Value Summary:
- EQTY advantages: Bridges real-world legal ownership with blockchain liquidity
- TRX advantages: Established platform for content sharing, high trading volume and market cap
✅ Investment Advice:
- New investors: Consider a balanced approach with a higher allocation to TRX for its established market presence
- Experienced investors: Explore EQTY for its unique value proposition in asset tokenization
- Institutional investors: Evaluate both assets based on their specific investment mandates and risk tolerance
⚠️ Risk Warning: The cryptocurrency market is highly volatile. This article does not constitute investment advice. None
VII. FAQ
Q1: What are the main differences between EQTY and TRX? A: EQTY focuses on bridging real-world legal ownership with blockchain liquidity, while TRX is a platform for content sharing and entertainment. EQTY is newer with a lower market cap, while TRX has a higher trading volume and market capitalization.
Q2: Which cryptocurrency has shown better price performance recently? A: TRX has shown more price stability recently, maintaining a price above $0.27. EQTY, being newer, has experienced more volatility, dropping from its all-time high of $0.0106 to around $0.003117.
Q3: How do the supply mechanisms of EQTY and TRX differ? A: TRX has become a core asset of its company through a reverse merger, with plans for a potential dividend mechanism. EQTY's value is driven by the holding and growth of digital assets rather than traditional operating profit.
Q4: What are the long-term price predictions for EQTY and TRX by 2030? A: For EQTY, the base scenario predicts a range of $0.005641664394323 - $0.006338948757666. For TRX, the base scenario predicts a range of $0.414829743436681 - $0.538739926541145.
Q5: How might institutional adoption affect EQTY and TRX? A: TRX's on-chain performance and market value are being directly mapped to capital market valuations through listed company financial statements. EQTY is part of a trend where PIPE transactions are enabling public companies to become on-chain protocols.
Q6: What are the potential risks for investing in EQTY and TRX? A: EQTY faces risks from high volatility due to its recent launch and lower trading volume. TRX may face market saturation in content sharing platforms. Both face technical risks such as scalability and security vulnerabilities, as well as regulatory risks from global policies.
Q7: How should different types of investors approach EQTY and TRX? A: New investors might consider a balanced approach with a higher allocation to TRX for its established market presence. Experienced investors could explore EQTY for its unique value proposition in asset tokenization. Institutional investors should evaluate both assets based on their specific investment mandates and risk tolerance.
Share
Content
Introduction: Investment Comparison of EQTY vs TRX
I. Price History Comparison and Current Market Status
II. Core Factors Affecting EQTY vs TRX Investment Value
III. 2025-2030 Price Prediction: EQTY vs TRX
IV. Investment Strategy Comparison: EQTY vs TRX
V. Potential Risk Comparison
VI. Conclusion: Which Is the Better Buy?
VII. FAQ

