FAR vs AAVE: Exploring the Differences in Decentralized Lending Protocols
Introduction: FAR vs AAVE Investment Comparison
In the cryptocurrency market, the comparison between FARCANA vs AAVE has been an unavoidable topic for investors. The two not only show significant differences in market cap ranking, application scenarios, and price performance, but also represent different positions in the crypto asset landscape.
FARCANA (FAR): Since its launch, it has gained market recognition for its position as a multiplayer arena hero shooter powered by a Web3 economy.
AAVE (AAVE): Since its inception in 2020, it has been hailed as an open-source decentralized lending protocol, becoming one of the cryptocurrencies with the highest global trading volume and market capitalization.
This article will provide a comprehensive analysis of the investment value comparison between FARCANA and AAVE, focusing on historical price trends, supply mechanisms, institutional adoption, technological ecosystems, and future predictions, attempting to answer the question that concerns investors the most:
"Which is the better buy right now?"
I. Price History Comparison and Current Market Status
FAR and AAVE Historical Price Trends
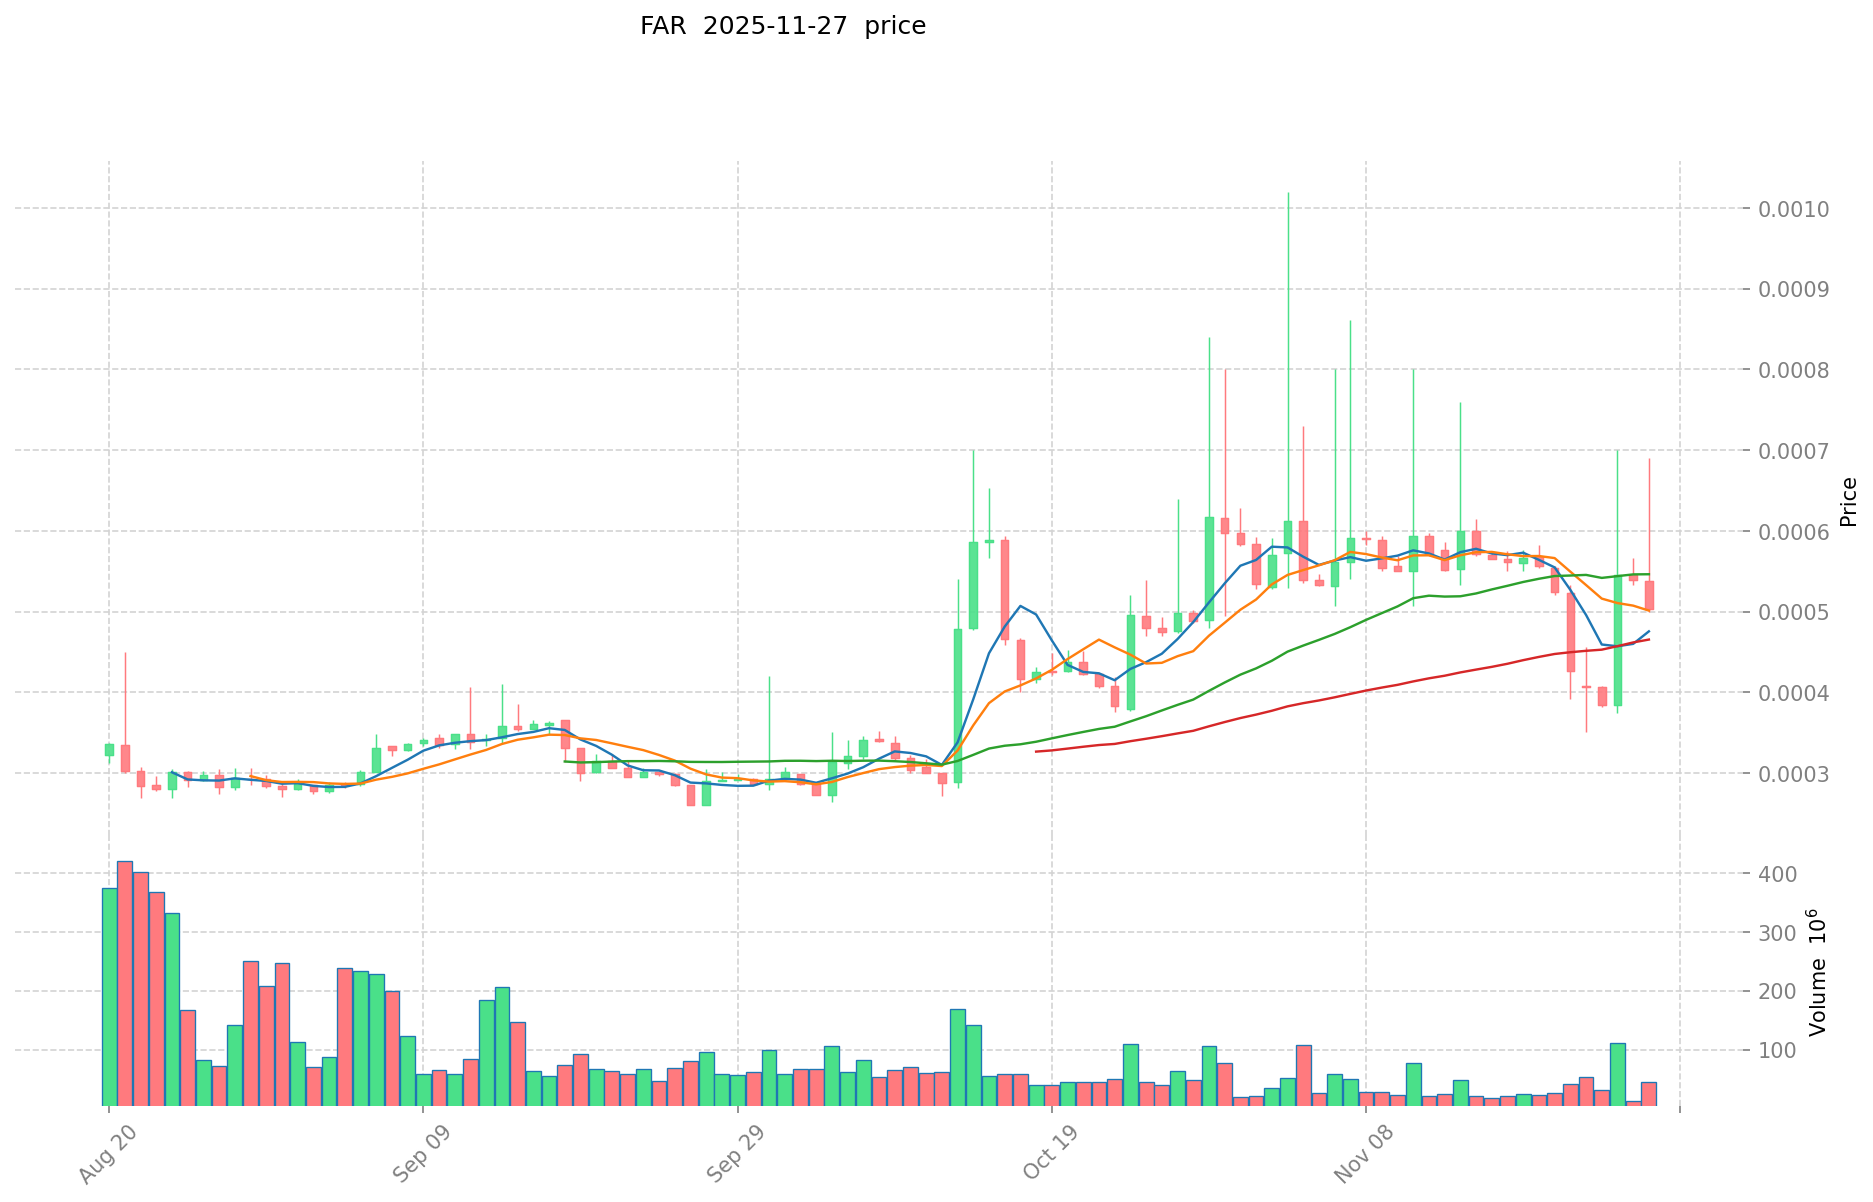
- 2024: FAR reached its all-time high of $0.21 on March 1, 2024.
- 2025: FAR hit its all-time low of $0.00015 on August 3, 2025.
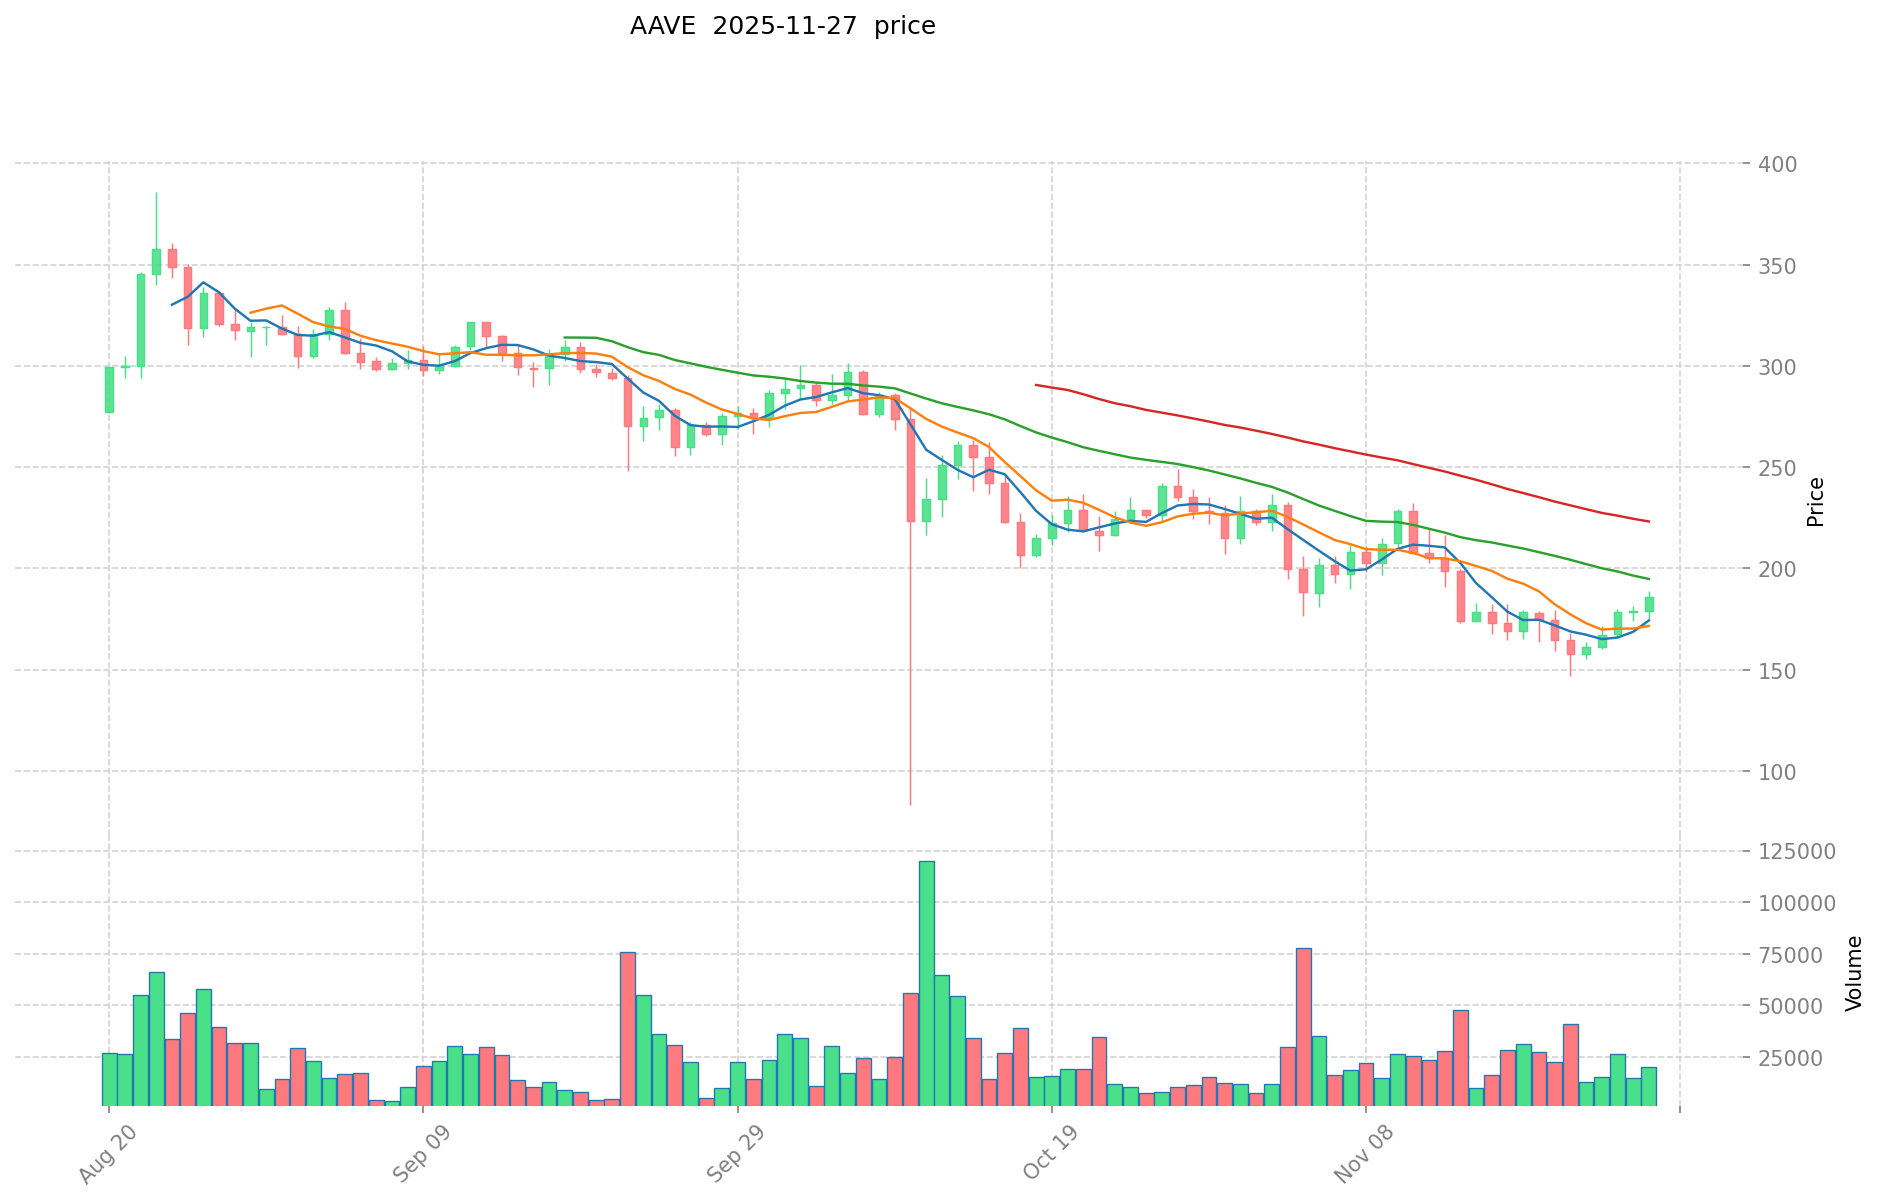
- 2021: AAVE reached its all-time high of $661.69 on May 19, 2021.
- 2020: AAVE recorded its all-time low of $26.02 on November 5, 2020.
- Comparative analysis: FAR has experienced a significant price decline of 95.1% over the past year, while AAVE has shown more stability with a slight increase of 0.86% in the same period.
Current Market Situation (2025-11-27)
- FAR current price: $0.000502
- AAVE current price: $183.22
- 24-hour trading volume: FAR $17,349.96 vs AAVE $3,515,169.94
- Market Sentiment Index (Fear & Greed Index): 22 (Extreme Fear)
Click to view real-time prices:
- View FAR current price Market Price
- View AAVE current price Market Price
II. Core Factors Affecting Investment Value of FAR vs AAVE
Supply Mechanism Comparison (Tokenomics)
-
FAR: Max supply cap of 1 billion tokens, with 65% allocated to the community and 35% to the core contributors and investors
-
AAVE: Fixed supply of 16 million tokens, with a portion burned through protocol fees, creating deflationary pressure
-
📌 Historical Pattern: Deflationary models like AAVE's tend to create upward price pressure during periods of increased protocol usage, while FAR's larger supply may offer more flexibility but potentially less scarcity value.
Institutional Adoption and Market Applications
- Institutional Holdings: AAVE has established presence in institutional portfolios with major funds and DeFi investors holding positions, while FAR is newer with growing institutional interest
- Enterprise Adoption: AAVE has broader integration across DeFi protocols as a lending standard, while FAR offers unique RWA functionalities attracting different enterprise use cases
- Regulatory Stance: Both operate in similar regulatory environments as DeFi lending protocols, with AAVE having longer regulatory exposure history
Technical Development and Ecosystem Building
- FAR Technical Upgrades: Novel collateral backing mechanism focusing on Real World Assets (RWAs), creating unique differentiation in the lending space
- AAVE Technical Development: Mature multi-chain deployment with V3 upgrades focusing on capital efficiency and risk management
- Ecosystem Comparison: AAVE has a more established ecosystem with widespread DeFi integrations, while FAR is building a specialized niche focused on RWA lending and sustainable yield generation
Macroeconomic Factors and Market Cycles
- Inflation Environment Performance: Both potentially offer inflation hedging properties as part of DeFi infrastructure, with AAVE's established usage patterns providing more historical data
- Monetary Policy Impact: Rising interest rates have historically impacted DeFi lending platforms, affecting yield comparisons between traditional finance and protocols like AAVE and FAR
- Geopolitical Factors: Growing demand for decentralized financial infrastructure globally benefits both protocols, with their cross-border functionality becoming increasingly valuable in uncertain geopolitical environments
III. 2025-2030 Price Prediction: FAR vs AAVE
Short-term Prediction (2025)
- FAR: Conservative $0.00034272 - $0.000504 | Optimistic $0.000504 - $0.00072072
- AAVE: Conservative $142.8024 - $183.08 | Optimistic $183.08 - $216.0344
Mid-term Prediction (2027)
- FAR may enter a growth phase, with an estimated price range of $0.00045819837 - $0.00074064942
- AAVE may enter a bullish market, with an estimated price range of $158.08921384 - $346.40136562
- Key drivers: Institutional capital inflow, ETF, ecosystem development
Long-term Prediction (2030)
- FAR: Base scenario $0.00081893857437 - $0.000868074888832 | Optimistic scenario $0.000868074888832+
- AAVE: Base scenario $406.18224968376825 - $499.604167111034947 | Optimistic scenario $499.604167111034947+
Disclaimer: This analysis is based on historical data and current market trends. Cryptocurrency markets are highly volatile and unpredictable. Always conduct your own research before making investment decisions.
FAR:
| 年份 | 预测最高价 | 预测平均价格 | 预测最低价 | 涨跌幅 |
|---|---|---|---|---|
| 2025 | 0.00072072 | 0.000504 | 0.00034272 | 0 |
| 2026 | 0.000642978 | 0.00061236 | 0.000551124 | 21 |
| 2027 | 0.00074064942 | 0.000627669 | 0.00045819837 | 25 |
| 2028 | 0.0008757237888 | 0.00068415921 | 0.000615743289 | 36 |
| 2029 | 0.00085793564934 | 0.0007799414994 | 0.000475764314634 | 55 |
| 2030 | 0.000868074888832 | 0.00081893857437 | 0.000483173758878 | 63 |
AAVE:
| 年份 | 预测最高价 | 预测平均价格 | 预测最低价 | 涨跌幅 |
|---|---|---|---|---|
| 2025 | 216.0344 | 183.08 | 142.8024 | 0 |
| 2026 | 265.411076 | 199.5572 | 123.725464 | 8 |
| 2027 | 346.40136562 | 232.484138 | 158.08921384 | 26 |
| 2028 | 379.1700048711 | 289.44275181 | 254.7096215928 | 57 |
| 2029 | 478.0581210269865 | 334.30637834055 | 180.525444303897 | 82 |
| 2030 | 499.604167111034947 | 406.18224968376825 | 377.749492205904472 | 121 |
IV. Investment Strategy Comparison: FAR vs AAVE
Long-term vs Short-term Investment Strategies
- FAR: Suitable for investors focused on gaming ecosystems and Web3 economy potential
- AAVE: Suitable for investors seeking DeFi exposure and lending protocol stability
Risk Management and Asset Allocation
- Conservative investors: FAR: 10% vs AAVE: 90%
- Aggressive investors: FAR: 30% vs AAVE: 70%
- Hedging tools: Stablecoin allocation, options, cross-currency portfolios
V. Potential Risk Comparison
Market Risk
- FAR: Higher volatility due to smaller market cap and newer project status
- AAVE: Exposed to overall DeFi market trends and competition from other lending protocols
Technical Risk
- FAR: Scalability, network stability in gaming environments
- AAVE: Smart contract vulnerabilities, liquidity risks
Regulatory Risk
- Global regulatory policies may have different impacts on both, with AAVE potentially facing more scrutiny due to its established position in DeFi lending
VI. Conclusion: Which Is the Better Buy?
📌 Investment Value Summary:
- FAR advantages: Unique position in gaming and Web3 economy, potential for high growth
- AAVE advantages: Established DeFi protocol, larger market cap, proven track record
✅ Investment Advice:
- New investors: Consider a small allocation to AAVE for DeFi exposure
- Experienced investors: Balanced portfolio with both AAVE and FAR, adjusting based on risk tolerance
- Institutional investors: AAVE for established DeFi exposure, FAR for diversification into gaming and Web3 sectors
⚠️ Risk Warning: The cryptocurrency market is highly volatile. This article does not constitute investment advice. None
VII. FAQ
Q1: What are the main differences between FAR and AAVE? A: FAR is a multiplayer arena hero shooter powered by a Web3 economy, while AAVE is an open-source decentralized lending protocol. FAR has a larger token supply of 1 billion, while AAVE has a fixed supply of 16 million tokens. AAVE is more established in the DeFi space, while FAR is newer and focuses on gaming and Web3 ecosystems.
Q2: Which cryptocurrency has shown better price performance recently? A: Based on the data provided, AAVE has shown more stability with a slight increase of 0.86% over the past year, while FAR has experienced a significant price decline of 95.1% in the same period.
Q3: How do the supply mechanisms of FAR and AAVE differ? A: FAR has a max supply cap of 1 billion tokens, with 65% allocated to the community and 35% to core contributors and investors. AAVE has a fixed supply of 16 million tokens, with a portion burned through protocol fees, creating deflationary pressure.
Q4: What are the key factors affecting the investment value of FAR and AAVE? A: Key factors include supply mechanisms, institutional adoption, market applications, technical development, ecosystem building, and macroeconomic factors such as inflation and monetary policy.
Q5: How do the long-term price predictions for FAR and AAVE compare? A: For 2030, FAR's base scenario predicts a range of $0.00081893857437 - $0.000868074888832, while AAVE's base scenario predicts a range of $406.18224968376825 - $499.604167111034947. AAVE is expected to have a higher percentage increase in value.
Q6: What are the main risks associated with investing in FAR and AAVE? A: Both face market risks, with FAR potentially having higher volatility due to its smaller market cap. Technical risks include scalability for FAR and smart contract vulnerabilities for AAVE. Regulatory risks are present for both, with AAVE potentially facing more scrutiny due to its established position in DeFi lending.
Q7: How might an investor allocate their portfolio between FAR and AAVE? A: Conservative investors might consider allocating 10% to FAR and 90% to AAVE, while aggressive investors might allocate 30% to FAR and 70% to AAVE. The specific allocation should be based on individual risk tolerance and investment goals.
Share
Content
Introduction: FAR vs AAVE Investment Comparison
I. Price History Comparison and Current Market Status
II. Core Factors Affecting Investment Value of FAR vs AAVE
III. 2025-2030 Price Prediction: FAR vs AAVE
IV. Investment Strategy Comparison: FAR vs AAVE
V. Potential Risk Comparison
VI. Conclusion: Which Is the Better Buy?
VII. FAQ

