FIWA vs BNB: The Battle for Blockchain Supremacy in the Financial Services Sector
Introduction: FIWA vs BNB Investment Comparison
In the cryptocurrency market, the comparison between FIWA and BNB has been an unavoidable topic for investors. The two not only show significant differences in market cap ranking, application scenarios, and price performance, but also represent different positioning in the crypto asset space.
FIWA (FIWA): Since its launch, it has gained market recognition for its role in the DeFi Warrior game and platform interactions.
BNB (BNB): Since its inception in 2017, it has been hailed as the fuel of the Binance ecosystem and is one of the cryptocurrencies with the highest global trading volume and market capitalization.
This article will provide a comprehensive analysis of the investment value comparison between FIWA and BNB, focusing on historical price trends, supply mechanisms, institutional adoption, technical ecosystems, and future predictions, while attempting to answer the question investors are most concerned about:
"Which is the better buy right now?"
I. Price History Comparison and Current Market Status
FIWA and BNB Historical Price Trends
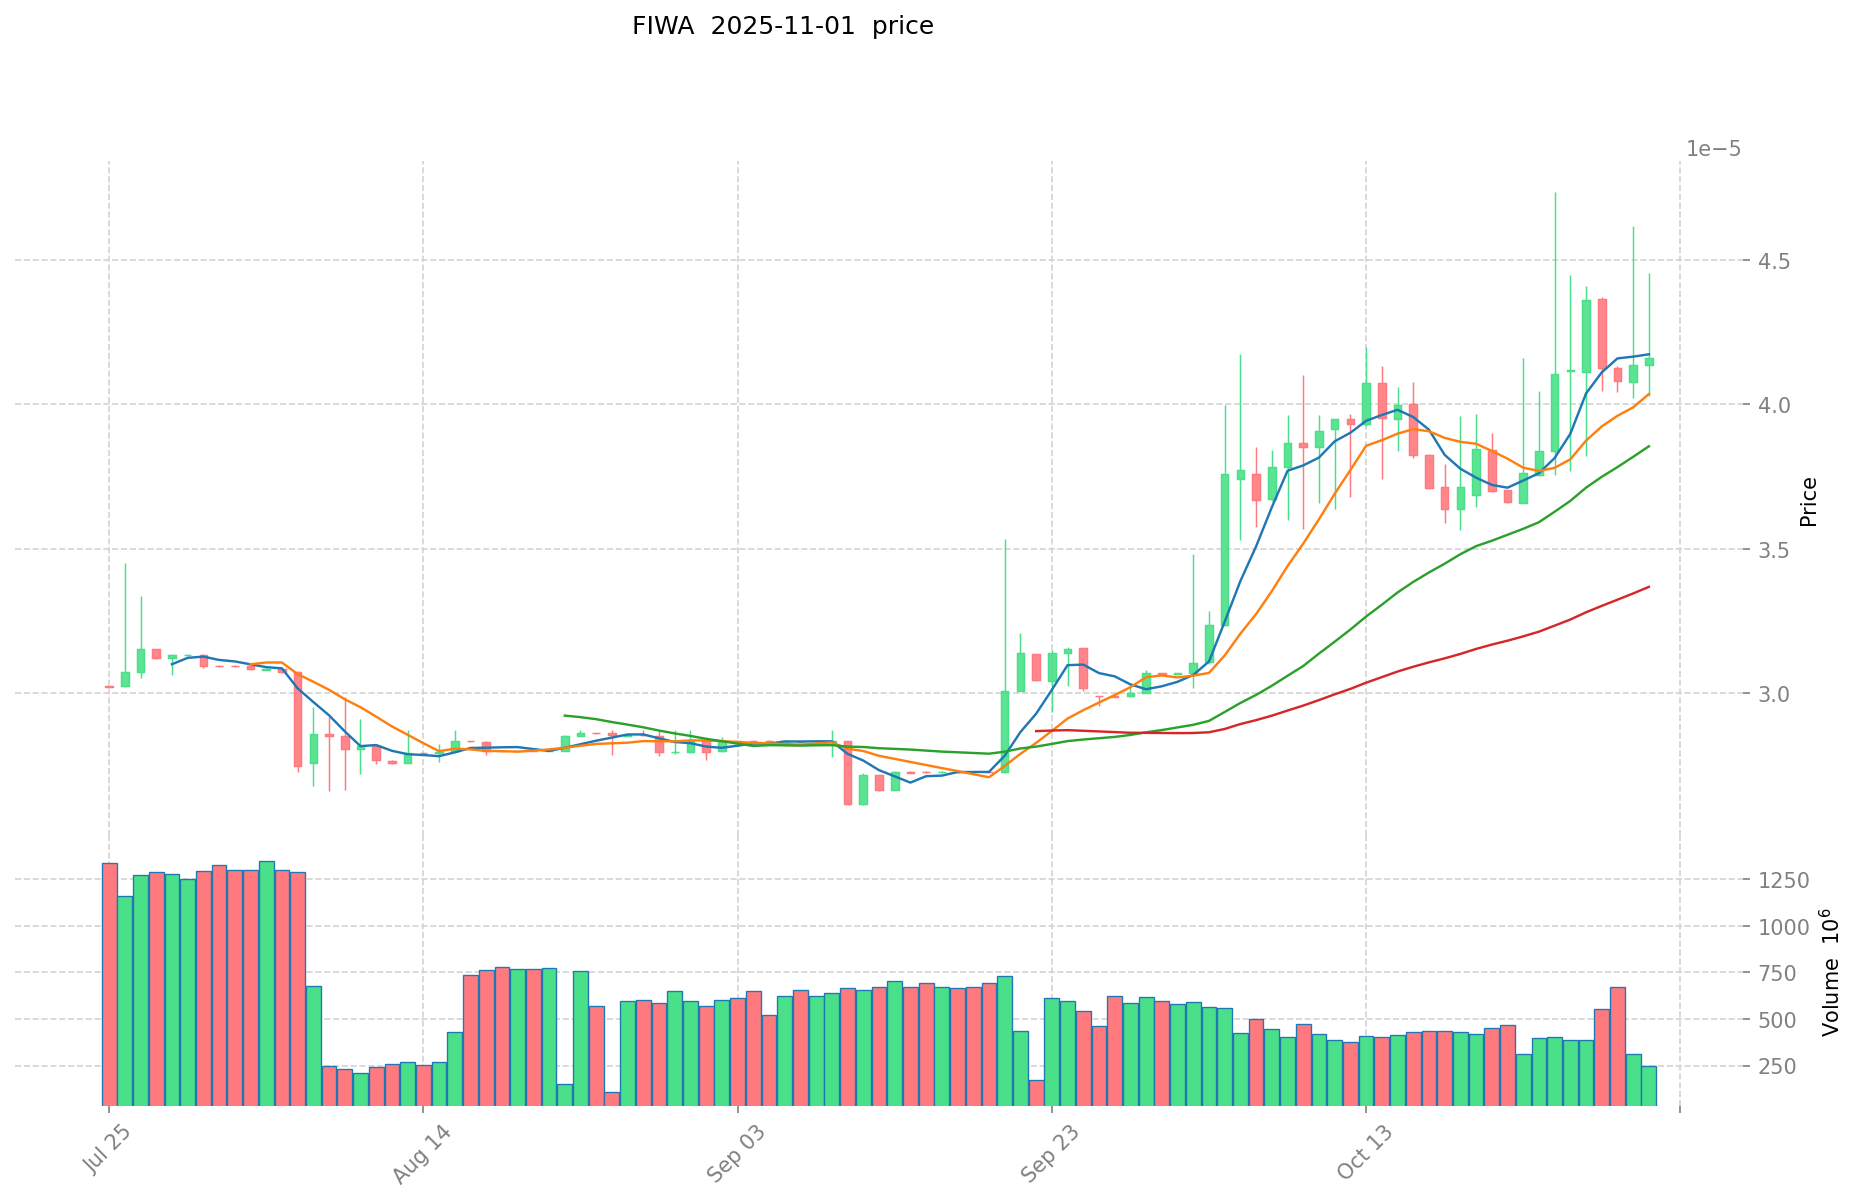
- 2021: FIWA reached its all-time high of $0.03683698 on September 7, 2021.
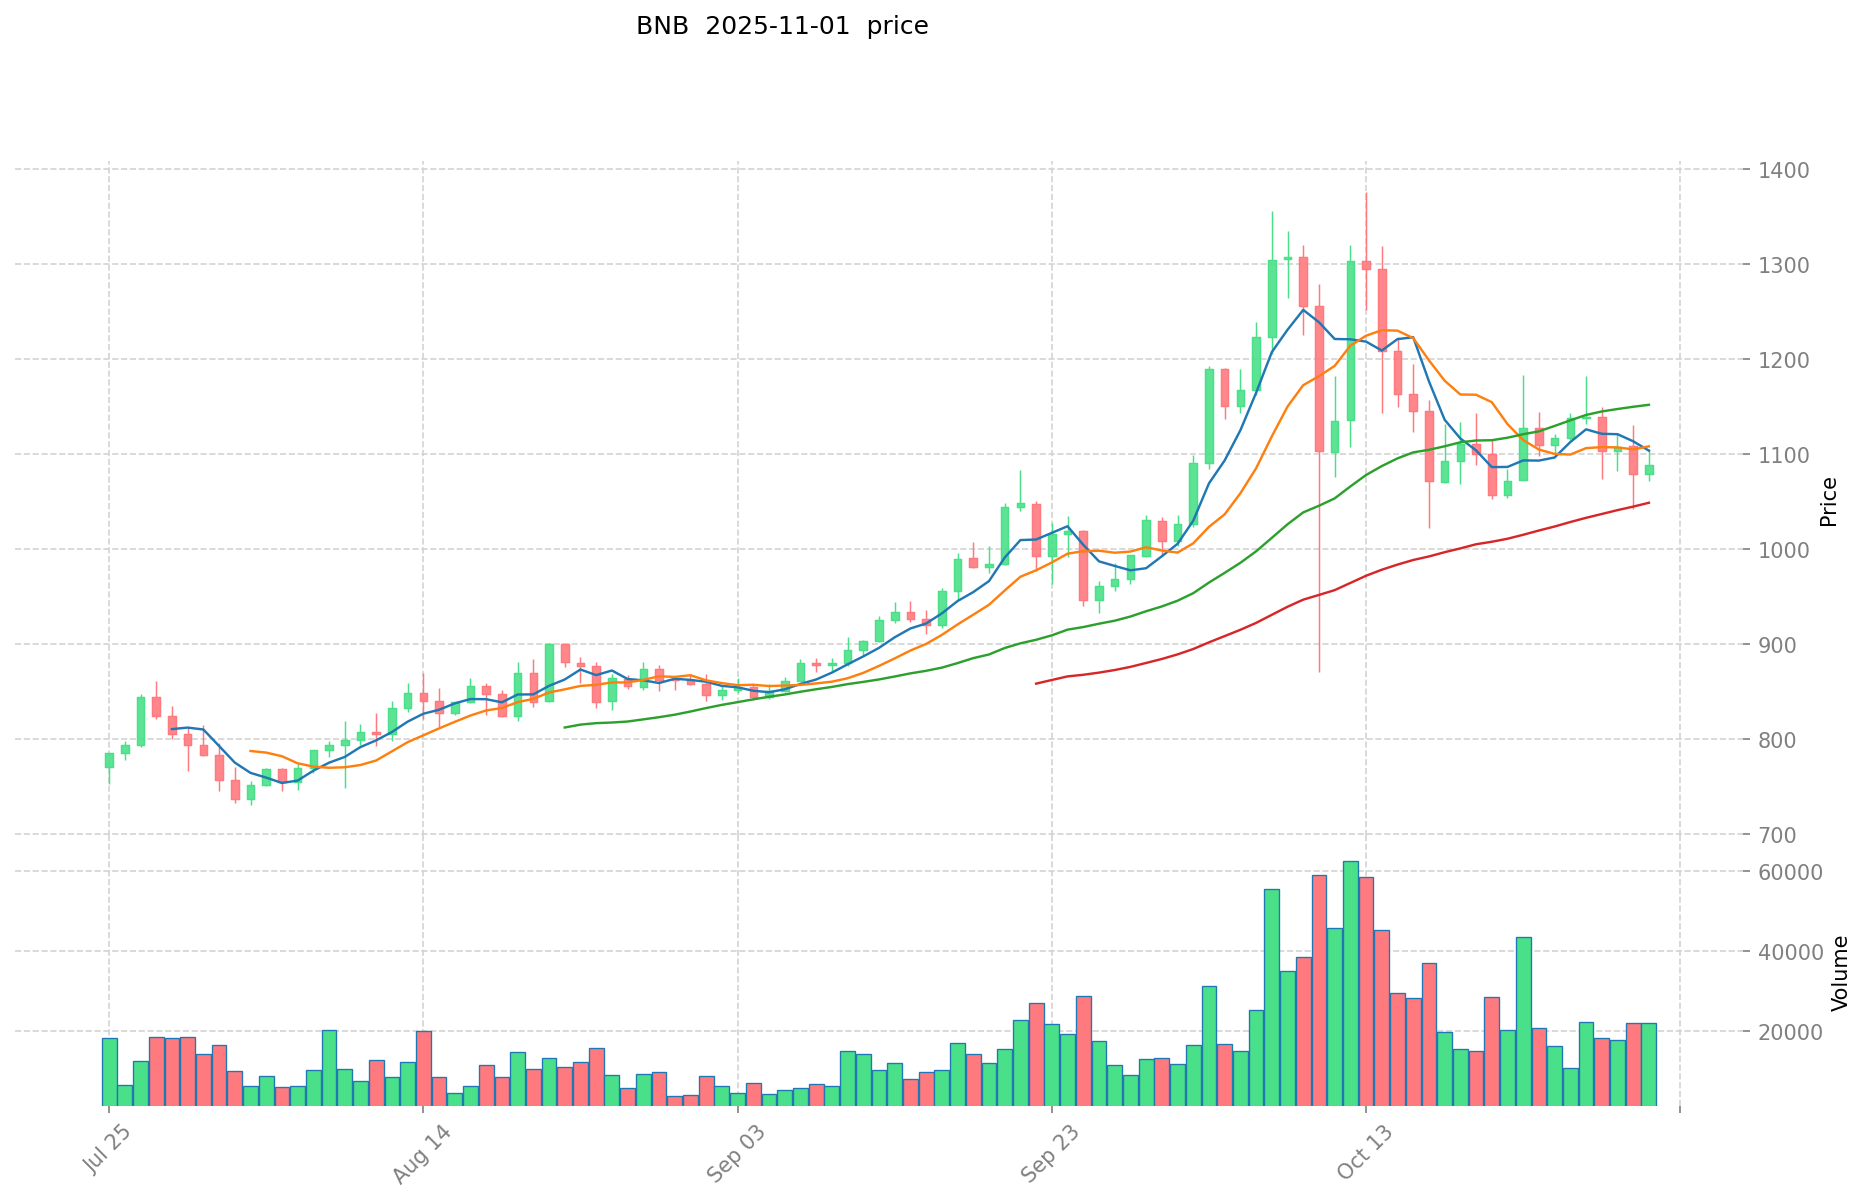
- 2025: BNB reached its all-time high of $1,369.99 on October 13, 2025.
- Comparative analysis: FIWA has dropped from its all-time high to its current price of $0.00004135, while BNB has shown more resilience, currently trading at $1,094.2.
Current Market Situation (2025-11-02)
- FIWA current price: $0.00004135
- BNB current price: $1,094.2
- 24-hour trading volume: FIWA $9,442.99 vs BNB $9,601,643.66
- Market Sentiment Index (Fear & Greed Index): 33 (Fear)
Click to view real-time prices:
- Check FIWA current price Market Price
- Check BNB current price Market Price
Comparative Analysis: FIWA vs BNB Investment Value Factors
I. Impact of Core Factors on FIWA vs BNB Investment Value
Supply Mechanism Comparison (Tokenomics)
- BNB: Features a deflationary model with regular token burns through the BNB Auto-Burn mechanism
- FIWA: Relies heavily on community-driven tokenomics with less established burning mechanisms
- 📌 Historical pattern: BNB's systematic burning has historically supported price stability, while FIWA's value depends more on community adoption patterns.
Institutional Adoption and Market Applications
- Institutional holdings: BNB has gained wider institutional acceptance through Binance's ecosystem
- Enterprise adoption: BNB is extensively used across Binance Smart Chain for low-cost transactions and DeFi applications
- Regulatory attitudes: BNB faces more regulatory scrutiny due to its prominence, while FIWA operates in a less regulated space
Technical Development and Ecosystem Building
- BNB technical development: Powers the Binance Smart Chain with fast transaction times and low costs
- FIWA technical outlook: Less established technical infrastructure compared to BNB
- Ecosystem comparison: BNB supports a vast ecosystem of DeFi projects, NFTs, and decentralized applications, while FIWA's ecosystem is still developing
Macroeconomic Factors and Market Cycles
- Performance during inflation: BNB has demonstrated better resilience during inflationary periods
- Monetary policy impacts: Both tokens are affected by global monetary policies, with BNB showing more stability
- Cross-border transaction demand: BNB offers significant utility for cross-border transactions through the Binance platform
III. 2025-2030 Price Prediction: FIWA vs BNB
Short-term Prediction (2025)
- FIWA: Conservative $0.0000280228 - $0.00004121 | Optimistic $0.00004121 - $0.0000572819
- BNB: Conservative $930.325 - $1094.5 | Optimistic $1094.5 - $1203.95
Mid-term Prediction (2027)
- FIWA may enter a growth phase, with estimated prices ranging from $0.000044161305662 to $0.000061825827927
- BNB may enter a consolidation phase, with estimated prices ranging from $895.246275 to $1625.5787625
- Key drivers: Institutional capital inflow, ETF, ecosystem development
Long-term Prediction (2030)
- FIWA: Base scenario $0.000062394274851 - $0.000084232271049 | Optimistic scenario $0.000084232271049+
- BNB: Base scenario $1960.091067020625 - $2469.7147444459875 | Optimistic scenario $2469.7147444459875+
Disclaimer
FIWA:
| 年份 | 预测最高价 | 预测平均价格 | 预测最低价 | 涨跌幅 |
|---|---|---|---|---|
| 2025 | 0.0000572819 | 0.00004121 | 0.0000280228 | 0 |
| 2026 | 0.0000546630045 | 0.00004924595 | 0.000037426922 | 19 |
| 2027 | 0.000061825827927 | 0.00005195447725 | 0.000044161305662 | 25 |
| 2028 | 0.000064854773951 | 0.000056890152588 | 0.000033565190027 | 37 |
| 2029 | 0.000063916086433 | 0.00006087246327 | 0.000055393941575 | 47 |
| 2030 | 0.000084232271049 | 0.000062394274851 | 0.000037436564911 | 50 |
BNB:
| 年份 | 预测最高价 | 预测平均价格 | 预测最低价 | 涨跌幅 |
|---|---|---|---|---|
| 2025 | 1203.95 | 1094.5 | 930.325 | 0 |
| 2026 | 1206.68625 | 1149.225 | 781.473 | 5 |
| 2027 | 1625.5787625 | 1177.955625 | 895.246275 | 7 |
| 2028 | 1920.4210554375 | 1401.76719375 | 784.9896285 | 28 |
| 2029 | 2259.0880094475 | 1661.09412459375 | 1378.7081234128125 | 51 |
| 2030 | 2469.7147444459875 | 1960.091067020625 | 1568.0728536165 | 79 |
IV. Investment Strategy Comparison: FIWA vs BNB
Long-term vs Short-term Investment Strategies
- FIWA: Suitable for investors focusing on gaming ecosystems and niche DeFi applications
- BNB: Suitable for investors seeking stability and ecosystem growth potential
Risk Management and Asset Allocation
- Conservative investors: FIWA: 5% vs BNB: 95%
- Aggressive investors: FIWA: 20% vs BNB: 80%
- Hedging tools: Stablecoin allocation, options, cross-currency portfolio
V. Potential Risk Comparison
Market Risk
- FIWA: Higher volatility and lower liquidity
- BNB: Exposure to overall crypto market trends and Binance ecosystem performance
Technical Risk
- FIWA: Scalability, network stability
- BNB: Centralization concerns, security vulnerabilities in the Binance Smart Chain
Regulatory Risk
- Global regulatory policies may have a more significant impact on BNB due to its higher profile and association with Binance
VI. Conclusion: Which Is the Better Buy?
📌 Investment Value Summary:
- FIWA advantages: Potential for high growth in gaming and niche DeFi sectors
- BNB advantages: Established ecosystem, wider adoption, and deflationary tokenomics
✅ Investment Advice:
- New investors: Consider a small allocation to BNB as part of a diversified crypto portfolio
- Experienced investors: Explore a balanced approach with a majority in BNB and a small speculative position in FIWA
- Institutional investors: Focus on BNB for its liquidity and established market position
⚠️ Risk Warning: The cryptocurrency market is highly volatile, and this article does not constitute investment advice. None
VII. FAQ
Q1: What are the main differences between FIWA and BNB? A: The main differences are: 1) Market cap - BNB has a much larger market cap and trading volume; 2) Ecosystem - BNB powers the Binance ecosystem while FIWA is focused on gaming and DeFi; 3) Price stability - BNB has shown more price resilience historically; 4) Adoption - BNB has wider institutional and enterprise adoption.
Q2: Which token has performed better historically? A: BNB has historically performed better, maintaining a higher price and showing more resilience. As of November 2025, BNB is trading at $1,094.2, close to its all-time high of $1,369.99, while FIWA has dropped significantly from its all-time high to $0.00004135.
Q3: What are the key factors affecting the future value of these tokens? A: Key factors include: 1) Tokenomics and supply mechanisms; 2) Institutional adoption; 3) Technical development and ecosystem growth; 4) Regulatory environment; 5) Macroeconomic factors and market cycles.
Q4: How do the supply mechanisms of FIWA and BNB compare? A: BNB features a deflationary model with regular token burns through the BNB Auto-Burn mechanism, which has historically supported price stability. FIWA relies more heavily on community-driven tokenomics with less established burning mechanisms.
Q5: What are the predicted price ranges for FIWA and BNB in 2030? A: For FIWA, the base scenario predicts a range of $0.000062394274851 - $0.000084232271049, with an optimistic scenario above $0.000084232271049. For BNB, the base scenario predicts a range of $1960.091067020625 - $2469.7147444459875, with an optimistic scenario above $2469.7147444459875.
Q6: How should investors approach allocating between FIWA and BNB? A: Conservative investors might consider allocating 5% to FIWA and 95% to BNB, while more aggressive investors could allocate 20% to FIWA and 80% to BNB. New investors may want to focus primarily on BNB due to its established position and wider adoption.
Q7: What are the main risks associated with investing in FIWA and BNB? A: Key risks include: 1) Market volatility; 2) Technical risks such as scalability and security vulnerabilities; 3) Regulatory risks, particularly for BNB due to its higher profile; 4) Ecosystem-specific risks related to adoption and competition.
Share
Content
Introduction: FIWA vs BNB Investment Comparison
I. Price History Comparison and Current Market Status
I. Impact of Core Factors on FIWA vs BNB Investment Value
III. 2025-2030 Price Prediction: FIWA vs BNB
IV. Investment Strategy Comparison: FIWA vs BNB
V. Potential Risk Comparison
VI. Conclusion: Which Is the Better Buy?
VII. FAQ

