G3 vs ICP: Comparing Two Leading AI Platforms for Enterprise Solutions
Introduction: Investment Comparison between G3 and ICP
In the cryptocurrency market, the comparison between GAM3S.GG (G3) vs Internet Computer (ICP) has been an unavoidable topic for investors. The two not only differ significantly in market cap ranking, application scenarios, and price performance but also represent different positioning in the crypto asset landscape.
GAM3S.GG (G3): Since its launch, it has gained market recognition as a web3 gaming superapp that curates and creates content for top games.
Internet Computer (ICP): Introduced in 2021, it has been hailed as the first true "World Computer" that can run online systems entirely on-the-blockchain without traditional IT infrastructure.
This article will comprehensively analyze the investment value comparison between G3 and ICP, focusing on historical price trends, supply mechanisms, institutional adoption, technological ecosystems, and future predictions, attempting to answer the question investors are most concerned about:
"Which is the better buy right now?"
I. Price History Comparison and Current Market Status
GAM3S.GG (G3) and Internet Computer (ICP) Historical Price Trends
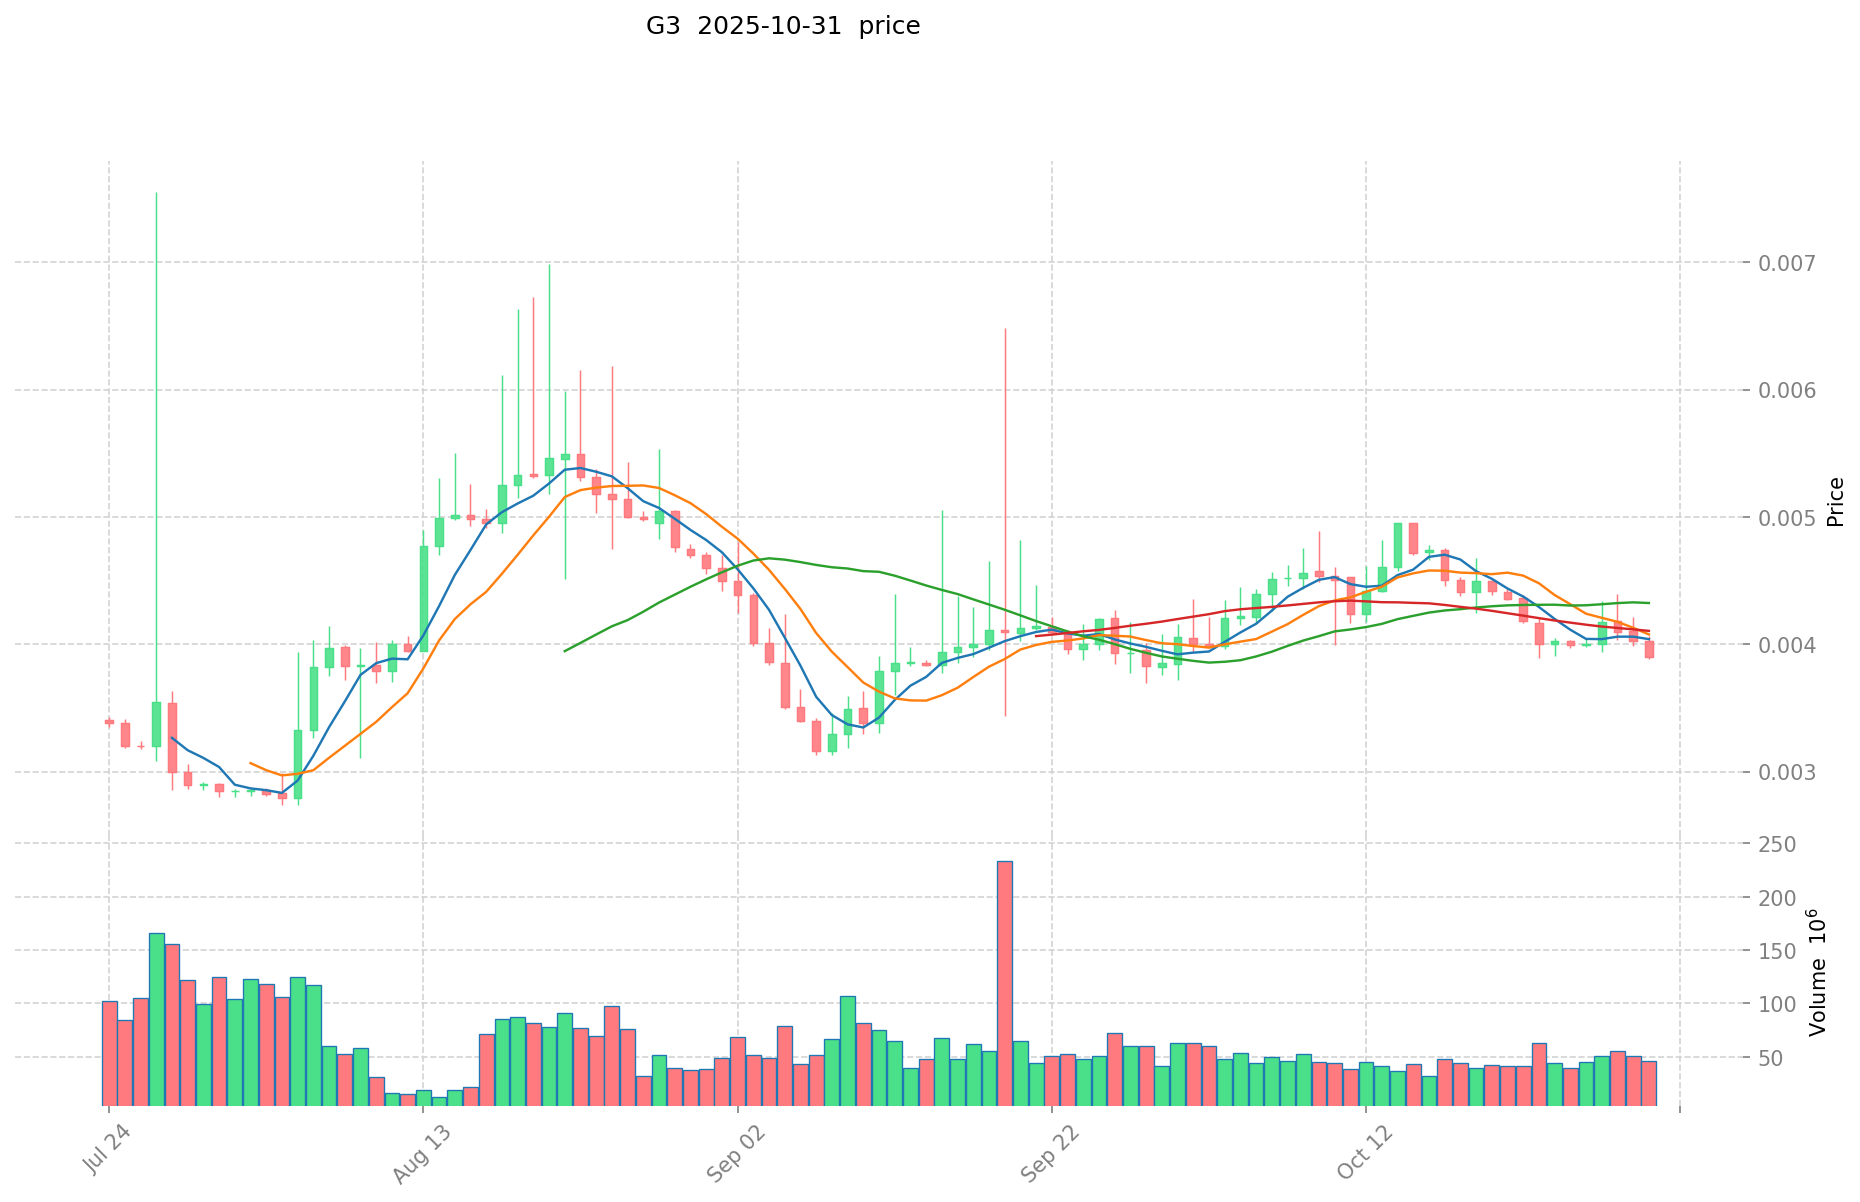
- 2024: G3 launched at $0.04, reaching an all-time high of $0.378 on April 9, 2024.
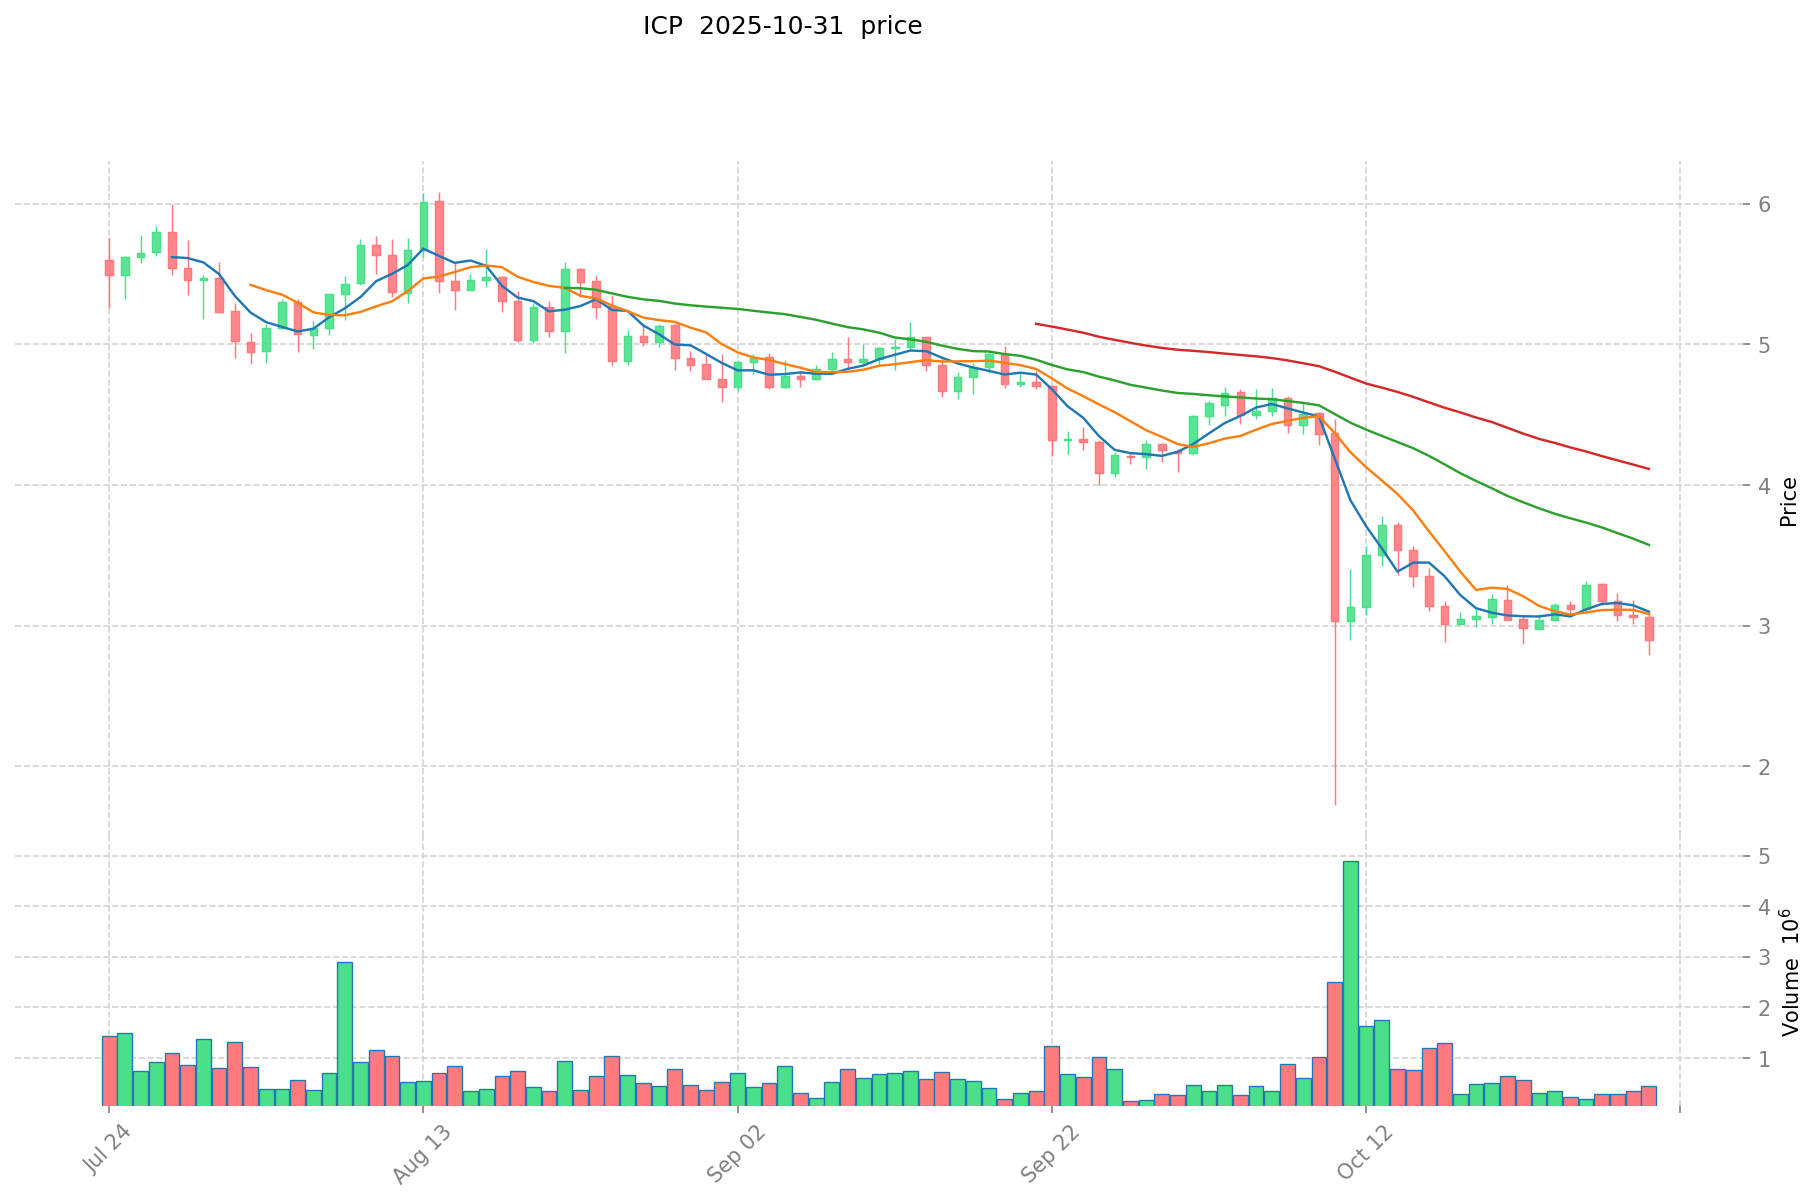
- 2021: ICP reached its all-time high of $700.65 on May 11, 2021, shortly after its launch.
- Comparative analysis: In the recent market cycle, G3 dropped from $0.378 to a low of $0.002734, while ICP declined from $700.65 to $2.23.
Current Market Situation (2025-10-31)
- G3 current price: $0.003897
- ICP current price: $2.89
- 24-hour trading volume: $183,944.70 (G3) vs $1,281,592.03 (ICP)
- Market Sentiment Index (Fear & Greed Index): 34 (Fear)
Click to view real-time prices:
- View G3 current price Market Price
- View ICP current price Market Price
Investment Value Analysis of G3 vs ICP: Core Factors
I. Investment Value Fundamentals
Basic Valuation Principles
The fundamental value of any investment depends on three core elements:
- Valuation level - Price-to-earnings ratio (P/E multiple)
- Growth potential - Net profit present value growth rate
- Risk level - Discount rate
According to the PEGR model, P/E = [(1+G)^n - 1]/G, where:
- G represents growth rate
- n represents investment recovery period
- The discount rate is the inverse of n
"All investments have a minimum return period, and this shortest return period also corresponds to the minimum return rate." - Yang Chuan, Shanghai Financial and Development Laboratory
Risk-Return Relationship
In crypto markets, as with traditional assets, higher risk must be compensated by higher potential returns. The risk-return equivalence equilibrium line demonstrates that capital naturally flows toward undervalued assets until market equilibrium is achieved.
II. Core Factors Affecting G3 vs ICP Investment Value
Technology and Innovation Assessment
- G3 Series: Represents technological evolution with enhanced distributed electric drive efficiency, demonstrated by successful implementation across multiple product lines
- ICP (Internet Computer Protocol): Focuses on decentralized computing infrastructure with smart contract capabilities
- 📌 Historical pattern: Technologies that solve real industry pain points typically achieve greater adoption and sustainable value growth
Growth Trajectory Analysis
- Growth sustainability: Assets with consistently high growth rates (>50%) rarely maintain such momentum over extended periods; assessment should focus on realistic long-term growth potential
- Market expansion potential: As baseline numbers increase, maintaining high percentage growth becomes increasingly difficult and requires exponentially larger market expansion
- Inflection point identification: Critical to recognize when growth rates begin to decline due to increased competition or market saturation
Institutional Adoption and Market Applications
- Enterprise integration: Value increases significantly when technologies are adopted by established enterprises for practical applications
- Risk perception: Market valuation is heavily influenced by institutional risk assessment; when uncertainty decreases, valuations typically improve
- Strategic partnerships: Collaborations with technology leaders (like Huawei) and major industry players signal increased adoption potential
Economic Cycle Positioning
- Investment timing: Different assets perform differently based on their position in both technological and economic cycles
- Capital patience: Extended investment horizons often yield significantly higher returns for technologies with strong fundamentals
- Market sentiment shifts: Value investments require identifying assets where market perception of risk is temporarily higher than actual fundamental risk
III. Investment Strategy Considerations
Dynamic Valuation Approach
Investment decisions should incorporate both static analysis and dynamic tracking. For example, when tracking growth rates:
"If the growth rate required to support the current price becomes unrealistic due to increased base numbers, this signals entry into momentum-driven rather than value-driven price movement."
Risk Management Framework
A balanced approach requires:
- Assessing minimum investment return rates against static investment returns plus risk-free rates
- Determining appropriate investment horizons based on risk tolerance
- Ensuring discount rates exceed capital costs
Opportunity Identification
The most promising investment opportunities often appear in:
- High-risk, high-return projects that most investors avoid due to perceived risk
- Assets where market uncertainty is temporarily elevated but fundamentals remain strong
- Technologies positioned at the beginning of new growth curves in expanding markets
IV. Conclusion
Investment value assessment for G3 and ICP must balance quantitative metrics with qualitative understanding of technological potential, market adoption dynamics, and economic positioning. The PEGR valuation model provides a structured framework for evaluation, while recognizing that true "value pockets" are typically found in assets with temporarily elevated risk perceptions but strong fundamental growth potential.
III. 2025-2030 Price Prediction: G3 vs ICP
Short-term Prediction (2025)
- G3: Conservative $0.00298144 - $0.003872 | Optimistic $0.003872 - $0.00491744
- ICP: Conservative $2.54144 - $2.888 | Optimistic $2.888 - $4.10096
Mid-term Prediction (2027)
- G3 may enter a growth phase, with estimated prices between $0.003724085728 - $0.007007161304
- ICP may enter a bullish market, with estimated prices between $2.453474408 - $5.572297808
- Key drivers: Institutional capital inflow, ETF, ecosystem development
Long-term Prediction (2030)
- G3: Base scenario $0.005024747622328 - $0.007975789876711 | Optimistic scenario $0.007975789876711 - $0.008773368864382
- ICP: Base scenario $5.30192149753266 - $5.700990857562 | Optimistic scenario $5.700990857562 - $7.86736738343556
Disclaimer: This analysis is for informational purposes only and should not be considered as financial advice. Cryptocurrency markets are highly volatile and unpredictable. Always conduct your own research before making any investment decisions.
G3:
| 年份 | 预测最高价 | 预测平均价格 | 预测最低价 | 涨跌幅 |
|---|---|---|---|---|
| 2025 | 0.00491744 | 0.003872 | 0.00298144 | 0 |
| 2026 | 0.0054055056 | 0.00439472 | 0.00329604 | 12 |
| 2027 | 0.007007161304 | 0.0049001128 | 0.003724085728 | 25 |
| 2028 | 0.00768019179708 | 0.005953637052 | 0.00577502794044 | 52 |
| 2029 | 0.009134665328883 | 0.00681691442454 | 0.004362825231705 | 74 |
| 2030 | 0.008773368864382 | 0.007975789876711 | 0.005024747622328 | 104 |
ICP:
| 年份 | 预测最高价 | 预测平均价格 | 预测最低价 | 涨跌幅 |
|---|---|---|---|---|
| 2025 | 4.10096 | 2.888 | 2.54144 | 0 |
| 2026 | 4.8223824 | 3.49448 | 1.9569088 | 20 |
| 2027 | 5.572297808 | 4.1584312 | 2.453474408 | 43 |
| 2028 | 5.5951691796 | 4.865364504 | 4.33017440856 | 68 |
| 2029 | 6.171714873324 | 5.2302668418 | 2.667436089318 | 80 |
| 2030 | 7.86736738343556 | 5.700990857562 | 5.30192149753266 | 96 |
IV. Investment Strategy Comparison: G3 vs ICP
Long-term vs Short-term Investment Strategies
- G3: Suitable for investors focused on Web3 gaming potential and content creation ecosystems
- ICP: Suitable for investors interested in decentralized computing infrastructure and long-term technological innovation
Risk Management and Asset Allocation
- Conservative investors: G3: 30% vs ICP: 70%
- Aggressive investors: G3: 60% vs ICP: 40%
- Hedging tools: Stablecoin allocation, options, cross-currency portfolio diversification
V. Potential Risk Comparison
Market Risk
- G3: High volatility due to relatively low market cap and trading volume
- ICP: Susceptibility to broader crypto market trends and sentiment shifts
Technical Risk
- G3: Scalability challenges, platform adoption rates
- ICP: Network stability, potential security vulnerabilities in smart contract implementation
Regulatory Risk
- Global regulatory policies may impact both differently, with ICP potentially facing more scrutiny due to its broader infrastructure ambitions
VI. Conclusion: Which Is the Better Buy?
📌 Investment Value Summary:
- G3 advantages: Niche focus on Web3 gaming, potential for rapid growth in a expanding sector
- ICP advantages: Established project with broader application potential, institutional backing
✅ Investment Advice:
- New investors: Consider a balanced approach, leaning towards ICP for its more established presence
- Experienced investors: Explore a strategic mix of both, with a higher allocation to G3 for potential higher returns
- Institutional investors: Focus on ICP for its infrastructure play, while keeping G3 as a growth-oriented portion of the portfolio
⚠️ Risk Warning: The cryptocurrency market is highly volatile. This article does not constitute investment advice. None
VII. FAQ
Q1: What are the main differences between G3 and ICP? A: G3 is a web3 gaming superapp focusing on content curation and creation, while ICP is a decentralized computing infrastructure project aiming to be a "World Computer". G3 has a smaller market cap and is newer, while ICP is more established with broader applications.
Q2: Which cryptocurrency has shown better price performance recently? A: Based on the provided data, G3 has shown more volatile price movements, dropping from $0.378 to $0.003897, while ICP has declined from $700.65 to $2.89. However, past performance doesn't guarantee future results.
Q3: What are the key factors to consider when investing in G3 or ICP? A: Key factors include technology and innovation assessment, growth trajectory, institutional adoption, market applications, economic cycle positioning, and risk management. Investors should also consider their own risk tolerance and investment goals.
Q4: How do the long-term price predictions for G3 and ICP compare? A: By 2030, the base scenario for G3 is predicted to be between $0.005024747622328 and $0.007975789876711, while for ICP it's between $5.30192149753266 and $5.700990857562. The optimistic scenarios are higher for both.
Q5: What are the main risks associated with investing in G3 and ICP? A: Both face market risks due to crypto volatility. G3 has higher volatility risk due to its smaller market cap. ICP may face more regulatory scrutiny. Technical risks include scalability for G3 and network stability for ICP.
Q6: How should investors allocate their portfolio between G3 and ICP? A: Conservative investors might consider 30% G3 and 70% ICP, while aggressive investors might opt for 60% G3 and 40% ICP. However, individual allocations should be based on personal risk tolerance and investment goals.
Q7: Which cryptocurrency is considered the "better buy" right now? A: There's no definitive answer as it depends on individual investment goals and risk tolerance. ICP may be more suitable for new or conservative investors due to its established presence, while G3 might appeal to those seeking higher potential returns with higher risk.
Share
Content
Introduction: Investment Comparison between G3 and ICP
I. Price History Comparison and Current Market Status
I. Investment Value Fundamentals
II. Core Factors Affecting G3 vs ICP Investment Value
III. Investment Strategy Considerations
IV. Conclusion
III. 2025-2030 Price Prediction: G3 vs ICP
IV. Investment Strategy Comparison: G3 vs ICP
V. Potential Risk Comparison
VI. Conclusion: Which Is the Better Buy?
VII. FAQ

