HAI vs KAVA: Comparing Two Promising Blockchain Platforms for DeFi Innovation
Introduction: HAI vs KAVA Investment Comparison
In the cryptocurrency market, the comparison between HAI and KAVA has always been a topic that investors can't avoid. The two not only have significant differences in market cap ranking, application scenarios, and price performance, but also represent different cryptocurrency positioning.
HAI (HAI): Since its launch, it has gained market recognition for its focus on network security consulting and blockchain security.
KAVA (KAVA): Launched in 2019, it has been hailed as a cross-chain decentralized finance platform, providing collateralized lending and stablecoin services for mainstream digital assets.
This article will comprehensively analyze the investment value comparison between HAI and KAVA, focusing on historical price trends, supply mechanisms, institutional adoption, technological ecosystems, and future predictions, and attempt to answer the question most concerning investors:
"Which is the better buy right now?"
I. Price History Comparison and Current Market Status
HAI and KAVA Historical Price Trends
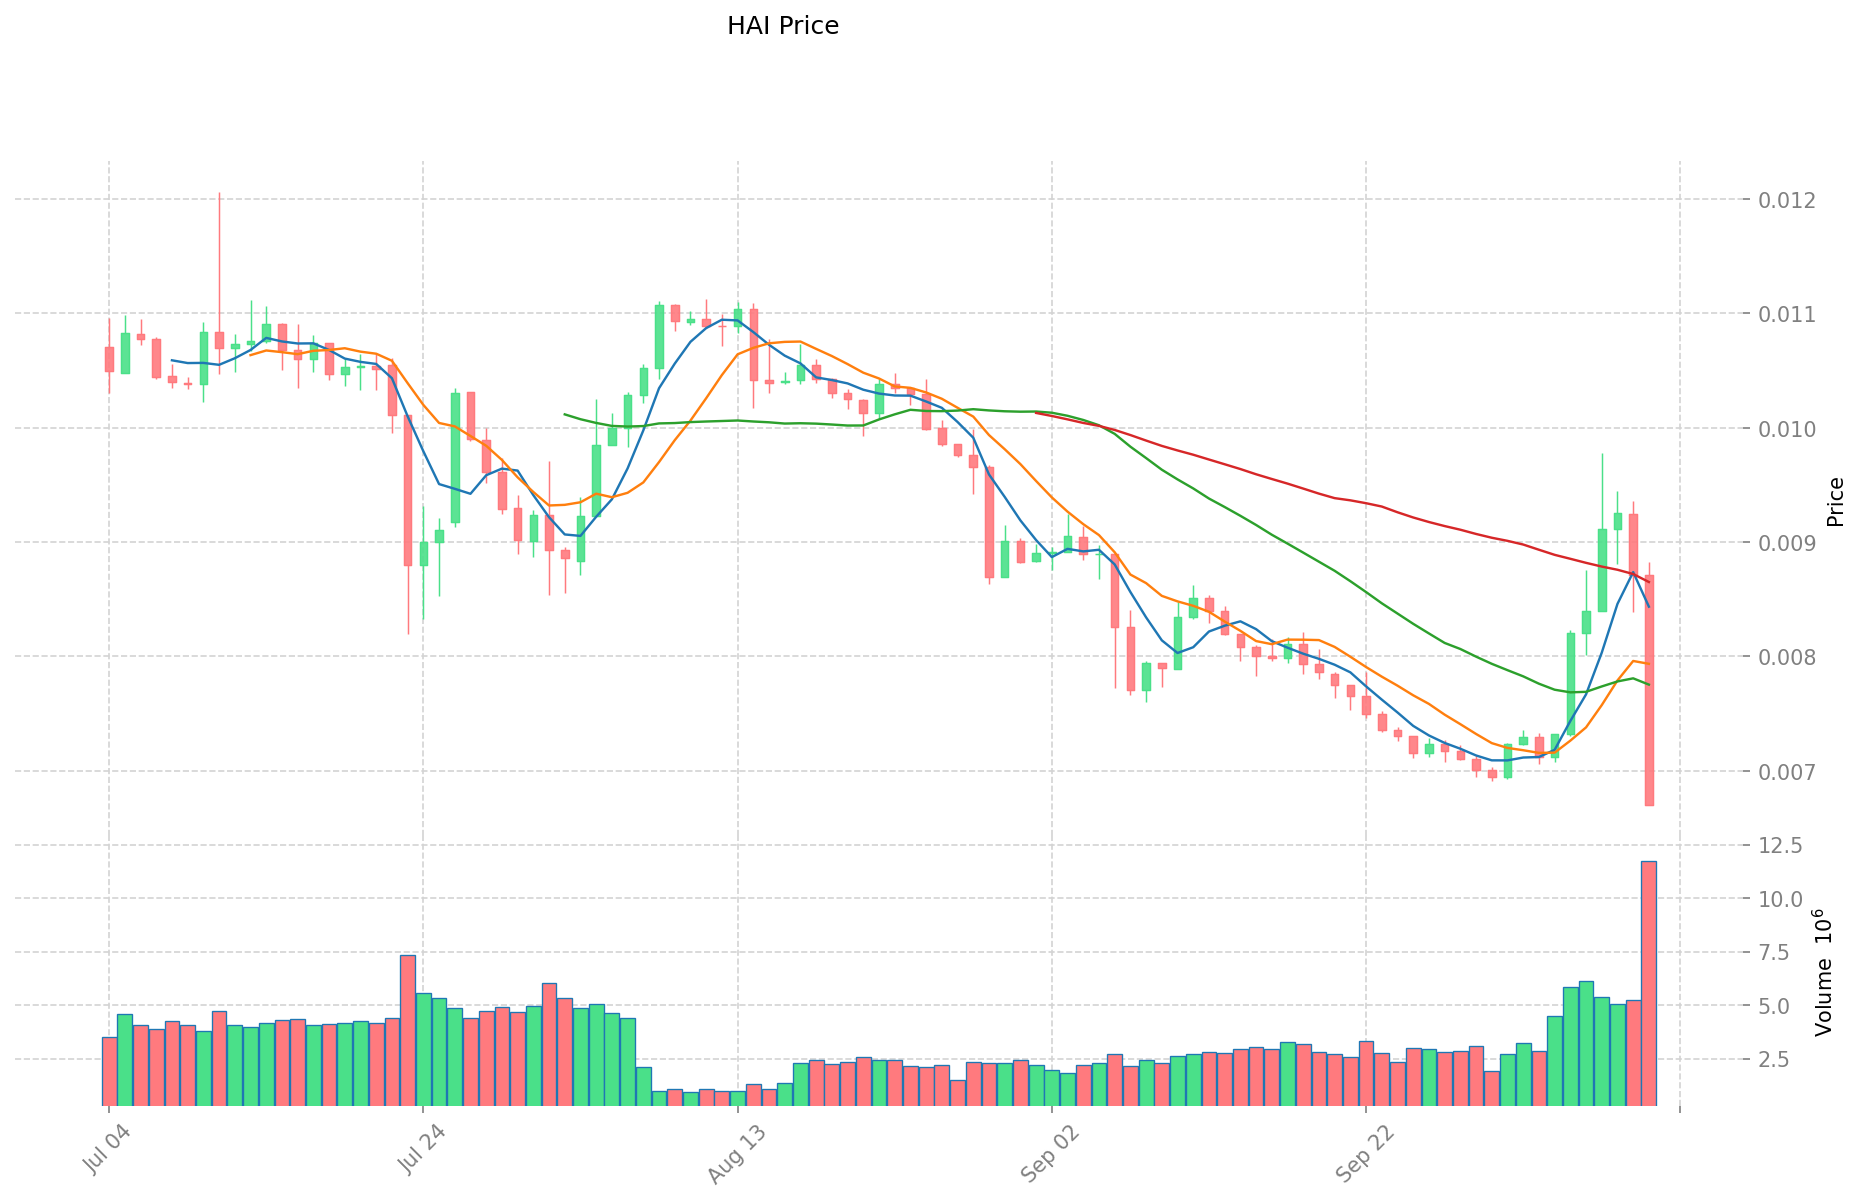
- 2021: HAI reached its all-time high of $0.465884 on April 12, 2021.
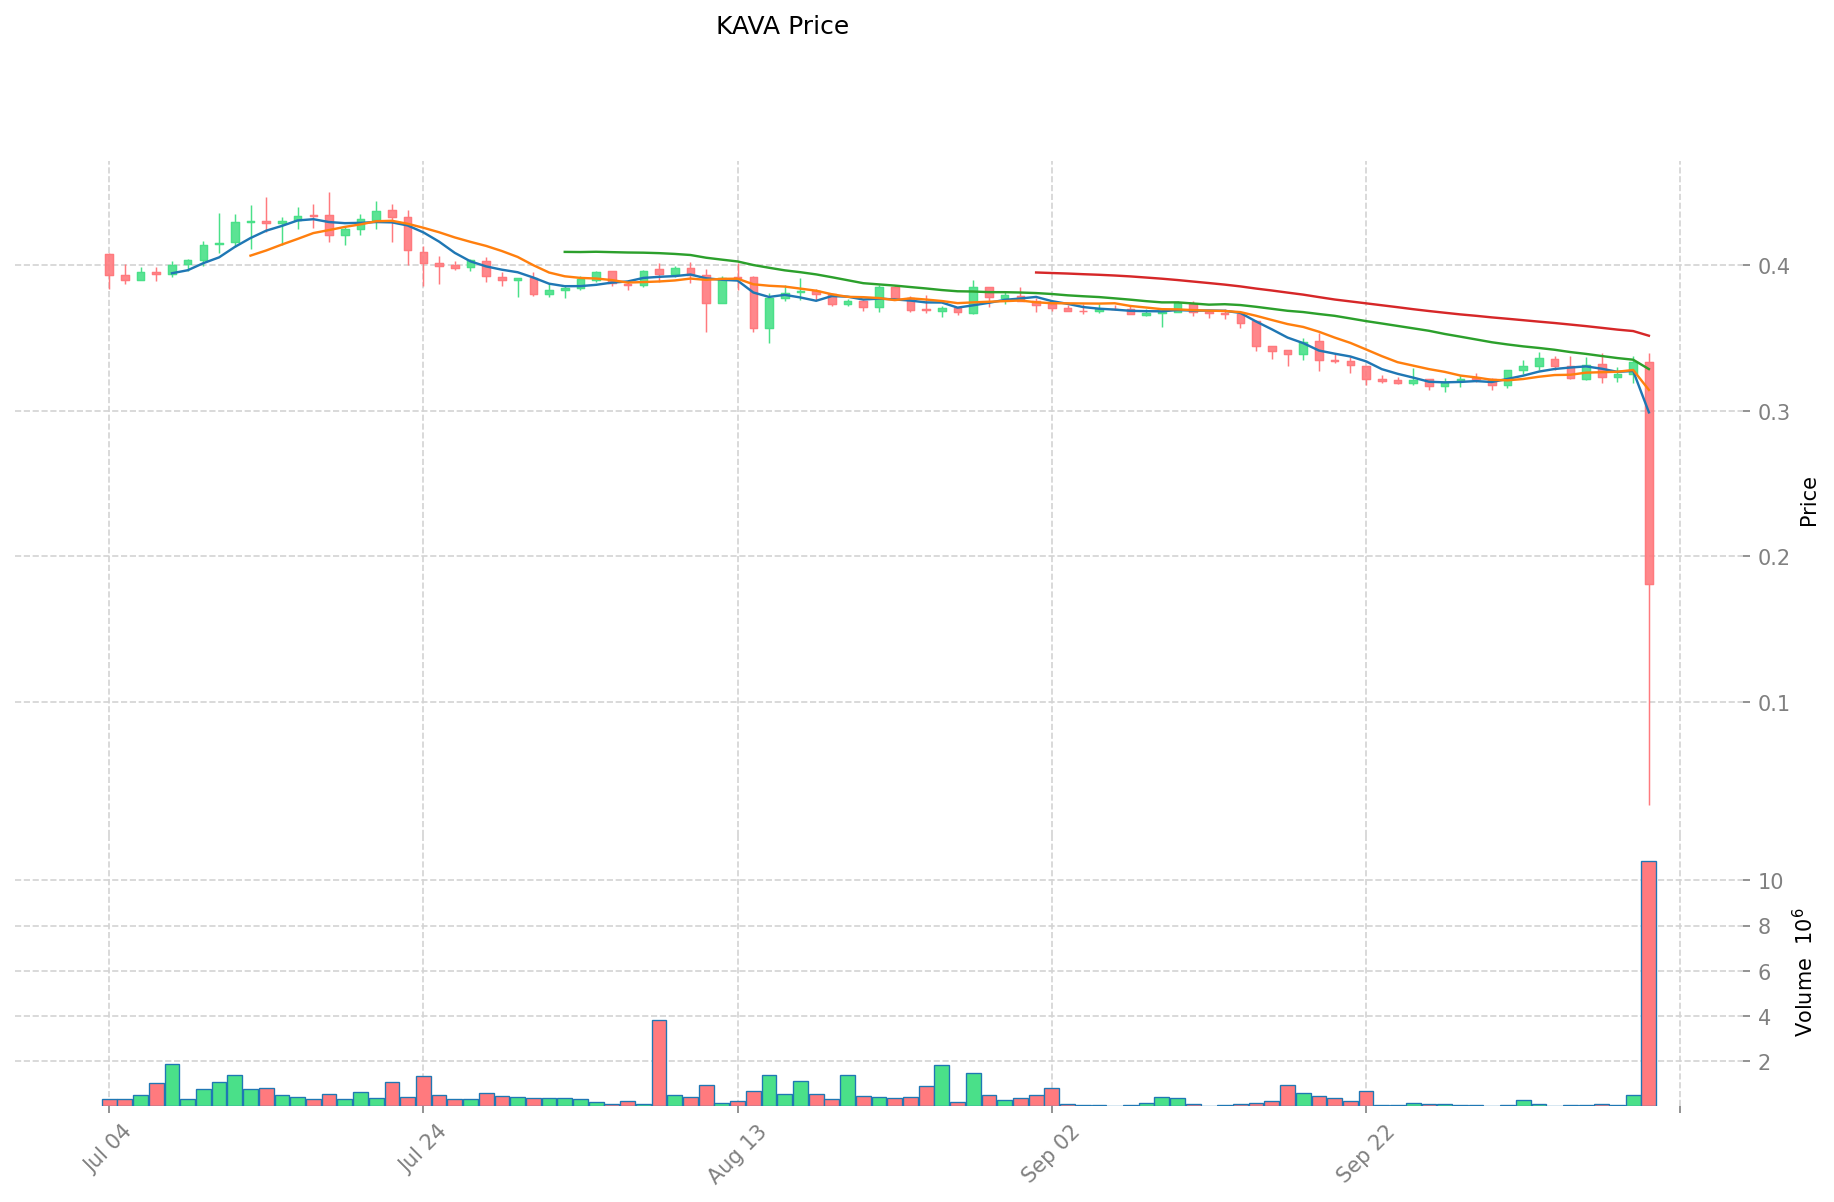
- 2021: KAVA hit its all-time high of $9.12 on August 30, 2021.
- Comparative analysis: In the current market cycle, HAI has fallen from its peak of $0.465884 to $0.0067, while KAVA has dropped from $9.12 to $0.1733.
Current Market Situation (2025-10-11)
- HAI current price: $0.0067
- KAVA current price: $0.1733
- 24-hour trading volume: HAI $94,320.69 vs KAVA $1,632,546.73
- Market Sentiment Index (Fear & Greed Index): 64 (Greed)
Click to view real-time prices:
- View HAI current price Market Price
- View KAVA current price Market Price
II. Key Factors Affecting HAI vs KAVA Investment Value
Supply Mechanism Comparison (Tokenomics)
- KAVA: Operates on Cosmos blockchain, with a supply mechanism focused on supporting its DeFi lending and stablecoin protocols
- HAI: Limited information available on specific tokenomics
Institutional Adoption and Market Applications
- Institutional Holdings: Block Oracle Capital has reported significant returns on KAVA investments as part of their Cosmos ecosystem portfolio
- Enterprise Adoption: KAVA provides cross-chain interoperability connecting over 30 blockchains through IBC, facilitating over $6.25 billion in on-chain asset transfers and $2.5 billion in bridged asset transactions
- Regulatory Approach: Limited information on specific country regulatory positions for either token
Technical Development and Ecosystem Building
- KAVA Technical Development: Built on Cosmos SDK, enabling cross-chain functionality and integration with the broader Cosmos ecosystem
- Ecosystem Comparison: KAVA enables users to lock their cryptocurrency assets to borrow USDX, a USD-pegged stablecoin, positioning it firmly in the DeFi lending sector
Macroeconomic Factors and Market Cycles
- Limited information on specific performance metrics during different economic conditions
III. 2025-2030 Price Prediction: HAI vs KAVA
Short-term Prediction (2025)
- HAI: Conservative $0.00480926 - $0.006499 | Optimistic $0.006499 - $0.00922858
- KAVA: Conservative $0.168168 - $0.1911 | Optimistic $0.1911 - $0.236964
Mid-term Prediction (2027)
- HAI may enter a growth phase, with projected prices of $0.00786379 - $0.00979041855
- KAVA may enter a bullish market, with projected prices of $0.23222472 - $0.2949253944
- Key drivers: Institutional capital inflow, ETF developments, ecosystem growth
Long-term Prediction (2030)
- HAI: Base scenario $0.010472971041038 - $0.014961387201484 | Optimistic scenario $0.014961387201484 - $0.021993239186181
- KAVA: Base scenario $0.167042669313429 - $0.30933827650635 | Optimistic scenario $0.30933827650635 - $0.43307358710889
Disclaimer: These predictions are based on historical data and current market trends. Cryptocurrency markets are highly volatile and subject to change. This information should not be considered as financial advice.
HAI:
| 年份 | 预测最高价 | 预测平均价格 | 预测最低价 | 涨跌幅 |
|---|---|---|---|---|
| 2025 | 0.00922858 | 0.006499 | 0.00480926 | -3 |
| 2026 | 0.0117170471 | 0.00786379 | 0.0057405667 | 17 |
| 2027 | 0.0140002985265 | 0.00979041855 | 0.0094967059935 | 46 |
| 2028 | 0.013679662318987 | 0.01189535853825 | 0.008802565318305 | 77 |
| 2029 | 0.017135263974349 | 0.012787510428618 | 0.011892384698615 | 90 |
| 2030 | 0.021993239186181 | 0.014961387201484 | 0.010472971041038 | 123 |
KAVA:
| 年份 | 预测最高价 | 预测平均价格 | 预测最低价 | 涨跌幅 |
|---|---|---|---|---|
| 2025 | 0.236964 | 0.1911 | 0.168168 | 10 |
| 2026 | 0.25041744 | 0.214032 | 0.13269984 | 23 |
| 2027 | 0.2949253944 | 0.23222472 | 0.17416854 | 34 |
| 2028 | 0.27675381006 | 0.2635750572 | 0.166052286036 | 52 |
| 2029 | 0.3485121193827 | 0.27016443363 | 0.2593578562848 | 55 |
| 2030 | 0.43307358710889 | 0.30933827650635 | 0.167042669313429 | 78 |
IV. Investment Strategy Comparison: HAI vs KAVA
Long-term vs Short-term Investment Strategies
- HAI: Suitable for investors focused on network security and blockchain security potential
- KAVA: Suitable for investors interested in DeFi lending and cross-chain interoperability
Risk Management and Asset Allocation
- Conservative investors: HAI: 30% vs KAVA: 70%
- Aggressive investors: HAI: 50% vs KAVA: 50%
- Hedging tools: Stablecoin allocation, options, cross-currency portfolios
V. Potential Risk Comparison
Market Risks
- HAI: Limited market liquidity and trading volume
- KAVA: Volatility in the DeFi sector and competition from other lending platforms
Technical Risks
- HAI: Network stability, scalability concerns
- KAVA: Smart contract vulnerabilities, cross-chain security issues
Regulatory Risks
- Global regulatory policies may impact both tokens differently, with potential stricter oversight on DeFi platforms affecting KAVA more directly
VI. Conclusion: Which Is the Better Buy?
📌 Investment Value Summary:
- HAI advantages: Focus on network security, potential growth in blockchain security sector
- KAVA advantages: Established DeFi lending platform, cross-chain interoperability, part of Cosmos ecosystem
✅ Investment Advice:
- Novice investors: Consider KAVA for its more established ecosystem and higher liquidity
- Experienced investors: Diversify between HAI and KAVA based on risk tolerance and sector interests
- Institutional investors: Evaluate KAVA for its DeFi potential and ecosystem integration
⚠️ Risk Warning: The cryptocurrency market is highly volatile. This article does not constitute investment advice. None
VII. FAQ
Q1: What are the main differences between HAI and KAVA? A: HAI focuses on network security consulting and blockchain security, while KAVA is a cross-chain decentralized finance platform providing collateralized lending and stablecoin services for mainstream digital assets.
Q2: How do the current prices of HAI and KAVA compare to their all-time highs? A: As of 2025-10-11, HAI has fallen from its all-time high of $0.465884 to $0.0067, while KAVA has dropped from $9.12 to $0.1733.
Q3: What are the key factors affecting the investment value of HAI and KAVA? A: Key factors include supply mechanisms, institutional adoption, market applications, technical development, ecosystem building, and macroeconomic factors.
Q4: How do the price predictions for HAI and KAVA compare for 2030? A: For 2030, HAI's base scenario predicts $0.010472971041038 - $0.014961387201484, while KAVA's base scenario predicts $0.167042669313429 - $0.30933827650635.
Q5: What are the main risks associated with investing in HAI and KAVA? A: Risks include market risks (limited liquidity for HAI, DeFi sector volatility for KAVA), technical risks (network stability, smart contract vulnerabilities), and regulatory risks.
Q6: How should investors allocate their assets between HAI and KAVA? A: Conservative investors might consider 30% HAI and 70% KAVA, while aggressive investors might opt for a 50-50 split. However, allocation should be based on individual risk tolerance and investment goals.
Q7: Which token might be more suitable for different types of investors? A: Novice investors might consider KAVA for its more established ecosystem and higher liquidity. Experienced investors could diversify between HAI and KAVA based on risk tolerance and sector interests. Institutional investors may evaluate KAVA for its DeFi potential and ecosystem integration.
Share
Content
Introduction: HAI vs KAVA Investment Comparison
I. Price History Comparison and Current Market Status
II. Key Factors Affecting HAI vs KAVA Investment Value
III. 2025-2030 Price Prediction: HAI vs KAVA
IV. Investment Strategy Comparison: HAI vs KAVA
V. Potential Risk Comparison
VI. Conclusion: Which Is the Better Buy?
VII. FAQ

