K21 vs ETC: Comparing Two Cryptocurrency Mining Algorithms for Efficiency and Profitability
Introduction: K21 vs ETC Investment Comparison
In the cryptocurrency market, the comparison between K21 and ETC has always been an unavoidable topic for investors. The two not only have significant differences in market cap ranking, application scenarios, and price performance, but also represent different positions in crypto assets.
K21 (K21): Since its launch in 2021, it has gained market recognition for its focus on art and technology integration.
Ethereum Classic (ETC): Launched in 2016, it has been hailed as a decentralized platform for smart contracts, being one of the cryptocurrencies with high global trading volume and market capitalization.
This article will comprehensively analyze the investment value comparison between K21 and ETC, focusing on historical price trends, supply mechanisms, institutional adoption, technological ecosystems, and future predictions, and attempt to answer the question investors care most about:
"Which is the better buy right now?"
I. Price History Comparison and Current Market Status
K21 (Coin A) and ETC (Coin B) Historical Price Trends
- 2021: K21 reached its all-time high of $11.59 on March 27, 2021.
- 2021: ETC hit its all-time high of $167.09 on May 7, 2021, during the broader cryptocurrency bull market.
- Comparative analysis: Since their respective all-time highs, K21 has dropped from $11.59 to $0.0294, while ETC has declined from $167.09 to $14.065, both experiencing significant corrections in the current market cycle.
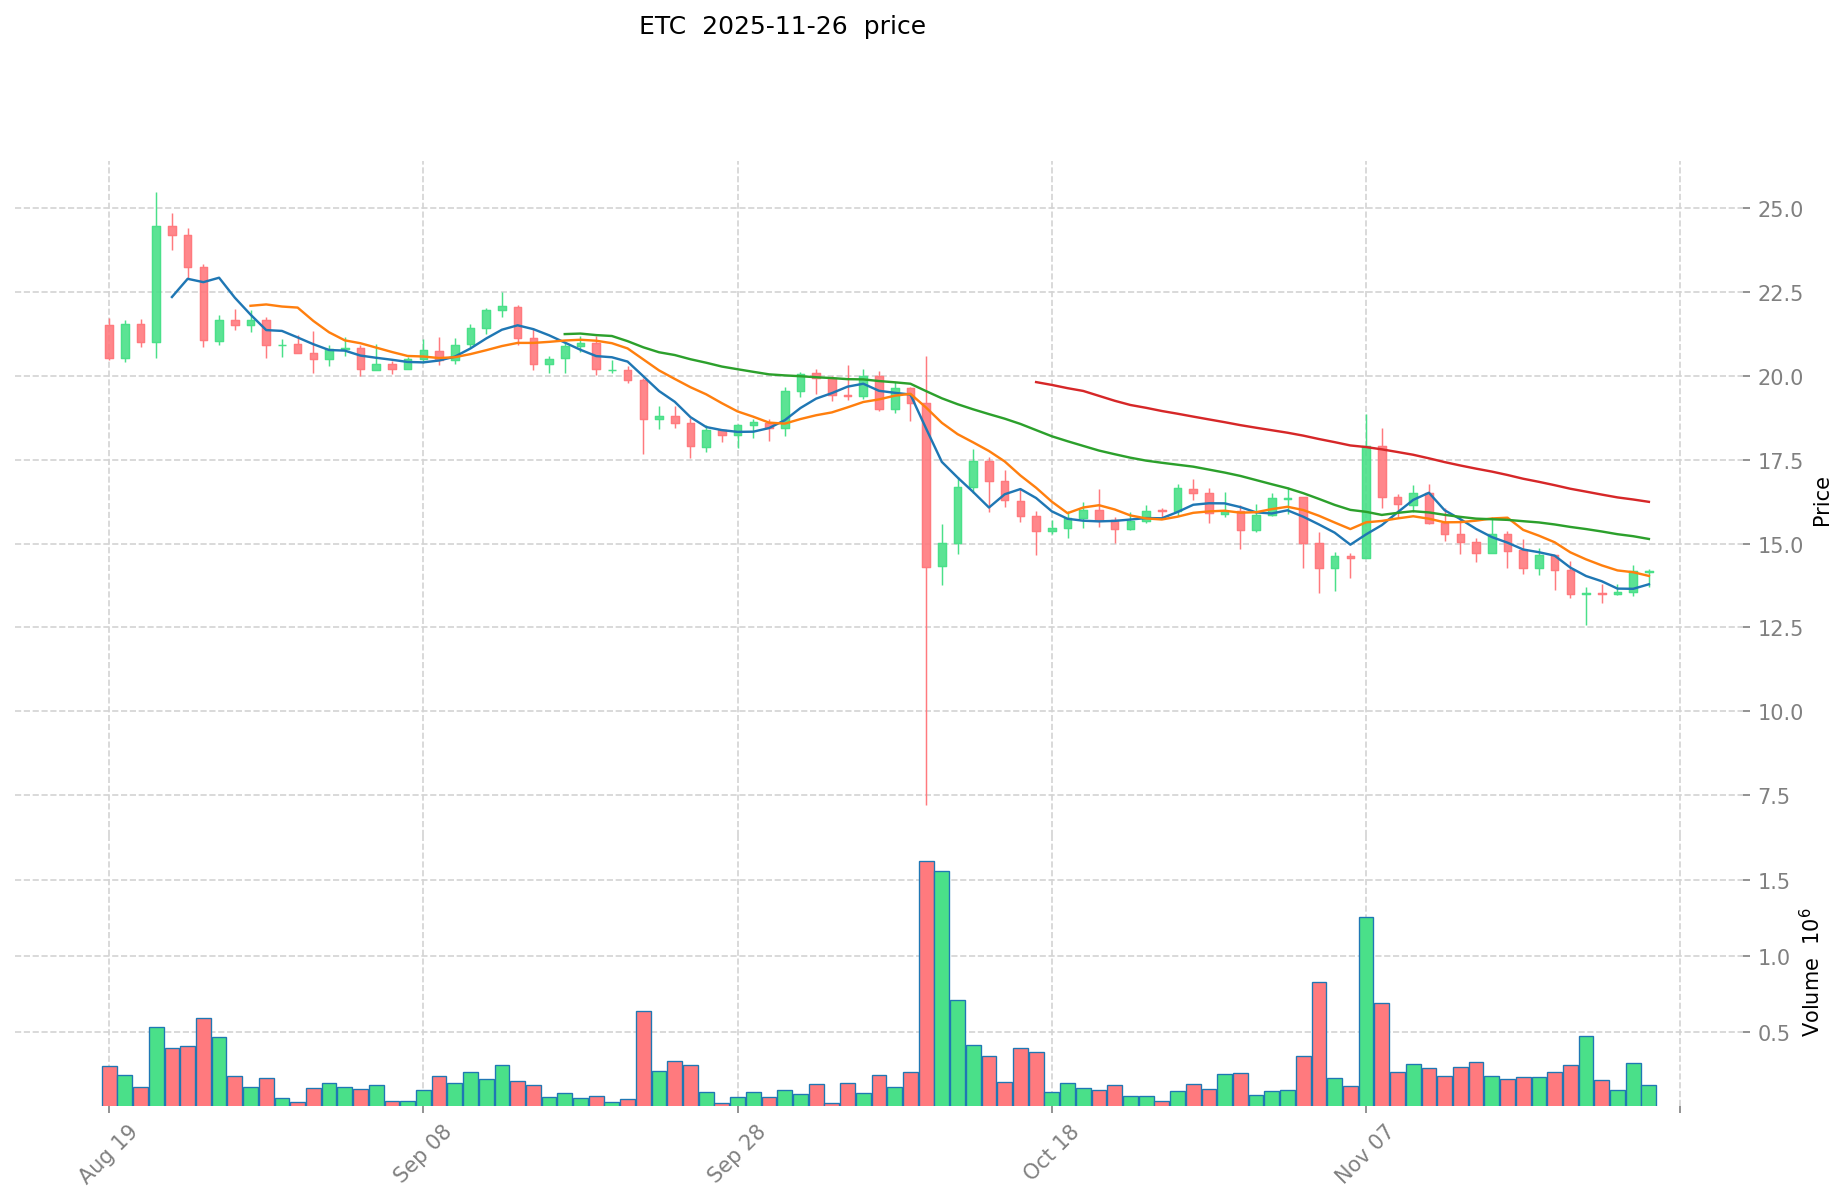
Current Market Situation (2025-11-27)
- K21 current price: $0.0294
- ETC current price: $14.065
- 24-hour trading volume: K21 $12,033.95 vs ETC $2,597,875.02
- Market Sentiment Index (Fear & Greed Index): 20 (Extreme Fear)
Click to view real-time prices:
- View K21 current price Market Price
- View ETC current price Market Price

II. Core Factors Affecting Investment Value: K21 vs ETC
Supply Mechanisms Comparison (Tokenomics)
-
K21: Fixed supply model with a total cap of 21 million tokens, mimicking Bitcoin's supply mechanism
-
ETC: Deflationary model with a maximum supply cap of approximately 210.7 million coins and declining block rewards
-
📌 Historical Pattern: Fixed supply mechanisms like K21's tend to create scarcity value over time, while ETC's larger but deflationary supply has historically shown less price appreciation potential during bull markets.
Institutional Adoption and Market Applications
- Institutional Holdings: ETC has broader institutional recognition through legacy exchange listings and investment products, while K21 has minimal institutional presence
- Enterprise Adoption: ETC has established integration with certain enterprise solutions focused on immutable smart contracts, while K21 remains primarily a speculative asset
- Regulatory Stance: ETC benefits from clearer regulatory status as an established blockchain network, whereas K21 faces uncertainty as a newer token
Technical Development and Ecosystem Building
- K21 Technical Upgrades: Limited technical development beyond basic ERC-20 functionality
- ETC Technical Development: Ongoing maintenance and security enhancements following historical security incidents, with commitment to preserving original Ethereum principles
- Ecosystem Comparison: ETC maintains an active developer community and supports smart contracts, while K21 lacks a comparable ecosystem and primarily exists as a store of value token
Macroeconomic Factors and Market Cycles
- Performance in Inflationary Environments: ETC has demonstrated some correlation with broader crypto market during inflationary periods, while K21's fixed supply could theoretically serve as an inflation hedge though lacks historical data
- Macroeconomic Monetary Policy: Both assets show sensitivity to Federal Reserve policies and interest rate changes, with high correlation to overall crypto market movements
- Geopolitical Factors: ETC benefits from wider global recognition and liquidity in cross-border transactions, while K21 has limited global presence
III. 2025-2030 Price Prediction: K21 vs ETC
Short-term Prediction (2025)
- K21: Conservative $0.0199036 - $0.02927 | Optimistic $0.02927 - $0.0360021
- ETC: Conservative $8.4276 - $14.046 | Optimistic $14.046 - $16.8552
Mid-term Prediction (2027)
- K21 may enter a growth phase, with estimated prices ranging from $0.0280017309 to $0.0473875446
- ETC may enter a steady growth phase, with estimated prices ranging from $14.14038912 to $17.6754864
- Key drivers: Institutional capital inflow, ETFs, ecosystem development
Long-term Prediction (2030)
- K21: Base scenario $0.0544698285384 - $0.07353426852684 | Optimistic scenario $0.07353426852684+
- ETC: Base scenario $21.42497929572 - $23.567477225292 | Optimistic scenario $23.567477225292+
Disclaimer: This analysis is based on historical data and current market trends. Cryptocurrency markets are highly volatile and unpredictable. This information should not be considered as financial advice. Always conduct your own research before making investment decisions.
K21:
| 年份 | 预测最高价 | 预测平均价格 | 预测最低价 | 涨跌幅 |
|---|---|---|---|---|
| 2025 | 0.0360021 | 0.02927 | 0.0199036 | 0 |
| 2026 | 0.03916326 | 0.03263605 | 0.0283933635 | 11 |
| 2027 | 0.0473875446 | 0.035899655 | 0.0280017309 | 22 |
| 2028 | 0.05830103972 | 0.0416435998 | 0.02290397989 | 41 |
| 2029 | 0.0589673373168 | 0.04997231976 | 0.0279844990656 | 69 |
| 2030 | 0.07353426852684 | 0.0544698285384 | 0.038673578262264 | 85 |
ETC:
| 年份 | 预测最高价 | 预测平均价格 | 预测最低价 | 涨跌幅 |
|---|---|---|---|---|
| 2025 | 16.8552 | 14.046 | 8.4276 | 0 |
| 2026 | 16.686648 | 15.4506 | 13.13301 | 9 |
| 2027 | 17.6754864 | 16.068624 | 14.14038912 | 14 |
| 2028 | 22.439833416 | 16.8720552 | 13.666364712 | 19 |
| 2029 | 23.19401428344 | 19.655944308 | 12.38324491404 | 39 |
| 2030 | 23.567477225292 | 21.42497929572 | 14.7832357140468 | 52 |
IV. Investment Strategy Comparison: K21 vs ETC
Long-term vs Short-term Investment Strategies
- K21: Suitable for investors focused on art and technology integration, speculative potential
- ETC: Suitable for investors seeking established smart contract platforms, relative stability
Risk Management and Asset Allocation
- Conservative investors: K21: 5% vs ETC: 15%
- Aggressive investors: K21: 15% vs ETC: 30%
- Hedging tools: Stablecoin allocation, options, cross-currency portfolios
V. Potential Risk Comparison
Market Risk
- K21: High volatility, low liquidity, limited market presence
- ETC: Susceptible to overall crypto market trends, historical security incidents
Technical Risk
- K21: Limited technical development, ecosystem scalability
- ETC: Network stability, potential for 51% attacks
Regulatory Risk
- Global regulatory policies may have differing impacts on both assets, with ETC potentially facing less scrutiny due to its established status
VI. Conclusion: Which Is the Better Buy?
📌 Investment Value Summary:
- K21 advantages: Fixed supply model, potential for art and technology integration
- ETC advantages: Established smart contract platform, broader institutional recognition, active developer community
✅ Investment Advice:
- Novice investors: Consider ETC for its more established market presence and clearer use case
- Experienced investors: Diversify between both, with a larger allocation to ETC
- Institutional investors: Focus primarily on ETC due to its liquidity and regulatory clarity
⚠️ Risk Warning: The cryptocurrency market is highly volatile. This article does not constitute investment advice. None
VII. FAQ
Q1: What are the main differences between K21 and ETC? A: K21 is a newer token focused on art and technology integration with a fixed supply of 21 million tokens, while ETC is an established smart contract platform with a deflationary supply model and a maximum cap of about 210.7 million coins.
Q2: Which cryptocurrency has shown better price performance historically? A: ETC has shown better historical price performance, reaching an all-time high of $167.09 in May 2021, compared to K21's all-time high of $11.59 in March 2021.
Q3: How do the supply mechanisms of K21 and ETC differ? A: K21 has a fixed supply model with a total cap of 21 million tokens, similar to Bitcoin. ETC has a deflationary model with a maximum supply cap of approximately 210.7 million coins and declining block rewards.
Q4: Which cryptocurrency has better institutional adoption? A: ETC has broader institutional recognition through legacy exchange listings and investment products, while K21 has minimal institutional presence.
Q5: What are the long-term price predictions for K21 and ETC by 2030? A: For K21, the base scenario predicts $0.0544698285384 - $0.07353426852684, with an optimistic scenario above $0.07353426852684. For ETC, the base scenario predicts $21.42497929572 - $23.567477225292, with an optimistic scenario above $23.567477225292.
Q6: How should investors allocate their portfolio between K21 and ETC? A: Conservative investors might consider allocating 5% to K21 and 15% to ETC, while aggressive investors might allocate 15% to K21 and 30% to ETC.
Q7: Which cryptocurrency is considered a better buy for different types of investors? A: Novice investors may consider ETC for its more established market presence and clearer use case. Experienced investors might diversify between both, with a larger allocation to ETC. Institutional investors may focus primarily on ETC due to its liquidity and regulatory clarity.
Share
Content
Introduction: K21 vs ETC Investment Comparison
I. Price History Comparison and Current Market Status
II. Core Factors Affecting Investment Value: K21 vs ETC
III. 2025-2030 Price Prediction: K21 vs ETC
IV. Investment Strategy Comparison: K21 vs ETC
V. Potential Risk Comparison
VI. Conclusion: Which Is the Better Buy?
VII. FAQ

