ROA vs LTC: Evaluating Investment Strategies for Long-Term Financial Success
Introduction: ROA vs LTC Investment Comparison
In the cryptocurrency market, the comparison between ROA and LTC has always been a topic that investors can't ignore. The two not only show significant differences in market cap ranking, application scenarios, and price performance, but also represent different positioning in crypto assets.
ROA CORE (ROA): Since its launch, it has gained market recognition for its NFT-based physical art tech platform.
Litecoin (LTC): Since its inception in 2011, it has been hailed as the "silver to Bitcoin's gold" and is one of the cryptocurrencies with the highest global trading volume and market capitalization.
This article will comprehensively analyze the investment value comparison between ROA and LTC, focusing on historical price trends, supply mechanisms, institutional adoption, technological ecosystems, and future predictions, and attempt to answer the question that investors are most concerned about:
"Which is the better buy right now?"
I. Price History Comparison and Current Market Status
ROA and LTC Historical Price Trends
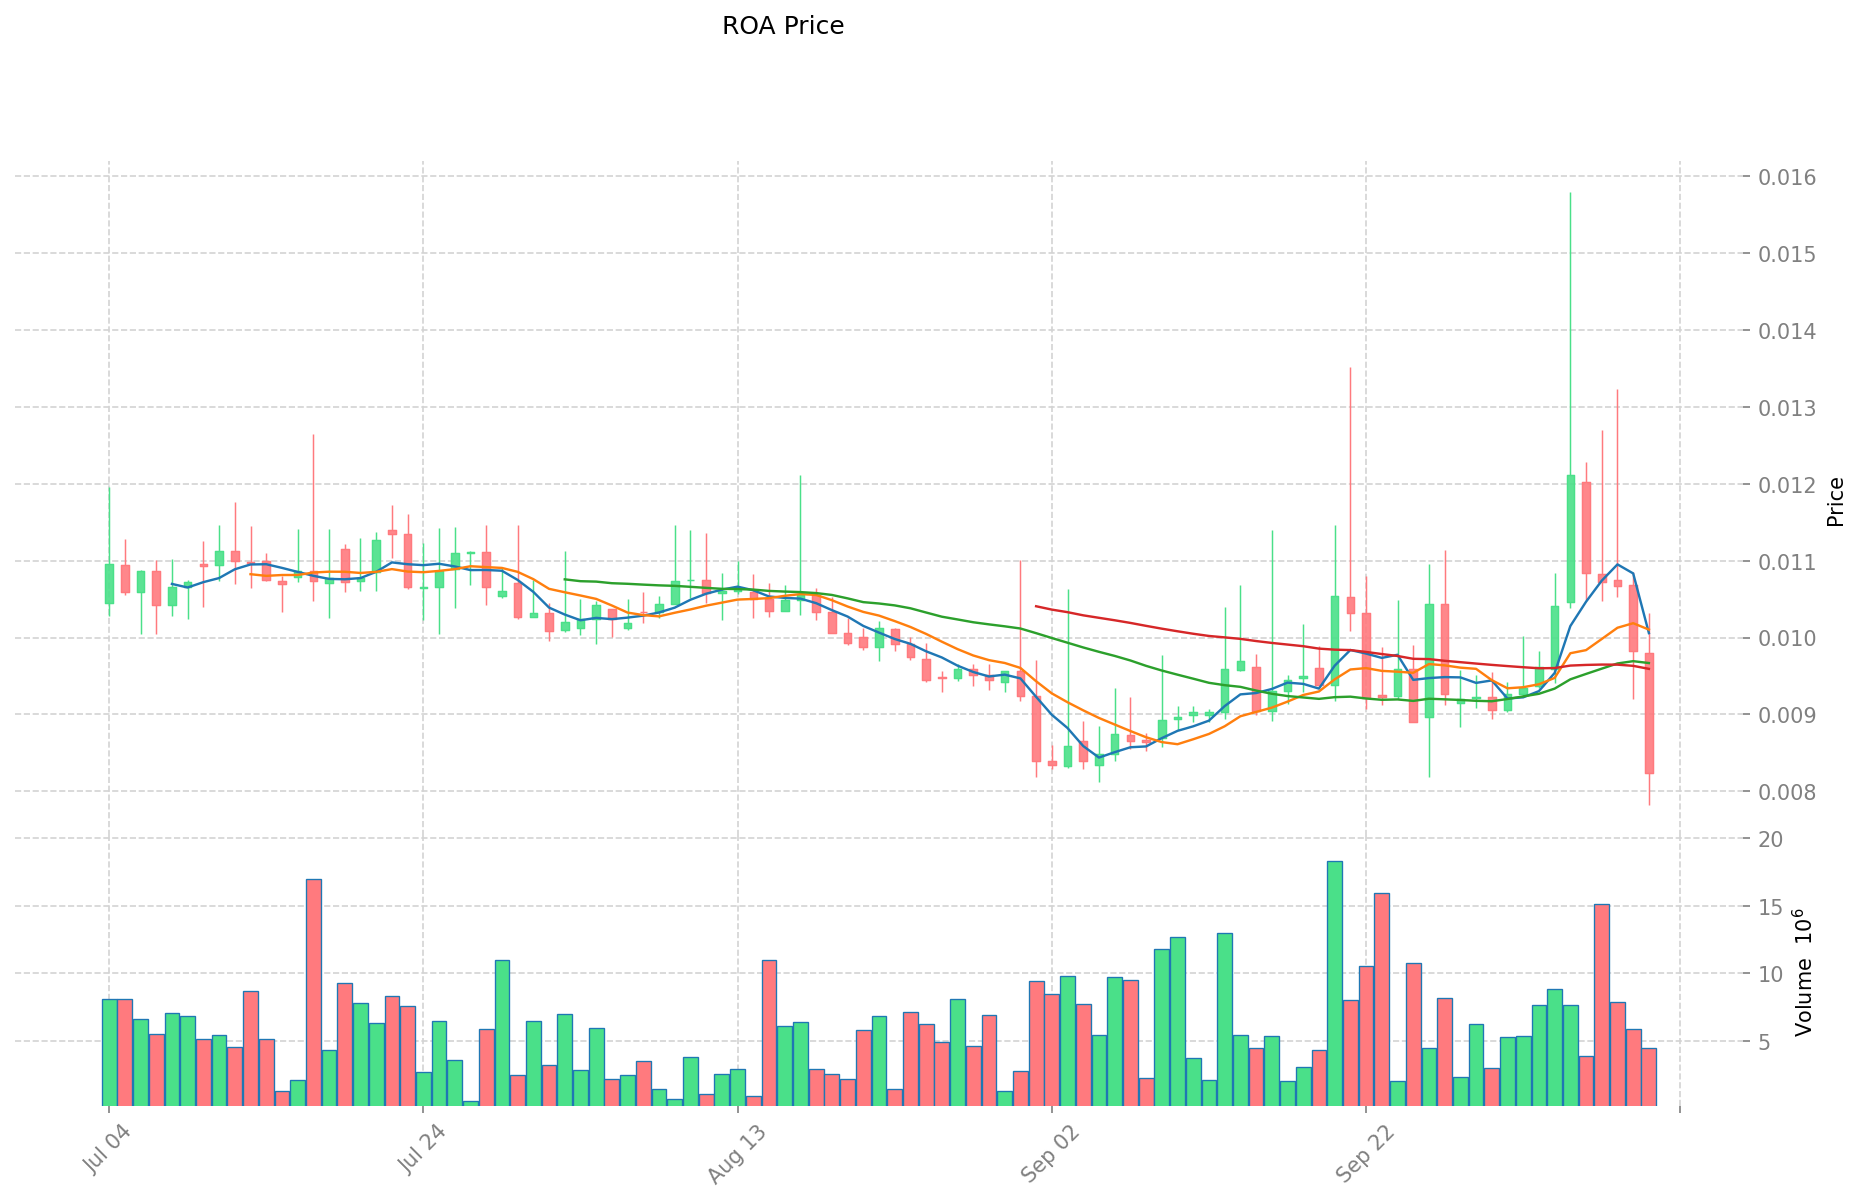
- 2023: ROA reached its all-time high of $0.1785 on December 22, 2023.
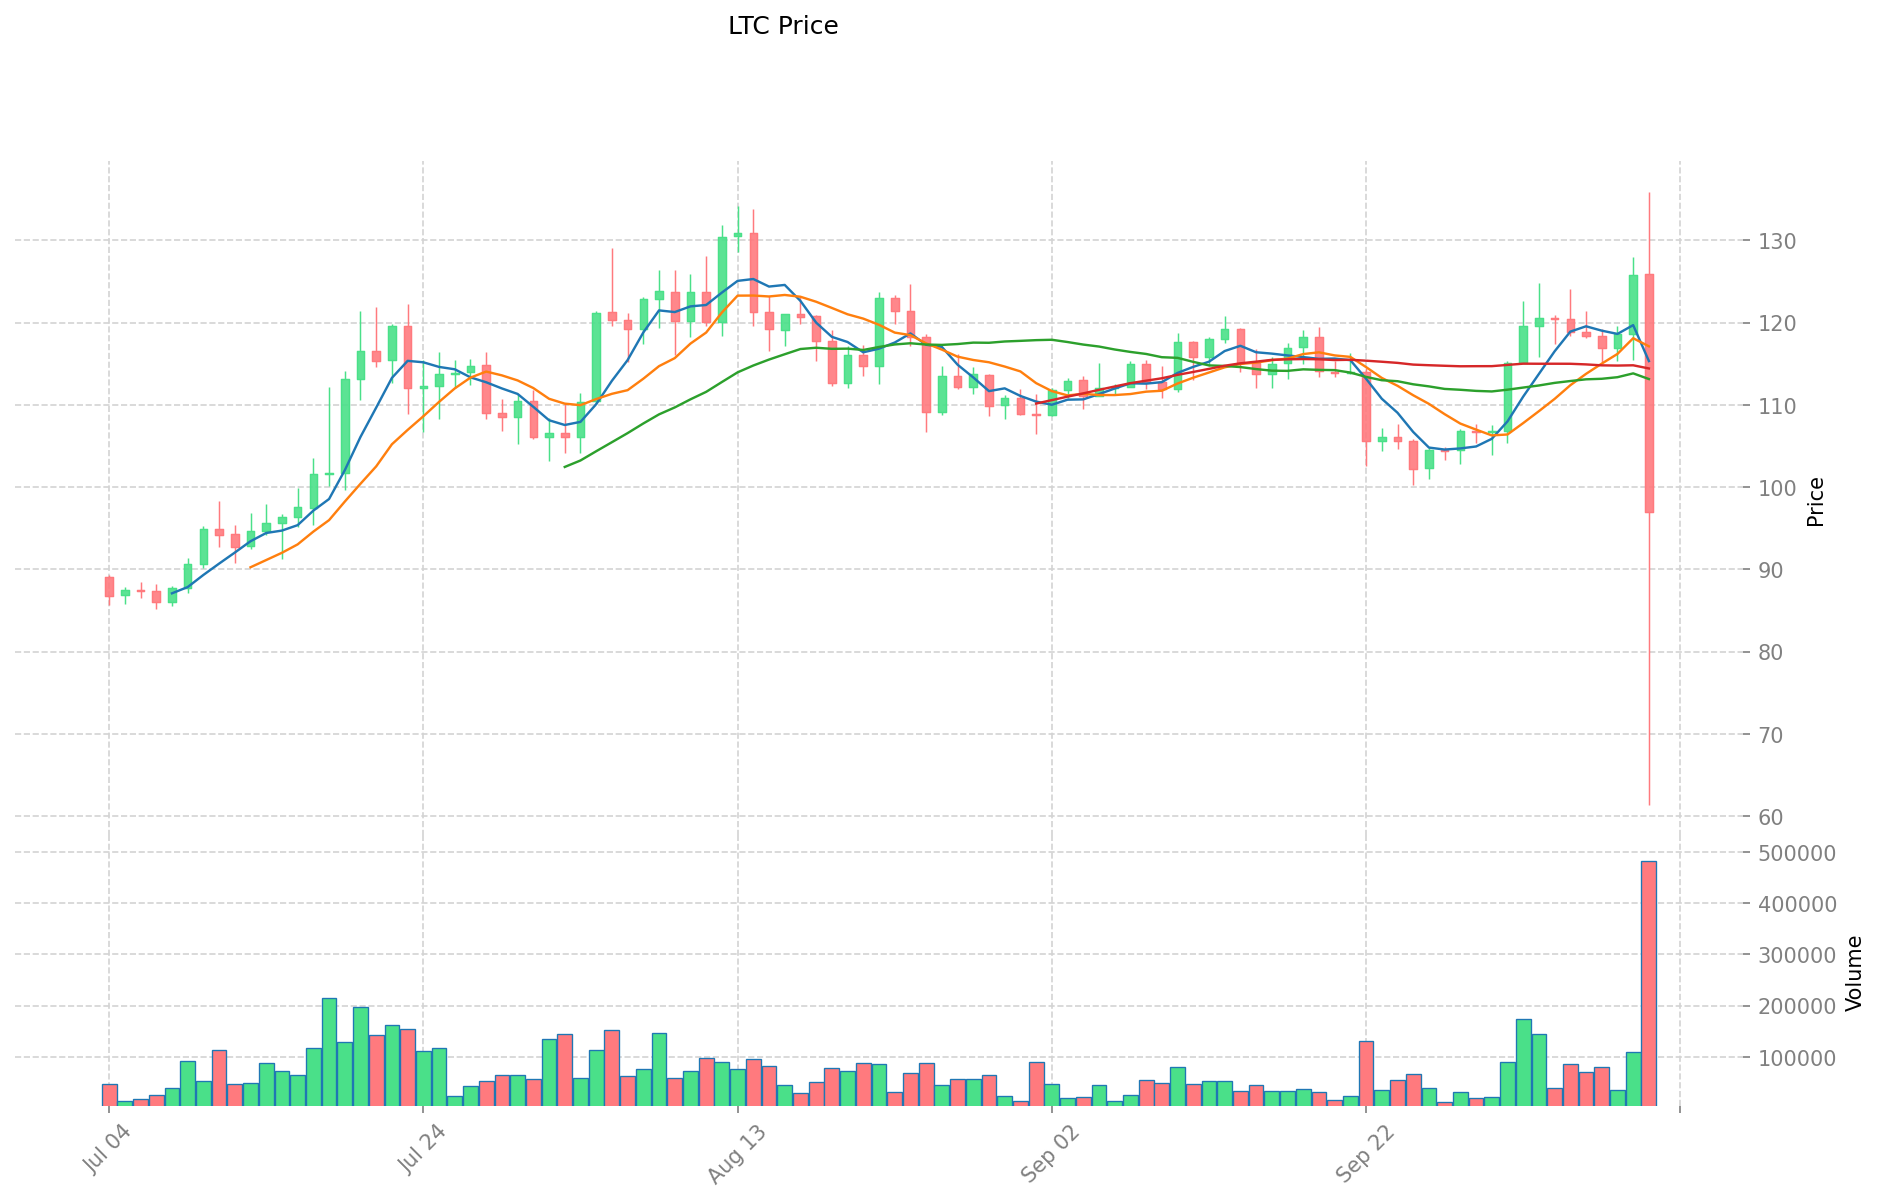
- 2021: LTC hit its all-time high of $410.26 on May 10, 2021, during the bull market.
- Comparative analysis: In the recent market cycle, ROA dropped from its high of $0.1785 to a low of $0.007817, while LTC has shown more resilience, currently trading at $96.87.
Current Market Situation (2025-10-11)
- ROA current price: $0.00827
- LTC current price: $96.87
- 24-hour trading volume: ROA $46,225.13 vs LTC $56,874,348.57
- Market Sentiment Index (Fear & Greed Index): 27 (Fear)
Click to view real-time prices:
- Check ROA current price Market Price
- Check LTC current price Market Price
II. Core Factors Influencing ROA vs LTC Investment Value
Supply Mechanism Comparison (Tokenomics)
- LTC: Uses a halving mechanism similar to Bitcoin, with block rewards reduced every 4 years, creating scarcity over time
- ROA CORE: Operates with high-efficiency global trading focus
- 📌 Historical Pattern: Supply mechanisms drive price cycles, with LTC typically following Bitcoin's price patterns after halving events.
Institutional Adoption and Market Applications
- Institutional Holdings: LTC has longer market presence and is available on more traditional trading platforms
- Enterprise Adoption: LTC offers advantages for cross-border transfers due to faster block generation (4x faster than Bitcoin) and extremely low transaction fees (under $0.01)
- Regulatory Attitudes: LTC benefits from broader regulatory acceptance as one of the earliest cryptocurrencies
Technical Development and Ecosystem Building
- LTC Technical Development: Implemented SegWit, Lightning Network support, and MWEB (Mimblewimble Extension Block) privacy features that enhance transaction efficiency and privacy
- ROA CORE Technical Features: Emphasizes security and global trading capabilities
- Ecosystem Comparison: LTC has established payment solutions and broader merchant acceptance, while ROA focuses on trading functionality
Macroeconomic Factors and Market Cycles
- Inflation Environment Performance: Some investors view LTC as a potential hedge during economic uncertainty
- Monetary Policy Impact: Interest rates, USD index fluctuations significantly affect crypto market capital flows, including both assets
- Geopolitical Factors: Both are influenced by cross-border transaction demands and international market sentiment
III. 2025-2030 Price Predictions: ROA vs LTC
Short-term Forecast (2025)
- ROA: Conservative $0.00759 - $0.00825 | Optimistic $0.00825 - $0.0086625
- LTC: Conservative $89.3504 - $97.12 | Optimistic $97.12 - $129.1696
Mid-term Forecast (2027)
- ROA may enter a growth phase, with prices expected in the range of $0.0063130134375 - $0.0123254071875
- LTC may enter a bullish market, with prices expected in the range of $113.18440068 - $171.87260844
- Key drivers: Institutional capital inflow, ETF developments, ecosystem growth
Long-term Forecast (2030)
- ROA: Base scenario $0.014953985652375 - $0.019440181348087 | Optimistic scenario $0.019440181348087+
- LTC: Base scenario $104.60978628531795 - $166.047279817965 | Optimistic scenario $176.0101166070429+
Disclaimer: The above predictions are based on historical data and market analysis. Cryptocurrency markets are highly volatile and subject to change. This information should not be considered as financial advice. Always conduct your own research before making investment decisions.
ROA:
| 年份 | 预测最高价 | 预测平均价格 | 预测最低价 | 涨跌幅 |
|---|---|---|---|---|
| 2025 | 0.0086625 | 0.00825 | 0.00759 | 0 |
| 2026 | 0.0115850625 | 0.00845625 | 0.005412 | 2 |
| 2027 | 0.0123254071875 | 0.01002065625 | 0.0063130134375 | 21 |
| 2028 | 0.015530514089062 | 0.01117303171875 | 0.010390919498437 | 35 |
| 2029 | 0.016556198400843 | 0.013351772903906 | 0.007476992826187 | 61 |
| 2030 | 0.019440181348087 | 0.014953985652375 | 0.008673311678377 | 80 |
LTC:
| 年份 | 预测最高价 | 预测平均价格 | 预测最低价 | 涨跌幅 |
|---|---|---|---|---|
| 2025 | 129.1696 | 97.12 | 89.3504 | 0 |
| 2026 | 166.322856 | 113.1448 | 92.778736 | 16 |
| 2027 | 171.87260844 | 139.733828 | 113.18440068 | 44 |
| 2028 | 160.4773147666 | 155.80321822 | 112.1783171184 | 60 |
| 2029 | 173.95429314263 | 158.1402664933 | 118.605199869975 | 63 |
| 2030 | 176.0101166070429 | 166.047279817965 | 104.60978628531795 | 71 |
IV. Investment Strategy Comparison: ROA vs LTC
Long-term vs Short-term Investment Strategies
- ROA: Suitable for investors focused on global trading and potential ecosystem growth
- LTC: Suitable for investors seeking established networks, payment solutions, and potential inflation hedge
Risk Management and Asset Allocation
- Conservative investors: ROA: 10% vs LTC: 90%
- Aggressive investors: ROA: 30% vs LTC: 70%
- Hedging tools: Stablecoin allocation, options, cross-currency portfolio
V. Potential Risk Comparison
Market Risks
- ROA: Higher volatility, lower liquidity, and potential for sharp price swings
- LTC: Susceptible to broader crypto market trends and Bitcoin price movements
Technical Risks
- ROA: Scalability, network stability
- LTC: Mining centralization, potential security vulnerabilities
Regulatory Risks
- Global regulatory policies may have different impacts on both assets, with LTC potentially facing less scrutiny due to its longer market presence
VI. Conclusion: Which Is the Better Buy?
📌 Investment Value Summary:
- ROA advantages: Focus on global trading, potential for growth in emerging markets
- LTC advantages: Established network, wider adoption, proven track record, and technical improvements
✅ Investment Advice:
- Novice investors: Consider a larger allocation to LTC due to its established market presence and lower volatility
- Experienced investors: Balanced approach with a tilt towards LTC, but include ROA for potential high-growth opportunities
- Institutional investors: Primarily LTC for its liquidity and market acceptance, with a small allocation to ROA for diversification
⚠️ Risk Warning: Cryptocurrency markets are highly volatile. This article does not constitute investment advice. None
VII. FAQ
Q1: What are the main differences between ROA and LTC? A: ROA focuses on global trading and NFT-based physical art tech, while LTC is an established cryptocurrency with faster transactions and lower fees compared to Bitcoin. LTC has wider adoption and a longer market presence.
Q2: Which cryptocurrency has shown better price performance recently? A: LTC has shown more resilience in the recent market cycle. While ROA dropped from its high of $0.1785 to $0.00827, LTC is currently trading at $96.87, maintaining a stronger position relative to its all-time high.
Q3: How do the supply mechanisms of ROA and LTC differ? A: LTC uses a halving mechanism similar to Bitcoin, reducing block rewards every 4 years to create scarcity. ROA CORE operates with a focus on high-efficiency global trading, but specific details of its supply mechanism are not provided in the context.
Q4: What are the key factors influencing the investment value of ROA and LTC? A: Key factors include supply mechanisms, institutional adoption, technical development, ecosystem building, macroeconomic factors, and market cycles. LTC generally has advantages in institutional adoption and ecosystem development.
Q5: What are the price predictions for ROA and LTC by 2030? A: For ROA, the base scenario predicts a range of $0.014953985652375 - $0.019440181348087. For LTC, the base scenario predicts a range of $104.60978628531795 - $166.047279817965. Both have potential for higher prices in optimistic scenarios.
Q6: How should investors allocate their portfolio between ROA and LTC? A: Conservative investors might consider allocating 10% to ROA and 90% to LTC, while aggressive investors might allocate 30% to ROA and 70% to LTC. The exact allocation depends on individual risk tolerance and investment goals.
Q7: What are the main risks associated with investing in ROA and LTC? A: ROA faces higher volatility, lower liquidity, and potential scalability issues. LTC is susceptible to broader crypto market trends, potential mining centralization, and security vulnerabilities. Both face regulatory risks, though LTC may face less scrutiny due to its longer market presence.
Share
Content
Introduction: ROA vs LTC Investment Comparison
I. Price History Comparison and Current Market Status
II. Core Factors Influencing ROA vs LTC Investment Value
III. 2025-2030 Price Predictions: ROA vs LTC
IV. Investment Strategy Comparison: ROA vs LTC
V. Potential Risk Comparison
VI. Conclusion: Which Is the Better Buy?
VII. FAQ

