SPON vs XTZ: Comparing Two Emerging Cryptocurrencies in the DeFi Landscape
Introduction: SPON vs XTZ Investment Comparison
In the cryptocurrency market, the comparison between Spheron Network (SPON) and Tezos (XTZ) has been an unavoidable topic for investors. The two not only show significant differences in market cap ranking, application scenarios, and price performance, but also represent different positions in the crypto asset landscape.
Spheron Network (SPON): Since its launch in 2025, it has gained market recognition for its decentralized computing infrastructure and AI-focused ecosystem.
Tezos (XTZ): Introduced in 2017, it has been hailed as a self-amending blockchain platform, becoming one of the cryptocurrencies with significant global trading volume and market capitalization.
This article will comprehensively analyze the investment value comparison between SPON and XTZ, focusing on historical price trends, supply mechanisms, institutional adoption, technological ecosystems, and future predictions, attempting to answer the question most concerning to investors:
"Which is the better buy right now?"
I. Price History Comparison and Current Market Status
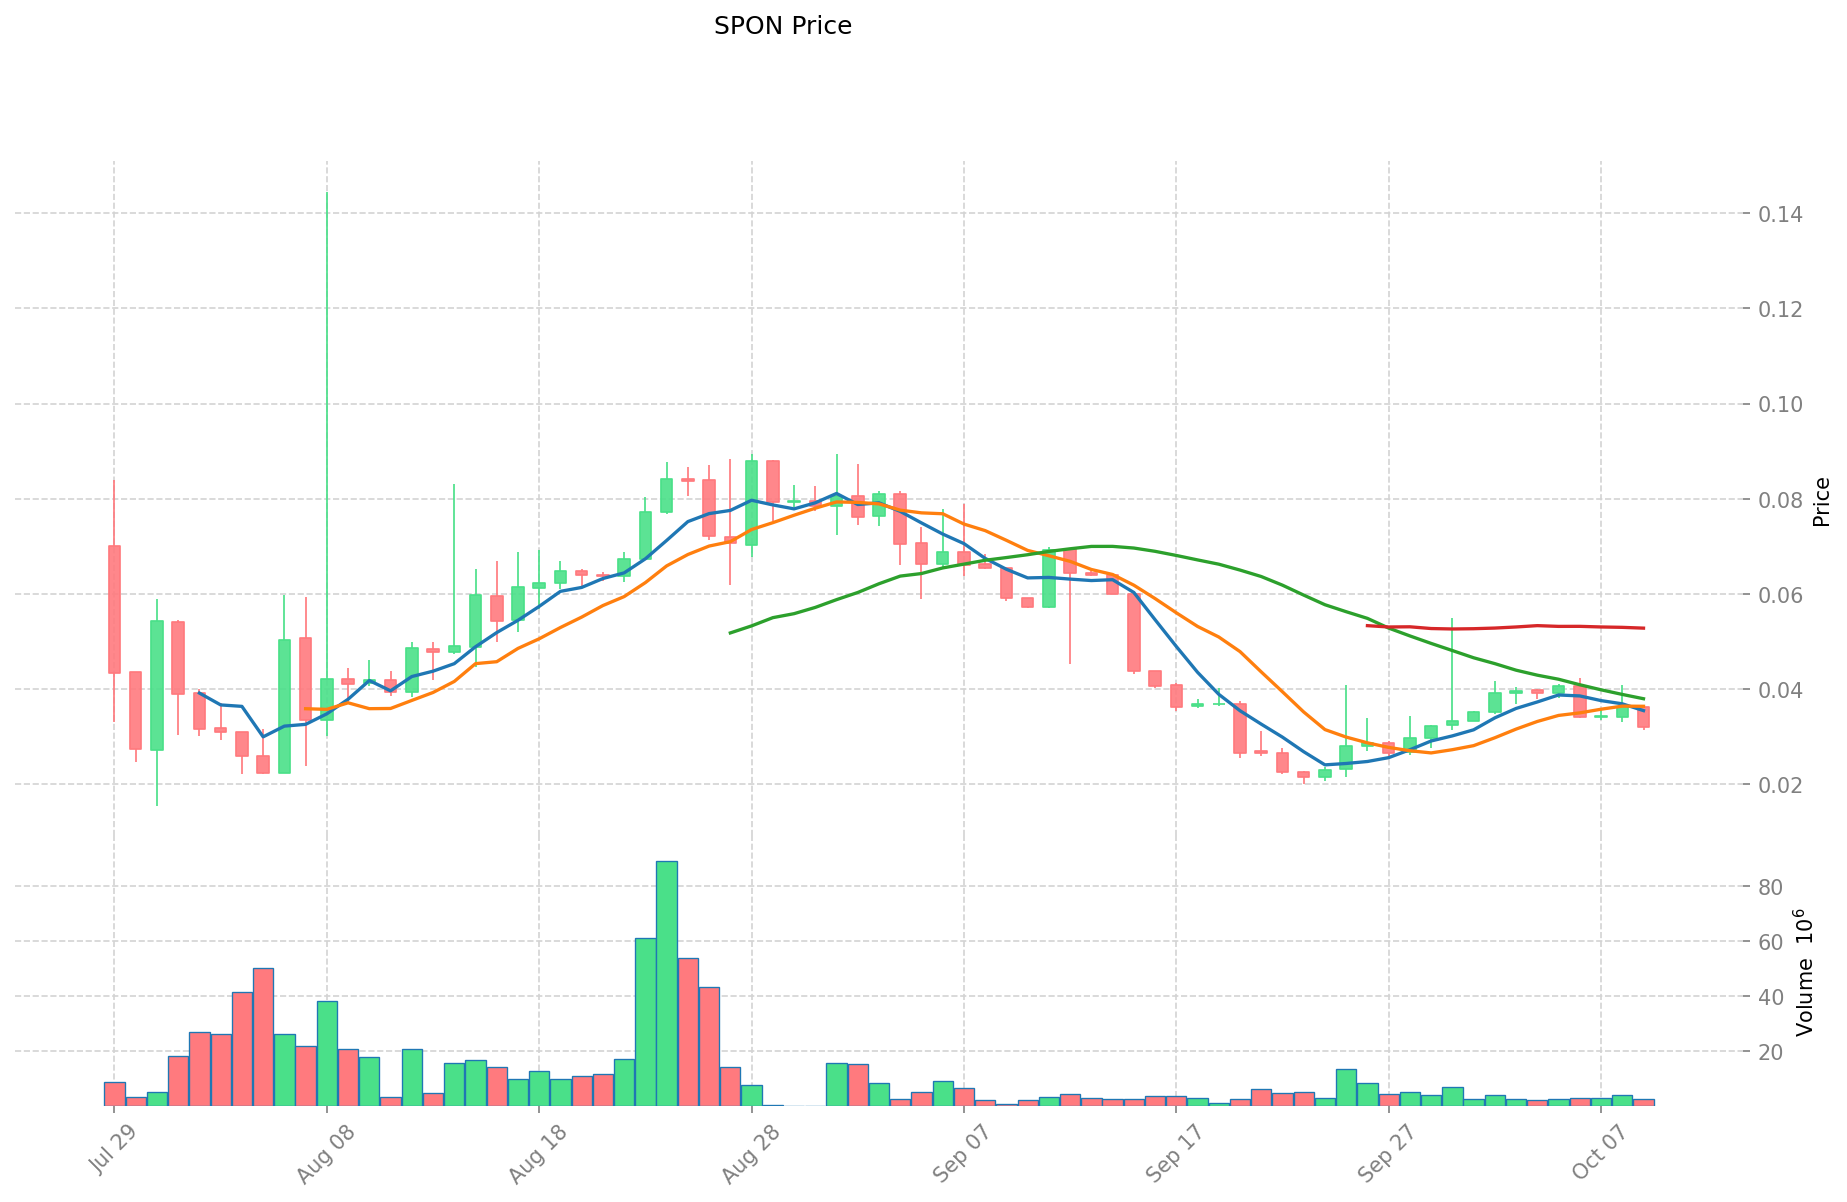
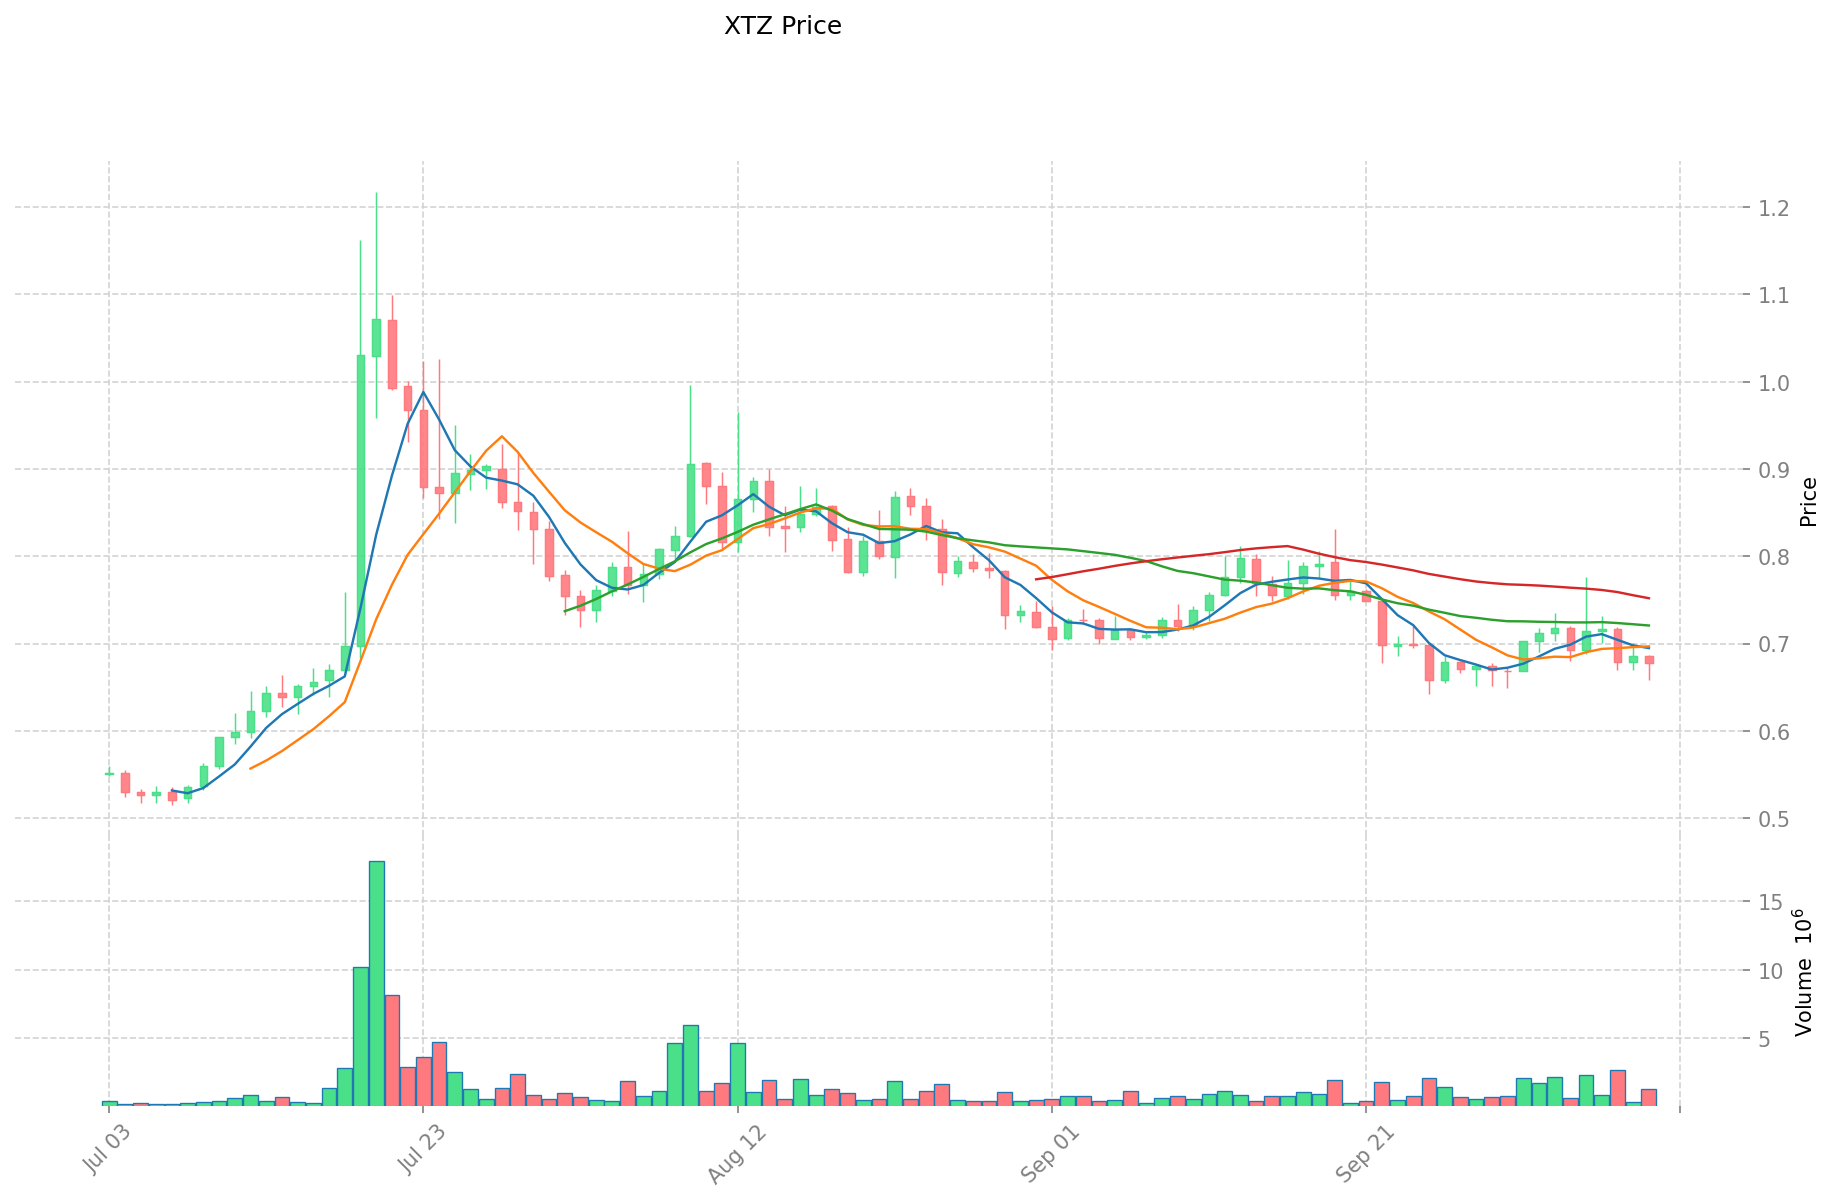
SPON (Coin A) and XTZ (Coin B) Historical Price Trends
- 2025: SPON reached its all-time high of $0.1445 on August 8, 2025.
- 2021: XTZ hit its all-time high of $9.12 on October 4, 2021.
- Comparative analysis: In recent market cycles, SPON dropped from its high of $0.1445 to a low of $0.01553, while XTZ has experienced a significant decline from its all-time high of $9.12 to current levels.
Current Market Situation (2025-10-10)
- SPON current price: $0.03203
- XTZ current price: $0.6766
- 24-hour trading volume: SPON $90,363.14 vs XTZ $924,640.73
- Market Sentiment Index (Fear & Greed Index): 70 (Greed)
Click to view real-time prices:
- View SPON current price Market Price
- View XTZ current price Market Price
II. Key Factors Affecting Investment Value of SPON vs XTZ
Supply Mechanism Comparison (Tokenomics)
- SPON: Fixed supply with a maximum cap of 29,999,999 tokens
- XTZ (Tezos): Inflationary model with new tokens created through baking (staking) process
- 📌 Historical pattern: Fixed supply tokens like SPON tend to experience higher price volatility during market cycles, while inflationary models like XTZ can provide more stability but may face dilution pressure.
Institutional Adoption and Market Applications
- Institutional holdings: XTZ has more established institutional support with adoption from multiple enterprise clients
- Enterprise adoption: XTZ is used in various enterprise applications including tokenization of assets, while SPON is focusing on brand loyalty programs
- Regulatory stance: Both tokens operate in uncertain regulatory environments, though Tezos has generally pursued a more compliant approach from inception
Technical Development and Ecosystem Building
- SPON technical development: Built on the Ethereum blockchain with focus on brand engagement applications
- XTZ technical development: Self-amending blockchain with on-chain governance allowing for upgrades without hard forks
- Ecosystem comparison: XTZ has a more developed ecosystem spanning DeFi, NFT marketplaces, and enterprise applications, while SPON focuses specifically on brand engagement and loyalty programs
Macroeconomic Factors and Market Cycles
- Performance in inflationary environments: Fixed-supply SPON may theoretically offer better inflation resistance
- Macroeconomic monetary policy: Both tokens show correlation with broader risk assets and are affected by changes in interest rates and dollar strength
- Geopolitical factors: XTZ's more established global presence may provide better resilience to regional regulatory changes
III. Price Prediction 2025-2030: SPON vs XTZ
Short-term Prediction (2025)
- SPON: Conservative $0.017578 - $0.03196 | Optimistic $0.03196 - $0.043146
- XTZ: Conservative $0.58812 - $0.676 | Optimistic $0.676 - $0.9464
Mid-term Prediction (2027)
- SPON may enter a growth phase, with expected prices $0.02830557375 - $0.062525745
- XTZ may enter a bullish market, with expected prices $0.54342288 - $1.22738616
- Key drivers: Institutional capital inflow, ETF, ecosystem development
Long-term Prediction (2030)
- SPON: Base scenario $0.07067715878025 - $0.094000621177732 | Optimistic scenario $0.094000621177732+
- XTZ: Base scenario $1.532015440956 - $2.11418130851928 | Optimistic scenario $2.11418130851928+
Disclaimer: This analysis is based on historical data and market projections. Cryptocurrency markets are highly volatile and unpredictable. This information should not be construed as financial advice. Always conduct your own research before making investment decisions.
SPON:
| 年份 | 预测最高价 | 预测平均价格 | 预测最低价 | 涨跌幅 |
|---|---|---|---|---|
| 2025 | 0.043146 | 0.03196 | 0.017578 | 0 |
| 2026 | 0.04694125 | 0.037553 | 0.03567535 | 17 |
| 2027 | 0.062525745 | 0.042247125 | 0.02830557375 | 31 |
| 2028 | 0.0743887377 | 0.052386435 | 0.04033755495 | 63 |
| 2029 | 0.0779667312105 | 0.06338758635 | 0.0526116966705 | 97 |
| 2030 | 0.094000621177732 | 0.07067715878025 | 0.040285980504742 | 120 |
XTZ:
| 年份 | 预测最高价 | 预测平均价格 | 预测最低价 | 涨跌幅 |
|---|---|---|---|---|
| 2025 | 0.9464 | 0.676 | 0.58812 | 0 |
| 2026 | 1.062672 | 0.8112 | 0.746304 | 19 |
| 2027 | 1.22738616 | 0.936936 | 0.54342288 | 38 |
| 2028 | 1.5366687336 | 1.08216108 | 0.757512756 | 59 |
| 2029 | 1.754615975112 | 1.3094149068 | 0.680895751536 | 93 |
| 2030 | 2.11418130851928 | 1.532015440956 | 0.8426084925258 | 126 |
IV. Investment Strategy Comparison: SPON vs XTZ
Long-term vs Short-term Investment Strategies
- SPON: Suitable for investors focused on brand engagement and loyalty program potential
- XTZ: Suitable for investors seeking established ecosystems and institutional adoption
Risk Management and Asset Allocation
- Conservative investors: SPON: 20% vs XTZ: 80%
- Aggressive investors: SPON: 40% vs XTZ: 60%
- Hedging tools: Stablecoin allocation, options, cross-currency portfolios
V. Potential Risk Comparison
Market Risks
- SPON: Higher volatility due to lower market cap and trading volume
- XTZ: Susceptible to broader crypto market trends and macroeconomic factors
Technical Risks
- SPON: Scalability, network stability
- XTZ: Governance risks, potential smart contract vulnerabilities
Regulatory Risks
- Global regulatory policies may impact both, with XTZ potentially better positioned due to its more established compliance approach
VI. Conclusion: Which Is the Better Buy?
📌 Investment Value Summary:
- SPON advantages: Fixed supply, focus on brand engagement applications
- XTZ advantages: Established ecosystem, institutional adoption, self-amending blockchain
✅ Investment Advice:
- New investors: Consider a smaller allocation to SPON for higher risk/reward, larger allocation to XTZ for stability
- Experienced investors: Balanced portfolio with both assets, adjusting based on risk tolerance
- Institutional investors: XTZ may be more suitable due to its established presence and compliance focus
⚠️ Risk Warning: Cryptocurrency markets are highly volatile. This article does not constitute investment advice. None
VII. FAQ
Q1: What are the main differences between SPON and XTZ in terms of supply mechanism? A: SPON has a fixed supply with a maximum cap of 29,999,999 tokens, while XTZ has an inflationary model with new tokens created through the baking (staking) process.
Q2: How do SPON and XTZ compare in terms of institutional adoption? A: XTZ has more established institutional support and is used in various enterprise applications, including asset tokenization. SPON, being newer, is focusing on brand loyalty programs.
Q3: What are the key technical features of SPON and XTZ? A: SPON is built on the Ethereum blockchain and focuses on brand engagement applications. XTZ is a self-amending blockchain with on-chain governance allowing for upgrades without hard forks.
Q4: How do the price predictions for SPON and XTZ compare for 2030? A: For SPON, the base scenario predicts $0.07067715878025 - $0.094000621177732, while for XTZ, the base scenario predicts $1.532015440956 - $2.11418130851928.
Q5: What are the main risk factors for investing in SPON and XTZ? A: SPON faces higher volatility due to lower market cap and trading volume, while XTZ is more susceptible to broader crypto market trends and macroeconomic factors. Both face regulatory risks, with XTZ potentially better positioned due to its more established compliance approach.
Q6: How might a conservative investor allocate their portfolio between SPON and XTZ? A: A conservative investor might consider allocating 20% to SPON and 80% to XTZ, based on the risk profile and market establishment of each token.
Share
Content
Introduction: SPON vs XTZ Investment Comparison
I. Price History Comparison and Current Market Status
II. Key Factors Affecting Investment Value of SPON vs XTZ
III. Price Prediction 2025-2030: SPON vs XTZ
IV. Investment Strategy Comparison: SPON vs XTZ
V. Potential Risk Comparison
VI. Conclusion: Which Is the Better Buy?
VII. FAQ

