SWAP ve NEAR: Bu Blockchain protokollerinin temel farklarını anlamak

Giriş: SWAP ve NEAR Yatırımı Karşılaştırması
Kripto para piyasasında TrustSwap (SWAP) ile NEAR (NEAR) arasındaki karşılaştırma, yatırımcılar için her zaman kaçınılmaz bir tartışma olmuştur. Bu iki proje, piyasa değeri sıralaması, kullanım alanları ve fiyat performansı açısından belirgin farklılıklar sunarken, kripto varlık ekosisteminde de farklı bir konumda yer almaktadır.
TrustSwap (SWAP): 2020’de piyasaya sürülmüş olup, güvenli ve güvenilir fon transferlerine olanak sağlayan yenilikçi ödeme platformuyla piyasada tanınmıştır.
NEAR (NEAR): 2020’de tanıtılmış ve mobil cihazlarda DApp çalıştırma için hızlı destek sunan, yüksek ölçeklenebilirliğe sahip temel protokol olarak öne çıkmıştır.
Bu yazıda, SWAP ve NEAR’ın yatırım değerini; tarihsel fiyat eğilimleri, arz mekanizmaları, kurumsal benimseme, teknolojik ekosistemler ve gelecek öngörüleri üzerinden kapsamlı şekilde analiz edeceğiz. Yatırımcıların en çok merak ettiği şu soruya yanıt arayacağız:
"Şu anda hangisi daha iyi bir yatırım?"
I. Fiyat Geçmişi Karşılaştırması ve Güncel Piyasa Durumu
TrustSwap (SWAP) ve NEAR (NEAR) Tarihsel Fiyat Eğilimleri
- 2021: SWAP, 16 Nisan 2021’de tüm zamanların en yüksek seviyesi olan $5’a ulaştı.
- 2022: NEAR, 17 Ocak 2022’de tüm zamanların en yüksek seviyesi olan $20,44’e yükseldi.
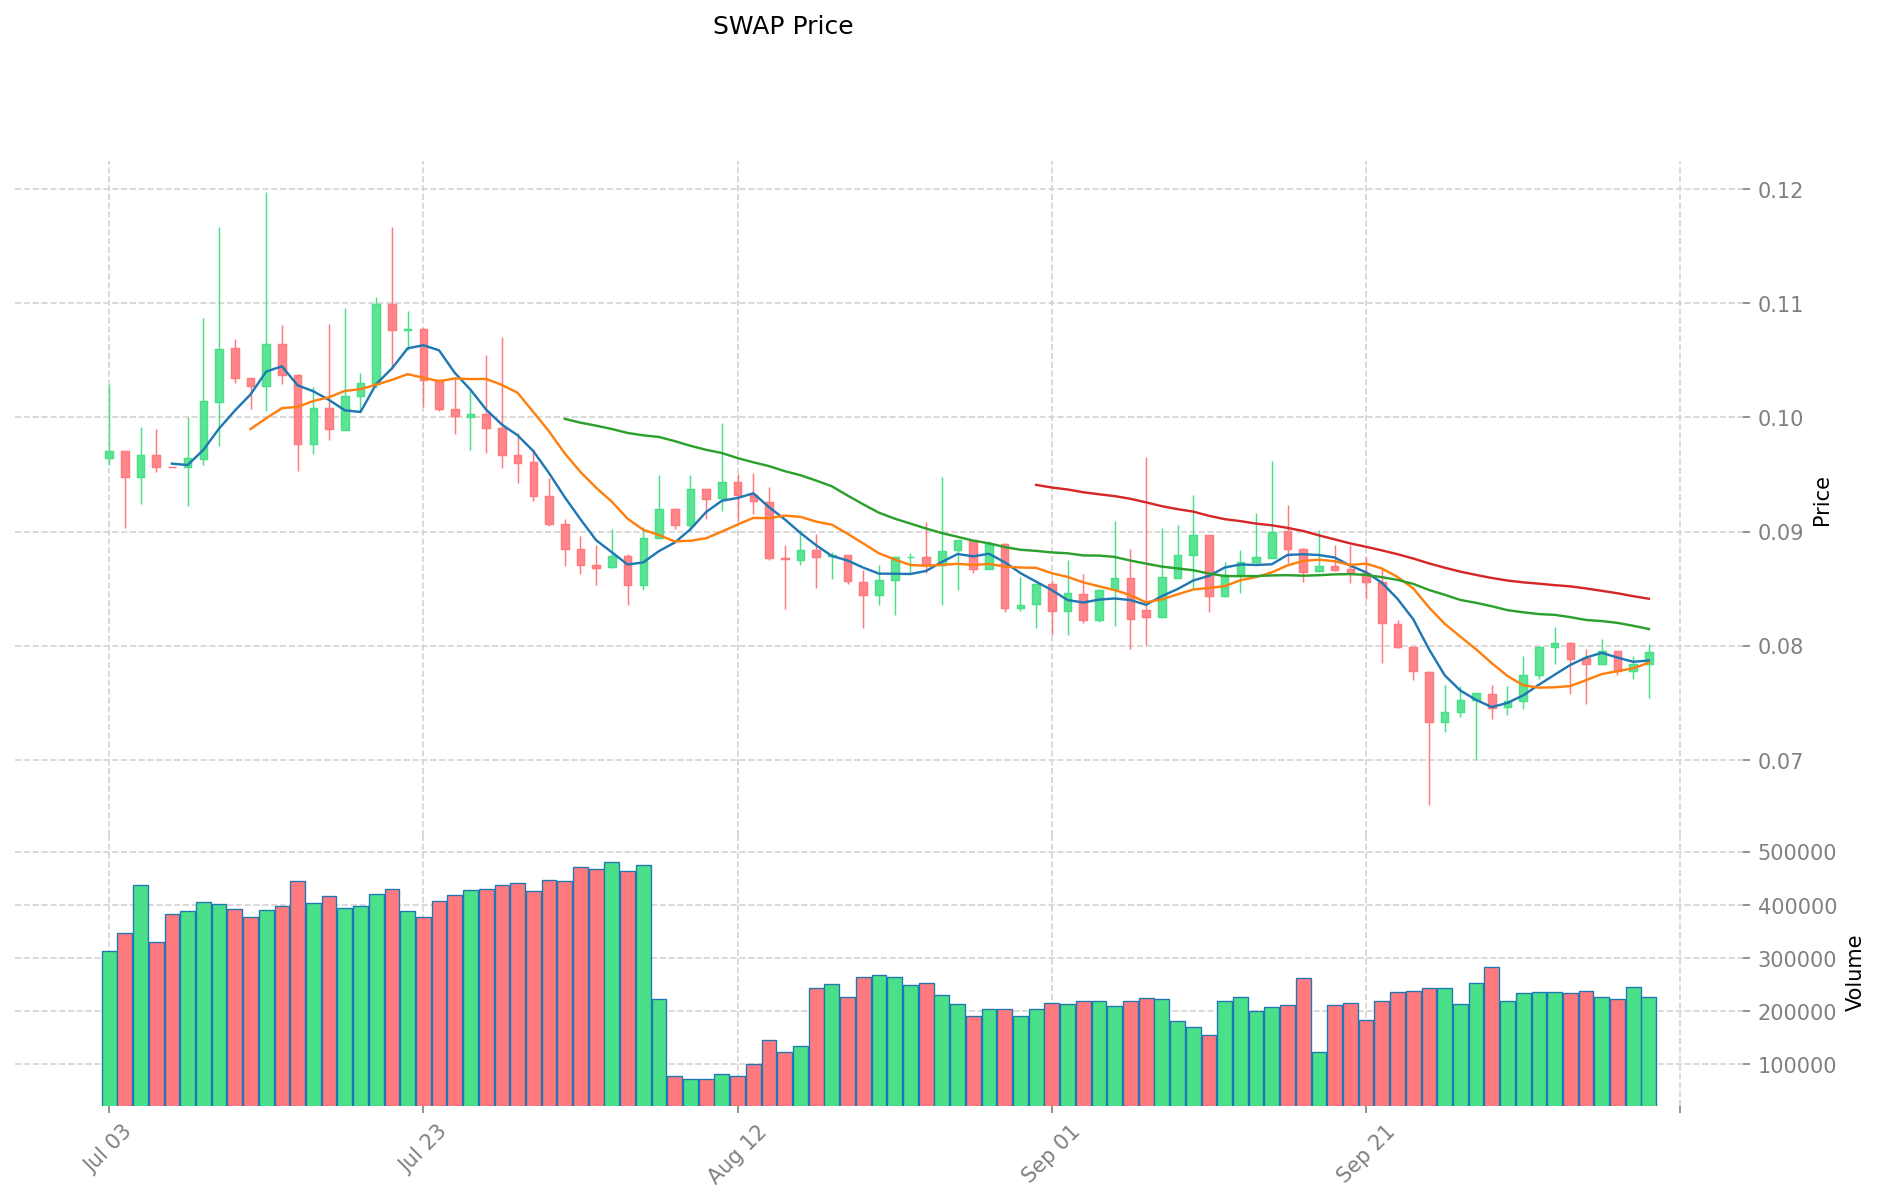
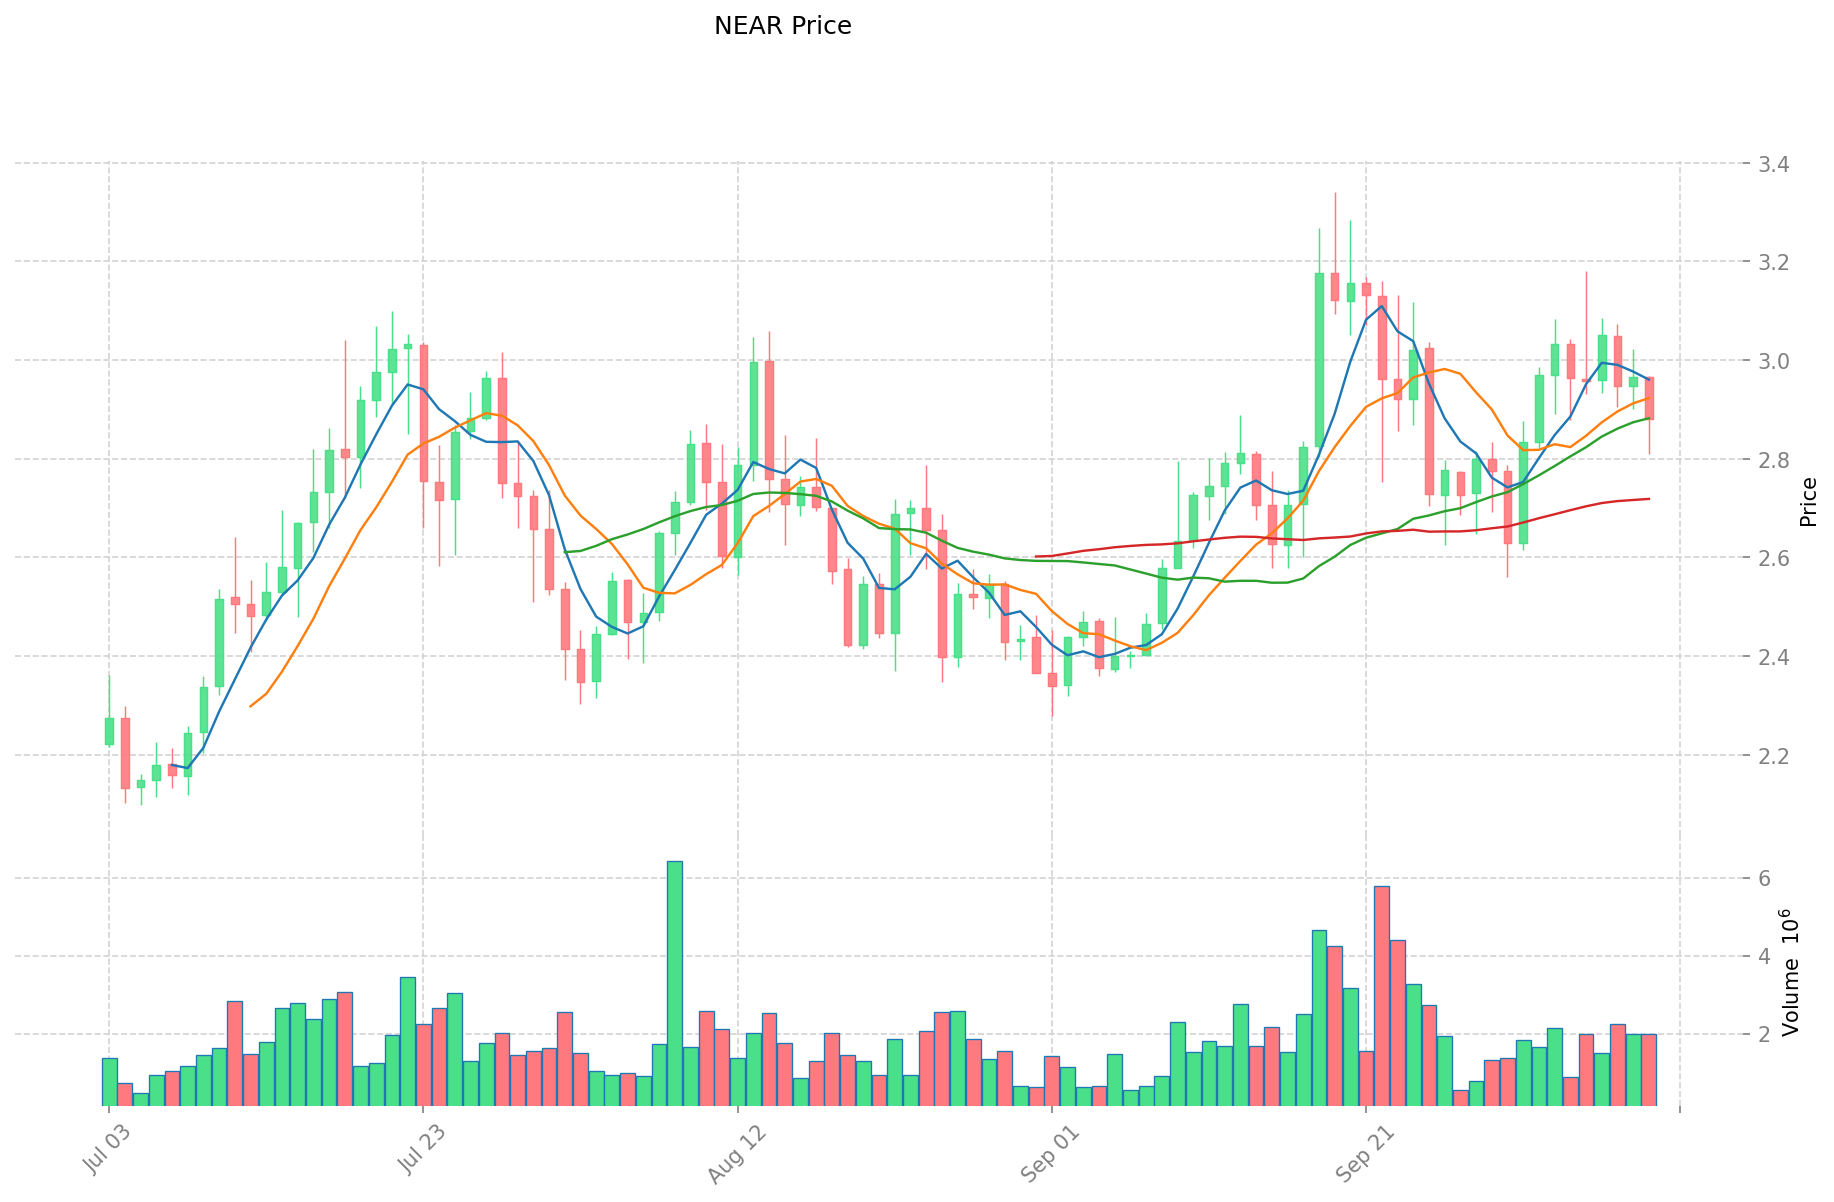
- Karşılaştırma: ATH seviyelerinden bu yana, SWAP $5’tan $0,07939’a; NEAR ise $20,44’ten $2,888’e geriledi.
Güncel Piyasa Durumu (10 Ekim 2025)
- SWAP güncel fiyatı: $0,07939
- NEAR güncel fiyatı: $2,888
- 24 saatlik işlem hacmi: $17.784,23 (SWAP) - $5.662.377,81 (NEAR)
- Piyasa Duyarlılık Endeksi (Korku & Açgözlülük Endeksi): 70 (Açgözlülük)
Gerçek zamanlı fiyatları görüntüleyin:
- SWAP güncel fiyatı Piyasa Fiyatı
- NEAR güncel fiyatı Piyasa Fiyatı
II. SWAP ve NEAR’ın Yatırım Değerini Etkileyen Temel Unsurlar
Arz Mekanizmaları Karşılaştırması (Tokenomik)
- SWAP: Veri setinde net tokenomik bilgisi bulunmuyor
- NEAR: Yıllık %5’lik, zamanla azalan enflasyon modeli; genesis aşamasında 1 milyar token üretildi
- 📌 Geçmiş Eğilim: Deflasyonist veya sabit arz modelleri genellikle boğa piyasalarında döngüsel fiyat hareketlerine yol açarken, şeffaf ihraç programları yatırımcılar için uzun vadeli öngörülebilirlik sağlar.
Kurumsal Benimseme ve Piyasa Uygulamaları
- Kurumsal Portföyler: NEAR, a16z, Coinbase Ventures ve Dragonfly Capital gibi önde gelen VC’lerden yatırım aldı
- Kurumsal Kullanım: NEAR, Aurora (EVM) ve Rainbow Bridge ile zincirler arası birlikte çalışabilirlik sunarak Ethereum ekosistemine entegrasyon sağlıyor
- Regülasyon Yaklaşımları: Referans materyalde her iki token için özel regülasyon bilgisi bulunmuyor
Teknik Gelişim ve Ekosistem Oluşumu
- NEAR Teknik Güncellemeleri: Nightshade isimli sharding teknolojisi ile ölçeklenebilirlik sağlanıyor; geliştirici esnekliği için WebAssembly tabanlı çalışma zamanı
- SWAP Teknik Gelişimi: Referans materyalde teknik detay bulunmuyor
- Ekosistem Karşılaştırması: NEAR ekosistemi, sharding sayesinde 100.000 TPS işlem kapasitesiyle DeFi, NFT pazaryerleri ve dApp’leri destekliyor
Makroekonomik Faktörler ve Piyasa Döngüleri
- Enflasyonist Ortamlardaki Performans: Karşılaştırmalı veri yok
- Makro Para Politikası Etkisi: Karşılaştırmalı veri yok
- Jeopolitik Faktörler: Karşılaştırmalı veri yok III. 2025-2030 Fiyat Tahmini: SWAP vs NEAR
Kısa Vadeli Tahmin (2025)
- SWAP: Temkinli $0,0587 - $0,0794 | İyimser $0,0794 - $0,0977
- NEAR: Temkinli $2,36 - $2,88 | İyimser $2,88 - $4,03
Orta Vadeli Tahmin (2027)
- SWAP büyüme evresine geçebilir; beklenen fiyatlar $0,0647 - $0,1061
- NEAR boğa piyasasına girebilir; beklenen fiyatlar $3,42 - $5,50
- Başlıca itici güçler: Kurumsal sermaye girişi, ETF, ekosistem gelişimi
Uzun Vadeli Tahmin (2030)
- SWAP: Temel senaryo $0,1129 - $0,1265 | İyimser senaryo $0,1265 - $0,1265
- NEAR: Temel senaryo $6,09 - $6,64 | İyimser senaryo $6,64 - $6,64
Feragatname: Bu analiz, geçmiş veriler ve piyasa tahminlerine dayanmaktadır. Kripto para piyasaları oldukça değişken ve öngörülemezdir. Bu öngörüler yatırım tavsiyesi değildir. Yatırım kararı almadan önce mutlaka kendi araştırmanızı yapınız.
SWAP:
| Yıl | Tahmini En Yüksek Fiyat | Tahmini Ortalama Fiyat | Tahmini En Düşük Fiyat | Değişim Oranı |
|---|---|---|---|---|
| 2025 | 0,0976866 | 0,07942 | 0,0587708 | 0 |
| 2026 | 0,091209899 | 0,0885533 | 0,057559645 | 11 |
| 2027 | 0,10606028741 | 0,0898815995 | 0,06471475164 | 13 |
| 2028 | 0,1018897811932 | 0,097970943455 | 0,07935646419855 | 23 |
| 2029 | 0,125912256528366 | 0,0999303623241 | 0,050964484785291 | 25 |
| 2030 | 0,12647186655738 | 0,112921309426233 | 0,108404457049183 | 42 |
NEAR:
| Yıl | Tahmini En Yüksek Fiyat | Tahmini Ortalama Fiyat | Tahmini En Düşük Fiyat | Değişim Oranı |
|---|---|---|---|---|
| 2025 | 4,0348 | 2,882 | 2,36324 | 0 |
| 2026 | 4,876344 | 3,4584 | 3,11256 | 19 |
| 2027 | 5,50093104 | 4,167372 | 3,41724504 | 44 |
| 2028 | 5,800981824 | 4,83415152 | 4,4957609136 | 67 |
| 2029 | 6,85966100688 | 5,317566672 | 4,09452633744 | 84 |
| 2030 | 6,6365890849896 | 6,08861383944 | 4,0184851340304 | 110 |
IV. Yatırım Stratejisi Karşılaştırması: SWAP ve NEAR
Uzun Vadeli ve Kısa Vadeli Yatırım Stratejisi
- SWAP: Ödeme çözümleri ve ekosistem potansiyeline odaklanan yatırımcılar için uygundur
- NEAR: Ölçeklenebilirlik ve DApp altyapısı arayan yatırımcılar için uygundur
Risk Yönetimi ve Varlık Dağılımı
- Temkinli yatırımcılar: SWAP %30 - NEAR %70
- Agresif yatırımcılar: SWAP %50 - NEAR %50
- Koruma araçları: Stablecoin tahsisi, opsiyonlar, çapraz para portföyleri
V. Potansiyel Risk Karşılaştırması
Piyasa Riski
- SWAP: Düşük işlem hacmi yüksek oynaklığa neden olabilir
- NEAR: Token enflasyonu nedeniyle fiyat dalgalanması riski
Teknik Risk
- SWAP: Ölçeklenebilirlik ve ağ istikrarı
- NEAR: Sharding uygulama zorlukları, güvenlik açıkları
Regülasyon Riski
- Küresel regülasyon politikaları her iki token üzerinde farklı etkiler yaratabilir
VI. Sonuç: Hangisi Daha İyi Bir Yatırım?
📌 Yatırım Değeri Özeti
- SWAP’ın avantajları: Yenilikçi ödeme platformu, niş pazarda büyüme potansiyeli
- NEAR’ın avantajları: Ölçeklenebilir altyapı, güçlü kurumsal destek, gelişmiş ekosistem
✅ Yatırım Tavsiyesi
- Yeni başlayan yatırımcılar: NEAR’ın gelişmiş ekosistemi nedeniyle daha yüksek oran ayırabilir
- Deneyimli yatırımcılar: Daha yüksek risk-getiri için SWAP’a daha fazla ağırlık vererek dengeli yaklaşım benimseyebilir
- Kurumsal yatırımcılar: Ölçeklenebilirlik ve kurumsal benimseme sayesinde NEAR daha cazip olabilir
⚠️ Risk Uyarısı: Kripto para piyasaları yüksek volatiliteye sahiptir. Bu makale yatırım tavsiyesi değildir. None
VII. Sıkça Sorulan Sorular
S1: SWAP ve NEAR arasındaki temel farklar nelerdir? C: SWAP, fon transferleri için güvenli bir ödeme platformu sağlarken; NEAR, mobil cihazlarda DApp çalıştırma için yüksek ölçeklenebilirliğe sahip bir temel protokoldür. NEAR’ın ekosistemi daha gelişmiş ve kurumsal desteği daha güçlü, SWAP ise daha niş bir pazarda faaliyet göstermektedir.
S2: Geçmişte hangi token daha iyi performans gösterdi? C: Verilere göre NEAR daha iyi bir tarihsel performans sergilemiştir. Ocak 2022’de tüm zamanların en yüksek seviyesi olan $20,44’e ulaşırken, SWAP Nisan 2021’de $5’a kadar çıkmıştır. 10 Ekim 2025 itibarıyla NEAR $2,888, SWAP ise $0,07939 seviyesindedir.
S3: SWAP ve NEAR’ın arz mekanizmaları nasıl farklılık gösteriyor? C: NEAR, yıllık %5 ve zamanla azalan bir enflasyon modeline sahip; genesis aşamasında 1 milyar token çıkarıldı. SWAP’ın tokenomik yapısına dair net bilgi bulunmuyor.
S4: NEAR’ın başlıca teknik özellikleri nelerdir? C: NEAR, ölçeklenebilirlik için Nightshade sharding teknolojisini uygular ve geliştirici esnekliği için WebAssembly tabanlı çalışma zamanına sahiptir. Ayrıca Aurora (EVM) ve Rainbow Bridge ile Ethereum ekosistemiyle zincirler arası entegrasyon sağlar.
S5: SWAP ve NEAR’ın uzun vadeli fiyat tahminleri nasıl? C: 2030 yılı için SWAP’ın temel senaryo fiyat aralığı $0,1129 - $0,1265; NEAR’ın ise $6,09 - $6,64 olarak öngörülüyor. Bu, uzun vadede NEAR’ın daha yüksek bir büyüme potansiyeline sahip olabileceğini gösteriyor.
S6: SWAP ve NEAR yatırımıyla ilgili temel riskler neler? C: SWAP için başlıca riskler düşük işlem hacmi nedeniyle yüksek volatilite ve ölçeklenebilirlik/ağ istikrarı sorunlarıdır. NEAR için ise token enflasyonu kaynaklı fiyat dalgalanması ve sharding teknolojisinde karşılaşılabilecek güvenlik zorlukları öne çıkar. Her iki token için de küresel regülasyon politikaları risk faktörüdür.
S7: Farklı yatırımcı tipleri için hangi token daha uygun olabilir? C: Yeni başlayan yatırımcılar, gelişmiş ekosistemi nedeniyle NEAR’a daha fazla ağırlık verebilir. Deneyimli yatırımcılar ise, daha yüksek risk-getiri için SWAP’a ağırlık vererek dengeli bir portföy oluşturabilir. Kurumsal yatırımcılar, ölçeklenebilirlik ve kurumsal benimsenme ile NEAR’ı daha cazip bulabilir.
Share
Content
Giriş: SWAP ve NEAR Yatırımı Karşılaştırması
I. Fiyat Geçmişi Karşılaştırması ve Güncel Piyasa Durumu
II. SWAP ve NEAR’ın Yatırım Değerini Etkileyen Temel Unsurlar
IV. Yatırım Stratejisi Karşılaştırması: SWAP ve NEAR
V. Potansiyel Risk Karşılaştırması
VI. Sonuç: Hangisi Daha İyi Bir Yatırım?
VII. Sıkça Sorulan Sorular
How to Buy Cryptocurrency


Trending Cryptocurrencies


2025 SUI Fiyat Tahmini: Blockchain’in Yeni Gözdesinin Gelecekteki Gelişimi ve Yatırım Değeri Analizi

2025 INIT Fiyat Tahmini: Initial Network Token’ının Büyümesi İçin Piyasa Analizi ve Geleceğe Dair Beklentiler

INV vs AVAX: İki Önde Gelen Blockchain Platformunun Karşılaştırmalı Analizi
ALPINE vs APT: Linux Dağıtımları İçin Paket Yönetim Sistemleri Karşılaştırması

Polygon Ecosystem Token (POL) iyi bir yatırım mı?: Bu layer-2 ölçeklendirme çözümünün potansiyelini ve risklerini değerlendiriyoruz

Astar Token (ASTR) iyi bir yatırım mı?: Polkadot ekosistemi içerisindeki bu tokenin potansiyelini ve risklerini değerlendirme
Dropee Günlük Kombinasyonu 11 Aralık 2025
Tomarket Günlük Kombinasyonu 11 Aralık 2025

Merkeziyetsiz Finans'ta Geçici Kayıp Nedir?

Kripto Parada Çifte Harcama: Önleme Stratejileri

Kripto Ticaretinde Wyckoff Yönteminin Anlaşılması