URO vs GRT: Comparing Two Leading Blockchain Projects for Scalability and Performance
Introduction: Investment Comparison of URO vs GRT
In the cryptocurrency market, the comparison between UniRouter (URO) vs The Graph (GRT) has always been a topic that investors can't ignore. The two not only show significant differences in market cap ranking, application scenarios, and price performance, but also represent different crypto asset positioning.
UniRouter (URO): Launched in 2024, it has gained market recognition for its innovative liquid staking solutions for Bitcoin.
The Graph (GRT): Since its inception in 2020, it has been hailed as the "Google of blockchains," becoming one of the most widely used indexing protocols for querying blockchain data.
This article will comprehensively analyze the investment value comparison between URO and GRT, focusing on historical price trends, supply mechanisms, institutional adoption, technological ecosystems, and future predictions, attempting to answer the question investors care about most:
"Which is the better buy right now?"
I. Price History Comparison and Current Market Status
URO and GRT Historical Price Trends
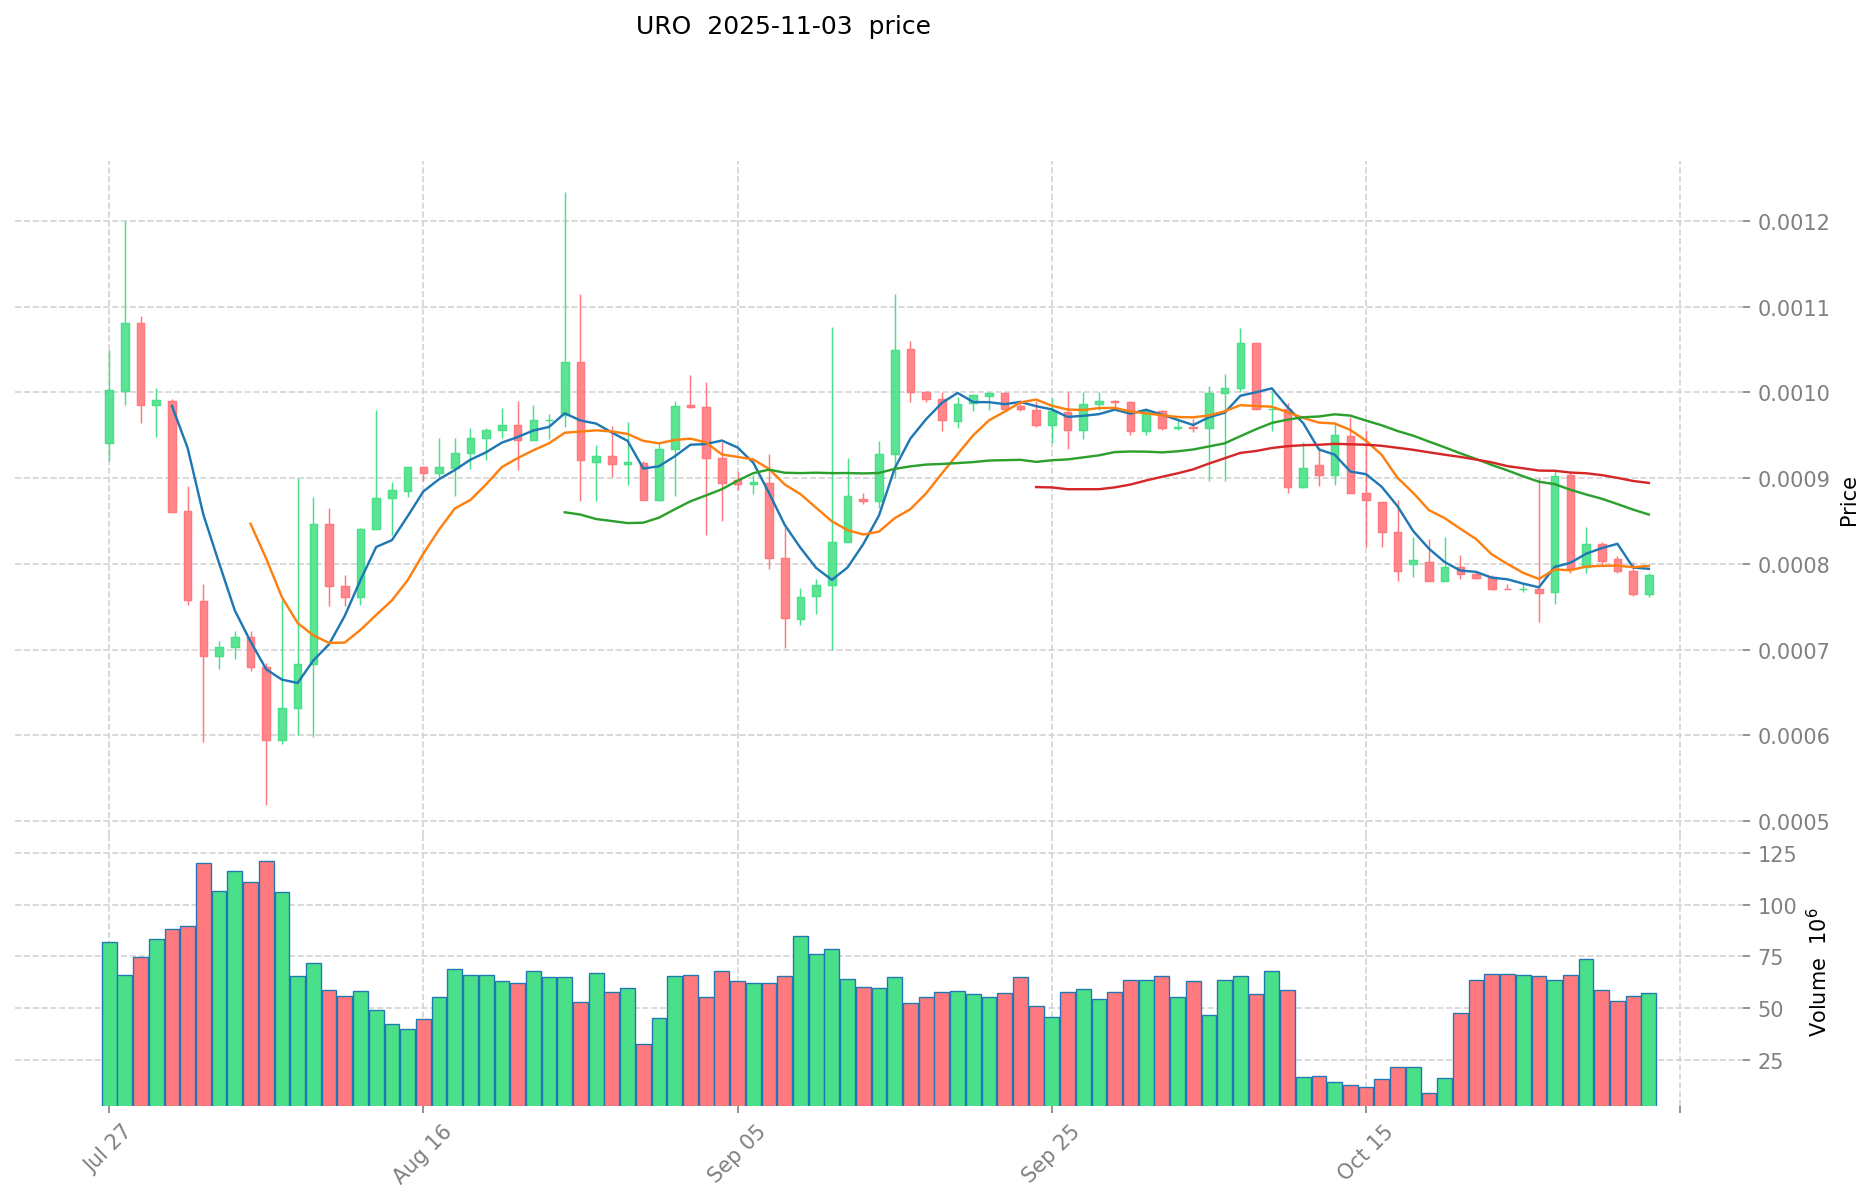
- 2024: URO reached its all-time high of $0.08 on November 15, 2024.
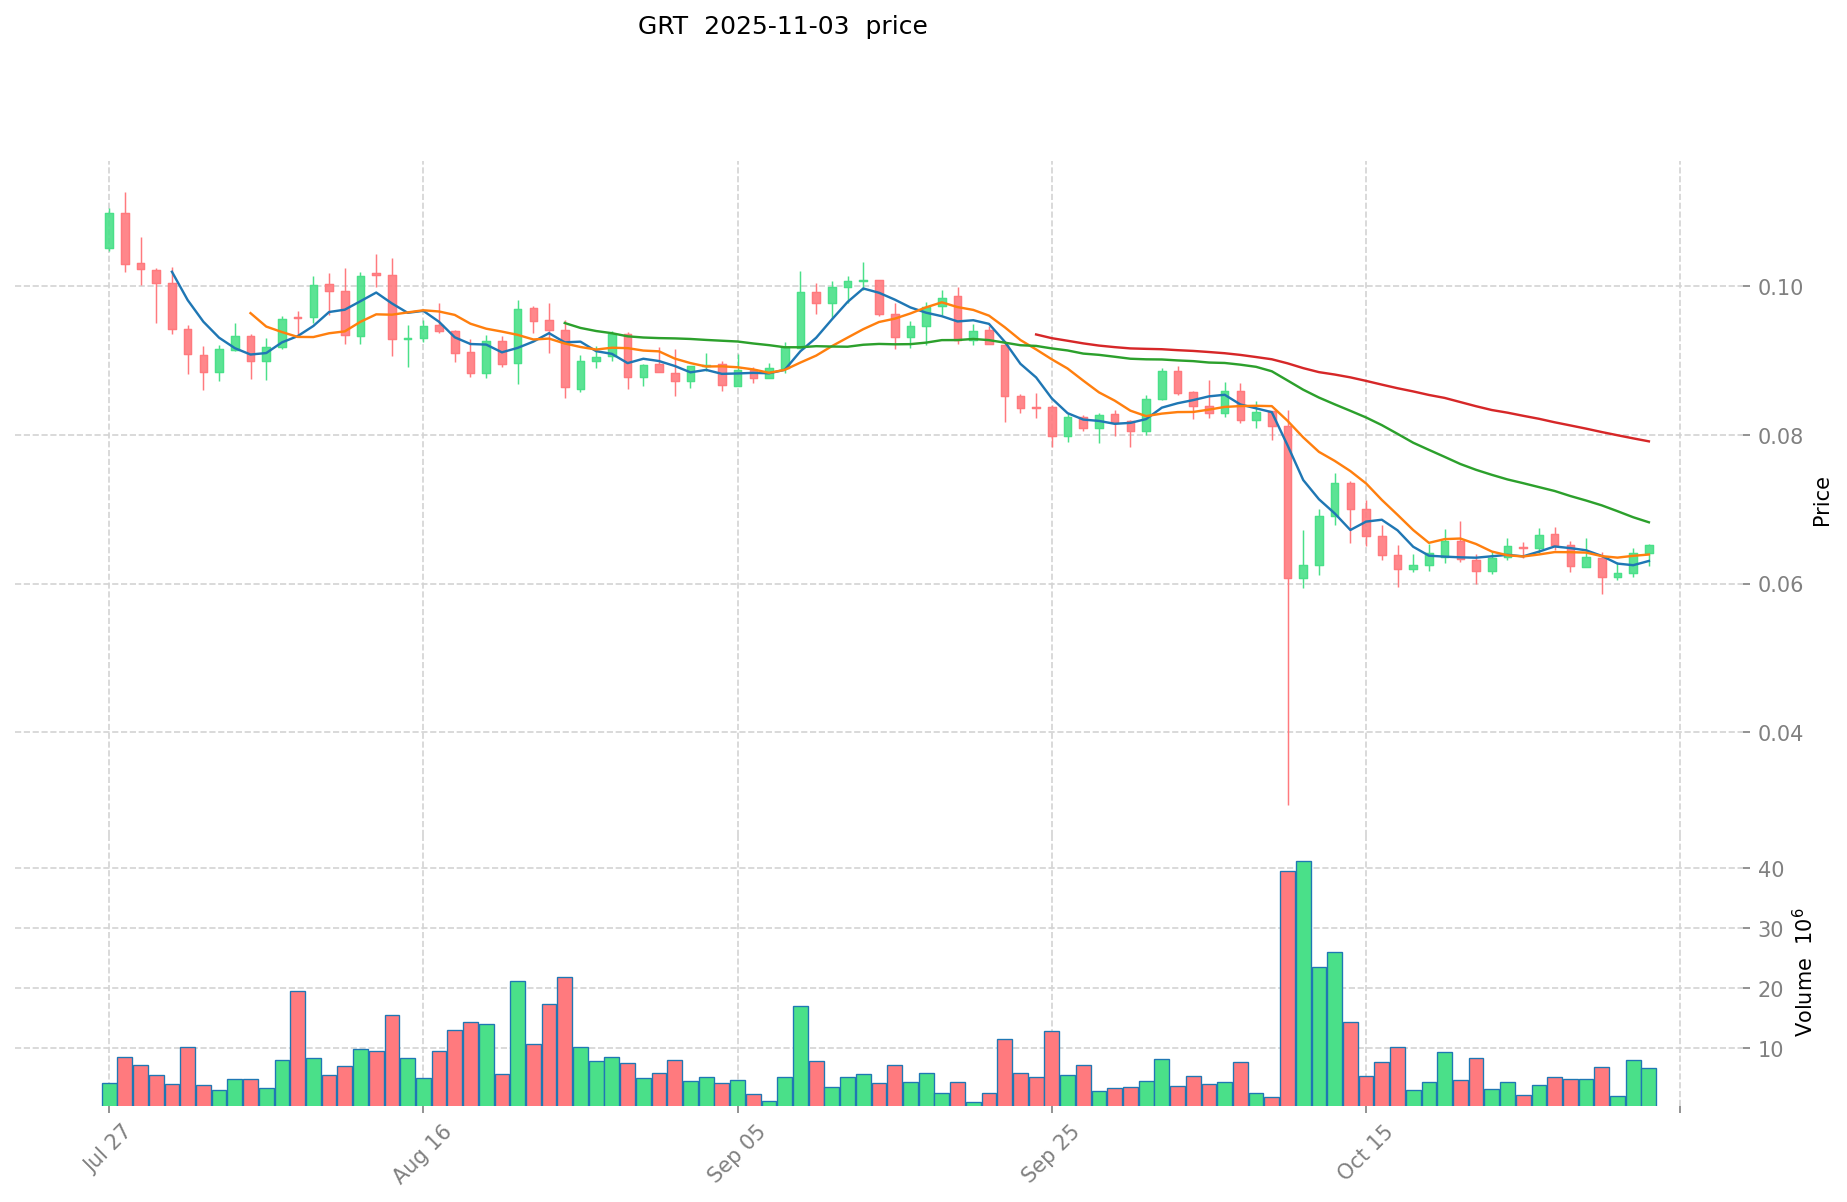
- 2025: GRT hit its all-time low of $0.04626017 on July 2, 2025.
- Comparative analysis: In the recent market cycle, URO dropped from its high of $0.08 to a low of $0.000329, while GRT declined from $2.84 to $0.04626017.
Current Market Situation (2025-11-03)
- URO current price: $0.0007872
- GRT current price: $0.05954
- 24-hour trading volume: URO $42,942.49 vs GRT $303,473.91
- Market Sentiment Index (Fear & Greed Index): 42 (Fear)
Click to view real-time prices:
- Check URO current price Market Price
- Check GRT current price Market Price
II. Key Factors Influencing URO vs GRT Investment Value
Supply Mechanisms Comparison (Tokenomics)
- URO: Stock market risk is a key factor, with value fluctuations influenced by investment sentiment, political and economic conditions
- GRT: Subject to market risk factors with value potentially impacted by regional differences, definition changes and strategy variations
Institutional Adoption and Market Applications
- Institutional Holdings: Investment decisions for both tokens are affected by general market risks and external factors
- Enterprise Adoption: Both URO and GRT investments face challenges during emergencies, such as the conflict between Russia and Ukraine which severely damages normal market trading conditions
- Regulatory Attitudes: Different countries have varying regulatory approaches that directly impact investment returns
Technical Development and Ecosystem Building
- Market Sentiment: Both tokens are subject to stock market volatility based on investment climate
- Political and Economic Environment: The political and economic landscape directly affects investment values
- Industry-Specific Factors: Development trends within specific industries impact the potential return on investment
Macroeconomic Factors and Market Cycles
- Performance in Inflationary Environments: External shocks may require increased investment to boost domestic demand
- Macroeconomic Monetary Policy: Credit dependency is increasing as public investment rises while company investments slow down
- Geopolitical Factors: Conflicts like the Russia-Ukraine situation create emergency events that make investment valuation and disposal impractical
III. 2025-2030 Price Prediction: URO vs GRT
Short-term Prediction (2025)
- URO: Conservative $0.000716716 - $0.0007876 | Optimistic $0.0007876 - $0.001000252
- GRT: Conservative $0.0441188 - $0.05962 | Optimistic $0.05962 - $0.0816794
Mid-term Prediction (2027)
- URO may enter a growth phase, with an estimated price range of $0.000868896072 - $0.0011971456992
- GRT may enter a bullish market, with an estimated price range of $0.07869670083 - $0.121393847025
- Key drivers: Institutional capital inflow, ETF, ecosystem development
Long-term Prediction (2030)
- URO: Base scenario $0.001140763998528 - $0.001408843538182 | Optimistic scenario $0.001408843538182 - $0.002056911565745
- GRT: Base scenario $0.107064758016865 - $0.118960842240961 | Optimistic scenario $0.118960842240961 - $0.130856926465058
Disclaimer: The above predictions are based on historical data and current market trends. Cryptocurrency markets are highly volatile and subject to rapid changes. These forecasts should not be considered as financial advice. Always conduct your own research before making any investment decisions.
URO:
| 年份 | 预测最高价 | 预测平均价格 | 预测最低价 | 涨跌幅 |
|---|---|---|---|---|
| 2025 | 0.001000252 | 0.0007876 | 0.000716716 | 0 |
| 2026 | 0.00103695416 | 0.000893926 | 0.0004916593 | 13 |
| 2027 | 0.0011971456992 | 0.00096544008 | 0.000868896072 | 22 |
| 2028 | 0.001200235107456 | 0.0010812928896 | 0.000637962804864 | 37 |
| 2029 | 0.001676923077836 | 0.001140763998528 | 0.000924018838807 | 44 |
| 2030 | 0.002056911565745 | 0.001408843538182 | 0.000718510204472 | 78 |
GRT:
| 年份 | 预测最高价 | 预测平均价格 | 预测最低价 | 涨跌幅 |
|---|---|---|---|---|
| 2025 | 0.0816794 | 0.05962 | 0.0441188 | 0 |
| 2026 | 0.096790089 | 0.0706497 | 0.047335299 | 18 |
| 2027 | 0.121393847025 | 0.0837198945 | 0.07869670083 | 40 |
| 2028 | 0.111786989131125 | 0.1025568707625 | 0.081019927902375 | 72 |
| 2029 | 0.130749754535111 | 0.107171929946812 | 0.100741614150003 | 80 |
| 2030 | 0.130856926465058 | 0.118960842240961 | 0.107064758016865 | 100 |
IV. Investment Strategy Comparison: URO vs GRT
Long-term vs Short-term Investment Strategies
- URO: Suitable for investors focused on innovative liquid staking solutions and Bitcoin ecosystem potential
- GRT: Suitable for investors interested in blockchain data indexing and querying infrastructure
Risk Management and Asset Allocation
- Conservative investors: URO: 20% vs GRT: 80%
- Aggressive investors: URO: 40% vs GRT: 60%
- Hedging tools: Stablecoin allocation, options, cross-currency portfolios
V. Potential Risk Comparison
Market Risk
- URO: High volatility due to newer project status and Bitcoin market correlation
- GRT: Susceptible to overall blockchain industry trends and adoption rates
Technical Risk
- URO: Scalability, network stability
- GRT: Data indexing accuracy, potential vulnerabilities in smart contracts
Regulatory Risk
- Global regulatory policies may impact both tokens differently, with GRT potentially facing less scrutiny due to its infrastructure focus
VI. Conclusion: Which Is the Better Buy?
📌 Investment Value Summary:
- URO advantages: Innovative liquid staking for Bitcoin, potential for growth in a niche market
- GRT advantages: Established protocol, wide adoption in blockchain data querying, longer track record
✅ Investment Advice:
- Novice investors: Consider a small allocation to GRT as part of a diversified crypto portfolio
- Experienced investors: Explore a balanced mix of URO and GRT, adjusting based on risk tolerance
- Institutional investors: Conduct thorough due diligence on both projects, with a potential focus on GRT for its established market position
⚠️ Risk Warning: Cryptocurrency markets are highly volatile. This article does not constitute investment advice. None
VII. FAQ
Q1: What are the main differences between URO and GRT? A: URO is a newer project focused on liquid staking solutions for Bitcoin, launched in 2024. GRT, launched in 2020, is an established indexing protocol for querying blockchain data, often called the "Google of blockchains".
Q2: How do the current prices of URO and GRT compare? A: As of November 3, 2025, URO's price is $0.0007872, while GRT's price is $0.05954. GRT has a higher price and larger trading volume compared to URO.
Q3: What are the key factors influencing the investment value of URO and GRT? A: Key factors include supply mechanisms, institutional adoption, technical development, ecosystem building, and macroeconomic factors such as inflation and geopolitical events.
Q4: What are the price predictions for URO and GRT in 2030? A: For URO, the base scenario predicts a range of $0.001140763998528 - $0.001408843538182, with an optimistic scenario of up to $0.002056911565745. For GRT, the base scenario predicts $0.107064758016865 - $0.118960842240961, with an optimistic scenario up to $0.130856926465058.
Q5: How should investors allocate their assets between URO and GRT? A: Conservative investors might consider allocating 20% to URO and 80% to GRT, while aggressive investors might opt for 40% URO and 60% GRT. However, these allocations should be adjusted based on individual risk tolerance and investment goals.
Q6: What are the main risks associated with investing in URO and GRT? A: The main risks include market volatility, technical challenges (such as scalability for URO and data indexing accuracy for GRT), and regulatory uncertainties that may affect both tokens differently.
Q7: Which token is considered a better buy for different types of investors? A: For novice investors, GRT may be a safer choice due to its established position. Experienced investors might consider a mix of both tokens. Institutional investors should conduct thorough due diligence, potentially focusing more on GRT for its established market position.
Share
Content
Introduction: Investment Comparison of URO vs GRT
I. Price History Comparison and Current Market Status
II. Key Factors Influencing URO vs GRT Investment Value
III. 2025-2030 Price Prediction: URO vs GRT
IV. Investment Strategy Comparison: URO vs GRT
V. Potential Risk Comparison
VI. Conclusion: Which Is the Better Buy?
VII. FAQ

