Beginner’s Guide: How to Analyze Crypto Prices on Gate Platform
1. Gate Platform Overview
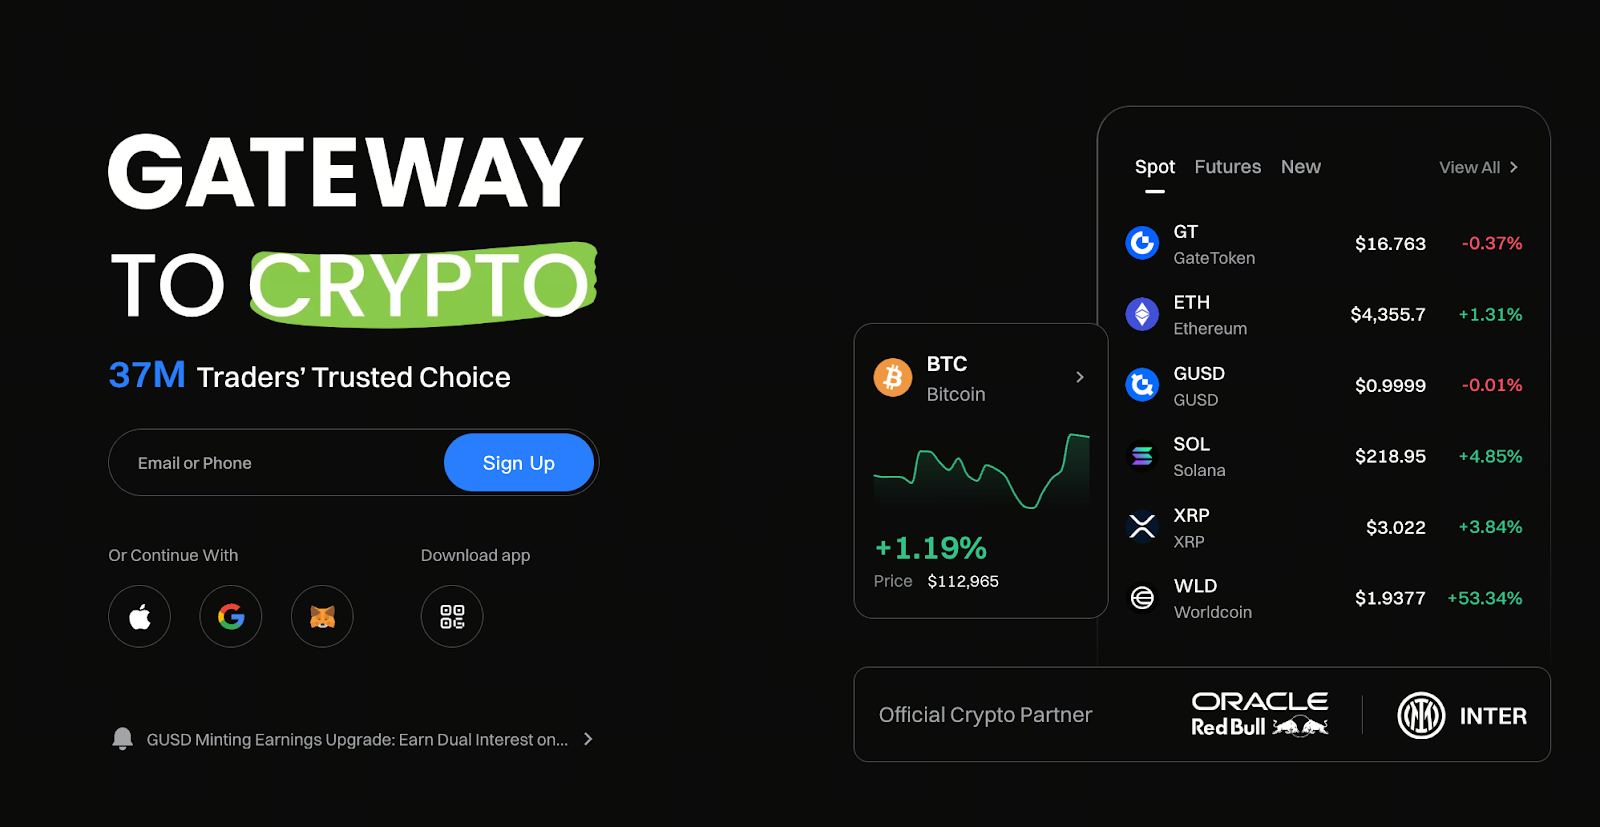
Image: https://www.gate.com/
Gate is a leading global cryptocurrency trading platform, offering spot trading, derivatives, and cryptocurrency asset management. For newcomers, developing strong chart-reading skills is important. This helps users quickly understand market dynamics and identify entry and exit points.
2. Fundamental Concepts to Understand Before Analyzing the Market
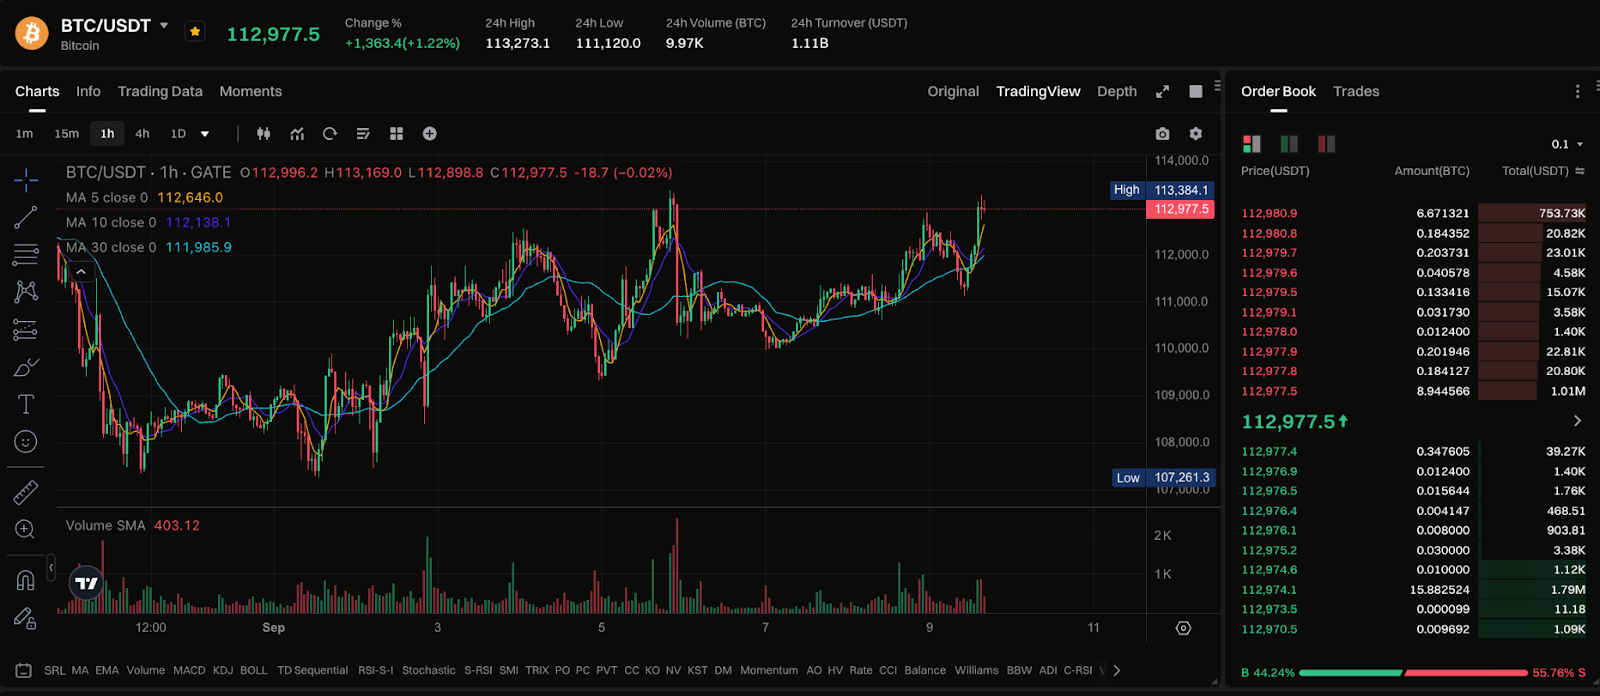
Image: https://www.gate.com/trade/BTC_USDT
- Candlestick Chart: Displays open, close, high, and low prices: an essential tool for technical market analysis.
- Trading Volume: Indicates the level of market activity; higher trading volumes often correspond with significant price movements.
- Order Book: Shows the price levels and quantities of active buy and sell orders, enabling assessment of real-time supply and demand.
To analyze the market effectively, users should master these fundamental concepts.
3. Overview of the Market Interface on the Gate Platform
On Gate’s “Trading” interface, you’ll find:
- Candlestick Chart: Flexible timeframe selection (1 minute, 5 minutes, 1 hour, etc.)
- Depth Chart: Visualizes cumulative buy and sell order quantities
- Trade History: Displays the most recent transactions in real time
These interface elements help users quickly assess market trends and monitor fund flows.
4. Key Indicators and Analytical Tools
- MACD: Identifies buy and sell signals by analyzing the intersection of fast and slow moving averages
- RSI: Assesses whether the market is currently overbought or oversold
- Bollinger Bands: Evaluates the price volatility range and possible breakout points
Users can evaluate market trends by leveraging these technical indicators and develop more data-driven trading strategies.
5. How to Formulate Investment Strategies Through Market Analysis
Market analysis involves more than just monitoring price changes. Users need to understand trends and trading volumes:
- Trend Analysis: Use continuous candlestick patterns and technical indicators to determine whether the market is in an uptrend, downtrend, or consolidation phase
- Diversification: Track multiple trading pairs to mitigate the impact of volatility in a single asset on your overall portfolio
- Set stop-loss and take-profit orders: Use your analysis to manage risk and lock in gains
6. Common Questions from Beginners
Q1: How do I know if the order book is active?
Look for high trading volume and order book balance; active markets typically exhibit frequent trades and evenly distributed orders.
Q2: Can technical indicators guarantee profits?
No—technical indicators are reference tools and do not guarantee profits. Effective trading requires sound risk management and comprehensive market analysis.
Q3: How often should I check the market?
Beginners should monitor the market one to two times per day. As you gain experience, adjust the frequency according to your trading strategy and objectives.
Share
Content


Related Articles

2025 BTC Price Prediction: BTC Trend Forecast Based on Technical and Macroeconomic Data

Flare Crypto Explained: What Is Flare Network and Why It Matters in 2025

Pi Coin Transaction Guide: How to Transfer to Gate.com

How to Use a Crypto Whale Tracker: Top Tool Recommendation for 2025 to Follow Whale Moves

What is N2: An AI-Driven Layer 2 Solution