ALEPH vs DOT: A Comprehensive Comparison of Two Leading Blockchain Networks


Introduction: ALEPH vs DOT Investment Comparison
In the cryptocurrency market, comparisons between Aleph.im and Polkadot have always been a topic that investors cannot ignore. The two differ significantly in market capitalization rankings, application scenarios, and price performance, while also representing different positioning within the crypto asset landscape. Aleph.im (ALEPH): Since its launch, it has gained market recognition by positioning itself as a decentralized network for the future of decentralization—offering cross-blockchain second-layer networks, decentralized secure cloud computing, and decentralized messaging and analysis platforms. Polkadot (DOT): Since its inception, it has been recognized for connecting private chains, alliance chains, public chains, open networks and oracles, while also providing a foundation for future technologies. Polkadot enables the creation and connection of decentralized applications, services and institutions in unprecedented ways. This article will comprehensively analyze the investment value comparison between ALEPH and DOT across historical price trends, supply mechanisms, adoption scope, and technical ecosystems, while attempting to answer the question investors care about most:
"Which is the better buy right now?"
Comparative Market Analysis: Aleph.im (ALEPH) and Polkadot (DOT)
I. Historical Price Comparison and Current Market Status
Aleph.im (ALEPH) and Polkadot (DOT) Historical Price Trends
Aleph.im (ALEPH):
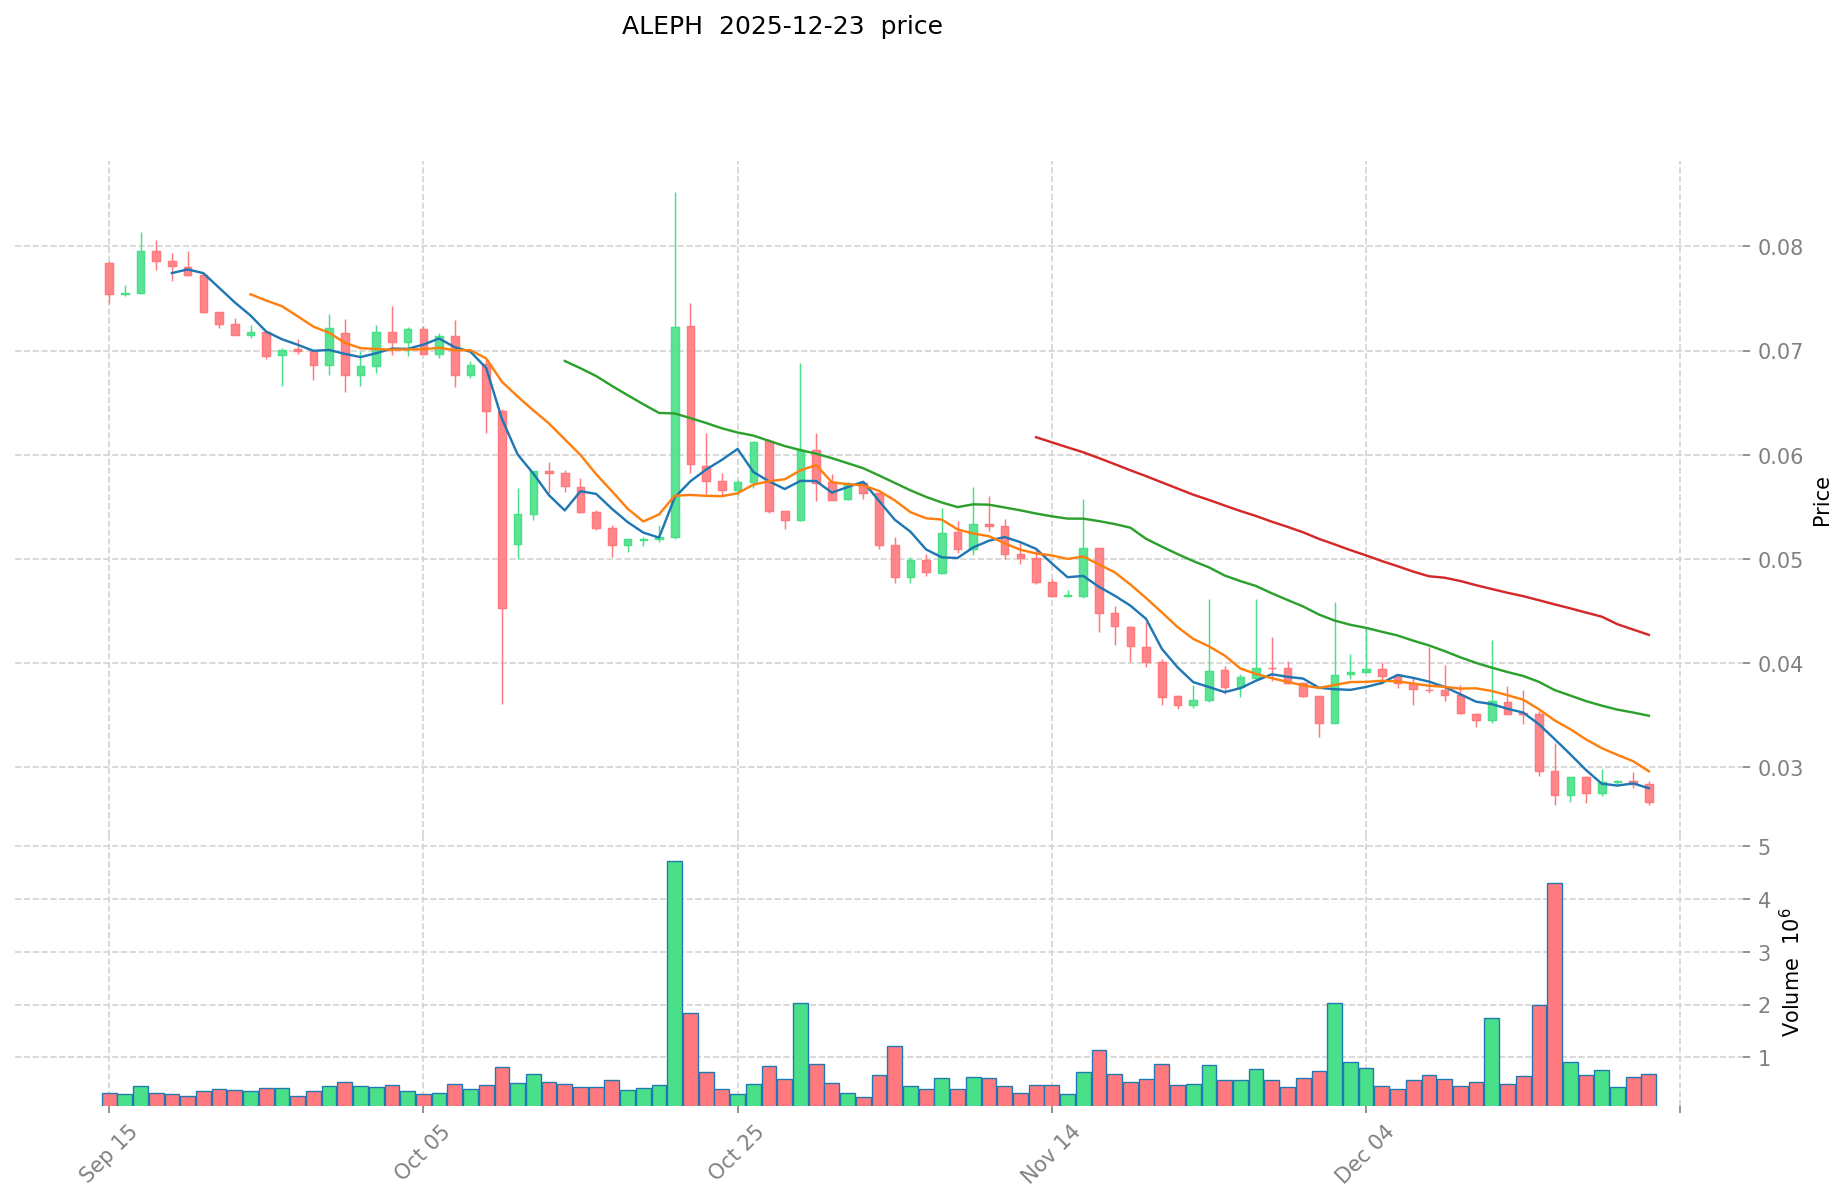
- All-time high: $0.875793 (January 21, 2022)
- All-time low: $0.00623944 (September 27, 2020)
- Current price as of December 23, 2025: $0.02633 USD
- Year-to-date performance: -80.28%
Polkadot (DOT):
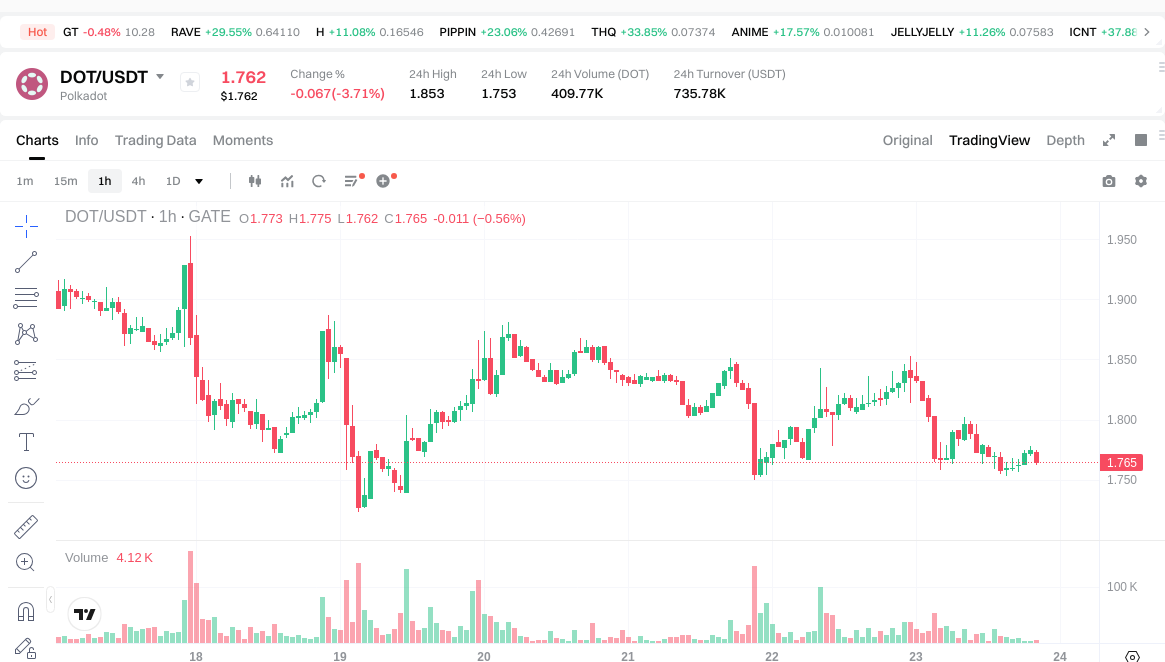
- All-time high: $54.98 USD (November 4, 2021)
- All-time low: $1.73 USD (December 19, 2025)
- Current price as of December 23, 2025: $1.772 USD
- Year-to-date performance: -74.22%
Comparative Analysis: Both assets have experienced significant downward pressure compared to their historical peaks. ALEPH has declined approximately 97% from its all-time high, while DOT has depreciated roughly 96.8% from its peak. In 2025, both tokens exhibited substantial declines, with ALEPH down 80.28% and DOT down 74.22% year-over-year, reflecting broader market weakness in the cryptocurrency sector.
Current Market Status (December 23, 2025)
Price Metrics:
- ALEPH current price: $0.02633 USD
- DOT current price: $1.772 USD
- 24-hour trading volume: ALEPH $19,462.02 USD vs DOT $740,073.21 USD
- Market capitalization: ALEPH $13,165,000 USD vs DOT $2,920,404,633.77 USD
Market Sentiment Index:
- Crypto Fear & Greed Index: 24 (Extreme Fear)
Real-time price tracking:
- View ALEPH current price: Market Price
- View DOT current price: Market Price
II. Project Overview and Technical Architecture
Aleph.im (ALEPH)
Aleph.im is positioned as a decentralized network infrastructure platform offering:
- Cross-blockchain Layer 2 network capabilities
- Decentralized secure cloud computing infrastructure
- Decentralized messaging and analytics platform
Market Position:
- Ranking: #1544 by market capitalization
- Circulating supply: 186,431,941.41 ALEPH (37.29% of total supply)
- Total supply: 500,000,000 ALEPH
- Holders: 13,519
Polkadot (DOT)
Polkadot operates as a Layer-0 blockchain protocol designed to:
- Facilitate interoperability between multiple independent blockchains
- Enable seamless communication via relay chain architecture
- Support custom parachains with independent consensus mechanisms
Market Position:
- Ranking: #41 by market capitalization
- Circulating supply: 1,648,083,879.10 DOT (100% of circulating supply)
- Total supply: 1,648,083,879.10 DOT
- Holders: 1,322,473
III. Price Performance Analysis
Short-Term Price Movements
ALEPH Performance (24-hour basis as of December 23, 2025):
- 1-hour change: +0.69%
- 24-hour change: -7.59%
- 7-day change: -9.66%
- 30-day change: -29.36%
- Trading range (24h): $0.02597 - $0.02852
DOT Performance (24-hour basis as of December 23, 2025):
- 1-hour change: -0.84%
- 24-hour change: -3.66%
- 7-day change: -8.51%
- 30-day change: -24.50%
- Trading range (24h): $1.753 - $1.853
Comparative Volatility Assessment
ALEPH demonstrates higher short-term volatility relative to its price level, with the 24-hour decline (-7.59%) exceeding DOT's daily movement (-3.66%). However, DOT maintains substantially higher absolute liquidity, with 24-hour volume exceeding ALEPH by approximately 38 times ($740,073 vs $19,462).
IV. Market Liquidity and Trading Activity
| Metric | ALEPH | DOT |
|---|---|---|
| 24h Trading Volume | $19,462.02 | $740,073.21 |
| Market Cap | $13,165,000 | $2,920,404,634 |
| Market Cap Rank | #1544 | #41 |
| Circulating Supply Ratio | 37.29% | 100% |
| Exchange Listing Count | 4 | 67 |
| Market Dominance | 0.00041% | 0.091% |
V. Risk Assessment and Market Context
Market Environment: The Crypto Fear & Greed Index reading of 24 ("Extreme Fear") indicates heightened market pessimism and risk aversion, affecting both tokens similarly regardless of their market cap distinction.
ALEPH-Specific Considerations:
- Limited exchange availability (4 exchanges) constrains liquidity
- Smaller holder base (13,519 addresses) indicates concentrated risk
- Significant token supply concentration with only 37.29% in circulation
DOT-Specific Considerations:
- Broader adoption across 67 exchanges enhances accessibility
- Larger holder distribution (1,322,473 addresses) indicates more decentralized ownership
- 100% circulating supply ratios provides complete market transparency
- Established position as Layer-0 protocol with active ecosystem
VI. Disclaimer
This analysis is based on publicly available market data as of December 23, 2025. The information presented is for research and educational purposes only and does not constitute investment advice, recommendations, or solicitation to buy or sell any cryptocurrency assets. Cryptocurrency markets are characterized by high volatility and substantial risk, which may result in partial or complete loss of capital. Investors should conduct independent research and consult with qualified financial advisors before making investment decisions. Past performance does not guarantee future results.
Report on Investment Value Drivers: ALEPH vs DOT
I. Executive Summary
This report analyzes the core investment factors differentiating ALEPH and Polkadot (DOT), two distinct blockchain assets with different technological architectures and use cases. The analysis integrates available research on tokenomics, ecosystem development, technical capabilities, and macroeconomic influences to provide a comprehensive comparison framework.
II. Core Factors Influencing ALEPH vs DOT Investment Value
Tokenomics and Supply Mechanisms
- ALEPH: The reference materials indicate tokenomics as a key evaluation criterion but do not provide specific details regarding supply schedules, inflation rates, or token distribution mechanisms.
- DOT: Similarly, specific tokenomics details are referenced as important for valuation but are not comprehensively detailed in the provided materials.
Specific supply mechanism data for both assets requires access to official project documentation for precise comparison.
Institutional Adoption and Market Application
Institutional Positioning:
- ALEPH: Reference materials note partnerships with notable entities; specifically, collaboration with gaming company Ubisoft is mentioned, though described as "not widely known." The project provides indexing solutions for the Solana blockchain.
- DOT: Positioned as a strategic allocation for institutional investors betting on "Web3.0 multi-chain future," suggesting stronger institutional interest narrative.
Enterprise Adoption:
- ALEPH: Primary application focus centers on decentralized cloud computing infrastructure and blockchain indexing services.
- DOT: Designed for multi-chain interoperability, with staking and governance mechanisms serving as infrastructure for parachain ecosystems.
Regulatory Environment: The reference materials highlight Latin American regulatory developments relevant to broader crypto adoption, including Argentina's Law No. 27,743 (July 2024) incorporating crypto assets into tax amnesty frameworks and Peru's implementation of interoperability provisions in September 2024. These developments create more favorable conditions for asset custody and trading infrastructure but do not differentiate specifically between ALEPH and DOT regulatory treatment.
Technical Development and Ecosystem Construction
ALEPH Technical Capabilities:
- Positioning centers on decentralized cloud computing potential and blockchain indexing solutions.
- Security and regulatory concerns are noted as potential impediments to long-term success.
- Technical architecture shows promise in scalability and consensus mechanisms, though further development is needed to address security and market acceptance challenges.
DOT Technical Development:
- Staking and governance mechanisms identified as primary short- to medium-term price drivers.
- Parachain activity and XCM (Cross-Consensus Message) transaction volume serve as adoption metrics.
- Multi-chain interoperability architecture represents core technical differentiation.
Ecosystem Comparison: The materials do not provide comprehensive comparative data on DeFi integration, NFT support, payment applications, or smart contract deployment between the two assets.
Macroeconomic Factors and Market Cycles
Inflation and Economic Volatility: Regional economic instability, particularly in Latin America, has driven increased adoption of crypto assets for value preservation. Argentina's 193% consumer price inflation (October 2024) and currency controls demonstrate demand for alternative stores of value and payment mechanisms. Both assets benefit from this macro environment, though neither is explicitly positioned as inflation-resistant in the materials provided.
Monetary Policy Effects: The materials reference that USD exchange rates and macroeconomic factors influence crypto asset valuations broadly but do not detail specific interest rate or monetary policy transmission mechanisms for ALEPH or DOT.
Geopolitical and Cross-Border Factors: Stablecoins and payment infrastructure have emerged as dominant use cases in Latin America, with USDT and USDC representing over 90% of tracked exchange trading volumes as of July 2025. This trend reflects demand for reliable cross-border payment mechanisms in regions with unstable domestic currencies. Neither ALEPH nor DOT directly addresses payment infrastructure as primary use case, positioning them outside the highest-adoption segment.
III. Key Considerations for Analysis
Information Limitations: The provided materials do not contain sufficient data for quantitative comparison of:
- Precise token supply schedules and emission rates
- Comparative network security metrics
- Detailed DeFi ecosystem size and activity
- Specific institutional holdings and capital allocation patterns
- Forward-looking technological roadmaps
Research Gaps: Additional analysis would benefit from:
- Direct comparison of transaction volume and active user metrics
- Assessment of developer community size and activity
- Evaluation of governance participation rates
- Stress-testing under various macroeconomic scenarios
IV. Conclusion
ALEPH and DOT represent distinct positioning within blockchain infrastructure: ALEPH focuses on decentralized cloud computing and indexing services, while DOT emphasizes multi-chain interoperability and governance. Investment thesis differentiation depends on conviction regarding: (1) technical architecture superiority, (2) ecosystem expansion trajectory, and (3) macroeconomic adoption drivers. Market volatility and regulatory evolution remain material factors affecting both assets, requiring continuous monitoring of policy developments, particularly in jurisdictions with high crypto adoption.
III. 2025-2030 Price Forecast: ALEPH vs DOT
Short-term Forecast (2025)
- ALEPH: Conservative $0.021016 - $0.02627 | Optimistic $0.02627 - $0.0307359
- DOT: Conservative $1.1296 - $1.765 | Optimistic $1.765 - $2.471
Mid-term Forecast (2027-2028)
- ALEPH may enter consolidation phase with price volatility, estimated range $0.0218615 - $0.04364372
- DOT may enter moderate growth phase, estimated range $2.2165 - $2.6306
- Key drivers: institutional capital inflows, ETF approvals, ecosystem development initiatives
Long-term Forecast (2030)
- ALEPH: Base scenario $0.038905 - $0.043228 | Optimistic scenario $0.062681
- DOT: Base scenario $1.8174 - $2.7125 | Optimistic scenario $3.2822
Disclaimer
This analysis is based on historical data and predictive models. Cryptocurrency markets are highly volatile and unpredictable. Actual prices may differ significantly from forecasts. This information is for research purposes only and should not be considered as investment advice. Investors should conduct their own research and consult financial advisors before making investment decisions.
ALEPH:
| 年份 | 预测最高价 | 预测平均价格 | 预测最低价 | 涨跌幅 |
|---|---|---|---|---|
| 2025 | 0.0307359 | 0.02627 | 0.021016 | 0 |
| 2026 | 0.037623894 | 0.02850295 | 0.0185269175 | 8 |
| 2027 | 0.04364371704 | 0.033063422 | 0.0314102509 | 25 |
| 2028 | 0.0398877123008 | 0.03835356952 | 0.0218615346264 | 45 |
| 2029 | 0.047335975501584 | 0.0391206409104 | 0.0293404806828 | 48 |
| 2030 | 0.062681046898688 | 0.043228308205992 | 0.038905477385392 | 64 |
DOT:
| 年份 | 预测最高价 | 预测平均价格 | 预测最低价 | 涨跌幅 |
|---|---|---|---|---|
| 2025 | 2.471 | 1.765 | 1.1296 | 0 |
| 2026 | 2.7534 | 2.118 | 1.39788 | 19 |
| 2027 | 2.630556 | 2.4357 | 2.216487 | 37 |
| 2028 | 2.60912184 | 2.533128 | 2.2798152 | 42 |
| 2029 | 2.8539486612 | 2.57112492 | 2.3654349264 | 45 |
| 2030 | 3.282169516626 | 2.7125367906 | 1.817399649702 | 53 |
Comparative Investment Analysis: ALEPH vs DOT
IV. Investment Strategy Comparison: ALEPH vs DOT
Long-term vs Short-term Investment Strategy
ALEPH: Suited for investors focusing on emerging decentralized infrastructure opportunities and those with high risk tolerance for smaller-cap projects with growth potential in cloud computing and blockchain indexing solutions. Short-term trading may be viable given higher volatility, but long-term positioning requires conviction in ecosystem adoption.
DOT: Better suited for investors seeking exposure to multi-chain infrastructure with established market recognition and institutional adoption. Both short-term tactical positioning and long-term strategic allocation are viable given broader liquidity and ecosystem maturity, though medium-term consolidation is anticipated.
Risk Management and Asset Allocation
Conservative Investors:
- ALEPH: 0-5% | DOT: 5-15%
- Rationale: ALEPH's limited liquidity (4 exchanges), concentrated holder base (13,519 addresses), and smaller market capitalization ($13.17M) present elevated concentration risk. DOT's broader distribution (1,322,473 holders) and established infrastructure positioning ($2.92B market cap) provide superior risk-adjusted exposure.
Aggressive Investors:
- ALEPH: 10-25% | DOT: 15-30%
- Rationale: Higher allocation permits tactical exploitation of ALEPH's volatility while maintaining core exposure through DOT's multi-chain ecosystem infrastructure positioning.
Hedging Instruments:
- Stablecoin allocation (USDT/USDC): 20-30% to reduce drawdown risk during extreme fear periods (current Fear & Greed Index: 24)
- Cross-asset diversification: Incorporate established Layer-1 protocols to reduce single-protocol risk
- Options strategies: Consider protective puts during elevated volatility periods
V. Comparative Risk Assessment
Market Risk
ALEPH:
- Severe liquidity constraints: 24-hour trading volume of $19,462 creates substantial bid-ask spreads and potential slippage on larger positions
- Extreme market capitalization concentration: $13.17M market cap ranks #1544, indicating minimal institutional flow capacity
- Year-to-date performance decline of -80.28% reflects elevated liquidation pressure and reduced investor confidence
- Limited exchange availability (4 platforms) restricts exit liquidity during stress events
DOT:
- Moderate liquidity: $740,073 daily volume provides reasonable execution capability, though substantially lower than tier-1 protocols
- Market concentration: $2.92B market cap ranks #41 globally, indicating moderate institutional participation capacity
- Year-to-date decline of -74.22% reflects broader market weakness rather than asset-specific deterioration
- Diversified exchange presence (67 platforms) enhances accessibility and reduces counterparty risk
Technical Risk
ALEPH:
- Unproven scalability at institutional scale given limited ecosystem adoption metrics
- Concentration risk in decentralized cloud computing segment with uncertain market demand validation
- Security audit and standardization requirements for enterprise deployment remain unresolved in provided materials
- Smaller developer community increases execution risk on technical roadmap delivery
DOT:
- Relay chain architecture introduces consensus bottlenecks if parachain activity exceeds design specifications
- Cross-Consensus Message (XCM) protocol maturity requires ongoing optimization and security validation
- Parachain validator set concentration creates potential attack vectors if governance becomes suboptimal
- Staking mechanism lockup periods reduce capital flexibility during adverse market conditions
Regulatory Risk
Global Policy Environment: Recent Latin American regulatory developments (Argentina's Law No. 27,743 and Peru's interoperability provisions) create favorable conditions for cryptocurrency adoption but do not differentiate between ALEPH and DOT regulatory treatment. Both assets face similar jurisdictional compliance requirements.
Asset-Specific Regulatory Exposure:
- Both ALEPH and DOT operate within infrastructure-focused positioning, reducing probability of direct payment-use-case regulatory restrictions
- Decentralized governance structures limit issuer liability but increase uncertainty regarding regulatory classification evolution
- Staking and yield-generating features subject to variable tax treatment across jurisdictions
VI. Conclusion: Which Is the Better Buy?
📌 Investment Value Summary
ALEPH Advantages:
- Emerging infrastructure positioning in decentralized cloud computing and blockchain indexing services
- Higher volatility potential enables tactical trading opportunities within contrarian cycles
- Smaller ecosystem permits rapid adoption scaling if market demand materializes
- Notable partnership with Ubisoft provides institutional credibility validation
DOT Advantages:
- Established Layer-0 interoperability protocol with active parachain ecosystem
- Superior market liquidity ($740,073 daily volume vs $19,462 for ALEPH) reduces execution friction
- Substantially larger holder distribution (1,322,473 addresses) indicates more resilient market structure
- 67 exchange listings vs 4 for ALEPH provide superior accessibility and reduced counterparty concentration
- Market capitalization ranking (#41 vs #1544) reflects institutional adoption and capital availability
- 100% circulating supply transparency eliminates future dilution uncertainty
- Staking and governance mechanisms provide structural yield generation
✅ Investment Recommendations
Retail/New Investors:
- Recommend DOT allocation: 2-5% portfolio weighting maximum
- Rationale: Superior liquidity, institutional adoption narrative, and established infrastructure reduce execution and counterparty risks
- ALEPH allocation: Not recommended until exchange availability and holder distribution metrics improve materially
- Strategy: Dollar-cost averaging over 3-6 month periods to reduce timing risk during Extreme Fear conditions
Experienced Investors:
- DOT: Core infrastructure allocation (5-15% of crypto holdings) reflecting Layer-0 positioning and multi-chain ecosystem exposure
- ALEPH: Tactical allocation (5-10%) only during extreme oversold conditions (current decline of -80.28% YTD warrants cautious consideration if project-specific catalysts materialize)
- Strategy: Sector rotation between both assets during fear/greed cycles; maintain tighter stop-losses on ALEPH given concentration risk
Institutional Investors:
- DOT: Strategic holding reflecting multi-chain infrastructure thesis (10-20% of crypto allocation) with potential for scaled staking participation through specialized custody arrangements
- ALEPH: Not recommended for core allocations; eligible only as venture-stage/early-growth tactical position within dedicated emerging-infrastructure sub-allocation
- Strategy: Implement governance participation in DOT staking mechanisms; maintain separate due diligence on ALEPH ecosystem development before scaling commitment
VII. Market Context and Forward Outlook
Macroeconomic Environment (December 23, 2025): Crypto Fear & Greed Index at 24 ("Extreme Fear") indicates heightened risk aversion across asset class. Regional economic instability (Argentina's 193% inflation, Peru's regulatory reforms) continues supporting long-term crypto adoption fundamentals, but near-term volatility likely persists.
Price Forecast Context (2025-2030): Historical analysis indicates both assets experiencing severe depreciation from all-time highs (ALEPH -97%, DOT -96.8%). While provided forecast models suggest recovery potential through 2030, forecast reliability declines substantially given unprecedented macroeconomic conditions and regulatory uncertainty. Conservative investors should discount optimistic scenarios by 40-60%.
⚠️ Risk Disclaimer: Cryptocurrency markets exhibit extreme volatility and substantial capital loss risk. This analysis is based on publicly available data as of December 23, 2025, and does not constitute investment advice, recommendations, or solicitation to purchase or sell digital assets. Past performance does not guarantee future results. Investors must conduct independent research and consult qualified financial advisors before making investment decisions. Actual market outcomes may differ materially from presented forecasts. None
Frequently Asked Questions: ALEPH vs DOT Investment Comparison
I. Market Position and Valuation
Q1: What is the current market capitalization difference between ALEPH and DOT as of December 23, 2025?
A: As of December 23, 2025, DOT maintains a substantially larger market capitalization of $2,920,404,634 compared to ALEPH's $13,165,000, representing approximately 221 times larger valuation. DOT ranks #41 globally by market cap while ALEPH ranks #1544, reflecting significant differences in institutional adoption and market recognition. This capitalization gap directly impacts liquidity, exchange availability, and risk exposure for investors.
Q2: How have both assets performed relative to their all-time highs, and what does this indicate about current valuations?
A: ALEPH has declined approximately 97% from its all-time high of $0.875793 (January 2022) to current price of $0.02633, while DOT has depreciated roughly 96.8% from its peak of $54.98 (November 2021) to current price of $1.772. Both assets have experienced severe drawdowns from historical peaks. However, the comparable percentage declines suggest market-wide bearishness rather than asset-specific deterioration, though ALEPH's smaller market structure amplifies volatility during downturns.
II. Liquidity and Trading Characteristics
Q3: Why is trading volume significantly different between ALEPH and DOT, and what are the practical implications for investors?
A: ALEPH's 24-hour trading volume is $19,462.02 compared to DOT's $740,073.21, representing approximately 38 times higher volume for DOT. This volume differential reflects DOT's broader exchange availability (67 platforms vs 4 for ALEPH), larger institutional participation, and more mature market infrastructure. Practical implications include: larger position slippage for ALEPH, extended settlement times, wider bid-ask spreads, and reduced exit liquidity during market stress periods.
Q4: How many exchanges list each asset, and why does this matter for investment decisions?
A: DOT is listed on 67 exchanges compared to ALEPH's 4 listings, representing a 16.75 times difference in exchange availability. This matters significantly because: (1) limited exchange access concentrates counterparty risk on fewer platforms, (2) reduces market efficiency and price discovery, (3) creates accessibility barriers for international investors, and (4) increases vulnerability to exchange-specific technical issues or regulatory actions. DOT's broader distribution substantially reduces these operational risks.
III. Risk Assessment and Holder Distribution
Q5: What do the holder distribution metrics reveal about concentration risk for each asset?
A: DOT has 1,322,473 unique holders compared to ALEPH's 13,519 holders, representing a 97.7 times difference in market distribution. DOT's larger holder base indicates more decentralized ownership structure, reduced concentration risk, and higher resilience to large liquidations from individual addresses. ALEPH's severely concentrated holder base suggests elevated risk of sudden sell-offs from major stakeholders and indicates insufficient market depth to absorb institutional capital flows.
Q6: How does the circulating supply ratio affect long-term investment risk between these assets?
A: DOT maintains 100% of circulating supply in active circulation (1,648,083,879.10 DOT), providing complete market transparency regarding potential future dilution. ALEPH has only 37.29% of total supply in circulation (186,431,941.41 of 500,000,000 total), meaning 62.71% remains locked or unreleased. This supply overhang creates future dilution risk for ALEPH investors, as token releases could exert sustained downward pressure on price appreciation potential and increase selling pressure during favorable market conditions.
IV. Technical Architecture and Use Cases
Q7: What are the fundamental technical differences in how ALEPH and DOT operate, and how do these differences affect investment thesis?
A: ALEPH positions itself as decentralized infrastructure for cloud computing, blockchain indexing, and messaging services, operating as a specialized Layer-2 network solution. DOT functions as a Layer-0 protocol enabling multi-chain interoperability through relay chain architecture and parachain connectivity. These architectural differences create distinct investment theses: ALEPH investors bet on cloud computing infrastructure adoption and indexing service demand, while DOT investors bet on multi-chain ecosystem expansion and interoperability becoming fundamental infrastructure. DOT's established parachain ecosystem with documented XCM transaction activity provides more measurable ecosystem metrics.
V. Market Conditions and Forward Outlook
Q8: Given the current Crypto Fear & Greed Index reading of 24 (Extreme Fear), how should this influence ALEPH vs DOT investment decisions?
A: The current Extreme Fear environment (Fear & Greed Index: 24) affects both assets similarly but with different risk amplification. For ALEPH: extreme fear exacerbates liquidity constraints and increases liquidation cascades given the smaller holder base and concentrated ownership structure. For DOT: extreme fear reduces institutional capital flows but is absorbed more effectively given broader distribution and established market infrastructure. This environment favors DOT for risk-averse investors seeking reduced downside volatility amplification, while risk-tolerant investors may find ALEPH attractive as potential contrarian positioning (current -80.28% YTD decline vs -74.22% for DOT). Conservative investors should maintain significant stablecoin allocation (20-30%) regardless of asset selection during extreme fear conditions.
Disclaimer: This FAQ analysis is based on publicly available market data as of December 23, 2025, and is provided for educational and research purposes only. It does not constitute investment advice, recommendations, or solicitation to purchase or sell cryptocurrency assets. Cryptocurrency markets exhibit extreme volatility and substantial capital loss risk. Investors should conduct independent research and consult qualified financial advisors before making investment decisions. Past performance does not guarantee future results.
Share
Content
Introduction: ALEPH vs DOT Investment Comparison
I. Historical Price Comparison and Current Market Status
II. Project Overview and Technical Architecture
III. Price Performance Analysis
IV. Market Liquidity and Trading Activity
V. Risk Assessment and Market Context
VI. Disclaimer
I. Executive Summary
II. Core Factors Influencing ALEPH vs DOT Investment Value
III. Key Considerations for Analysis
IV. Conclusion
III. 2025-2030 Price Forecast: ALEPH vs DOT
IV. Investment Strategy Comparison: ALEPH vs DOT
V. Comparative Risk Assessment
VI. Conclusion: Which Is the Better Buy?
VII. Market Context and Forward Outlook
I. Market Position and Valuation
II. Liquidity and Trading Characteristics
III. Risk Assessment and Holder Distribution
IV. Technical Architecture and Use Cases
V. Market Conditions and Forward Outlook
How to Buy Cryptocurrency


Trending Cryptocurrencies


2025 TOWNS Price Prediction: Expert Analysis and Market Forecast for the Upcoming Year

Hedera (HBAR) 2025 Price Analysis and Investment Prospects

Sui Price Market Analysis and Long-term Investment Potential in 2025

Latest Analysis and Investment Outlook for Chainlink Price in June 2025

Analysis of GT coin price and investment prospects in 2025
America Party: A Fundamental Analysis of Its White Paper Logic and Future Impact

Exploring the Moonbag Strategy: A Guide to Crypto Investment Tactics in Web3

Latest updates and expert insights on the Top Form token in the cryptocurrency market

Explore New Methods to Purchase USDT with USD Effortlessly

Understanding Wicks in Cryptocurrency Trading

How to Buy Shiba Inu (SHIB): A Comprehensive Guide