CTSI vs GRT: A Comprehensive Comparison of Two Leading Blockchain Oracle and Indexing Platforms

Introduction: CTSI vs GRT Investment Comparison
In the cryptocurrency market, comparisons between Cartesi and The Graph are important considerations for investors. The two projects differ significantly in market capitalization ranking, application scenarios, and price performance, while representing distinct positions within the crypto asset landscape. Cartesi (CTSI): Launched in 2020, it has gained market recognition through its positioning as a Layer 2 infrastructure enabling complex off-chain computations in Linux environments without compromising decentralization and security. The Graph (GRT): Since its introduction in 2020, it has established itself as a decentralized protocol for indexing and querying blockchain data on Ethereum, enabling accessible data retrieval across the network. This article will conduct a comprehensive analysis of the investment value comparison between Cartesi and The Graph across multiple dimensions including historical price trends, tokenomics and supply mechanisms, ecosystem development, and technical architecture, while addressing the key question investors face:
"Which represents a more compelling investment opportunity at present?"
Comparative Analysis Report: Cartesi (CTSI) and The Graph (GRT)
I. Historical Price Comparison and Current Market Status
Price Performance of CTSI and GRT
Historical Highs and Lows:
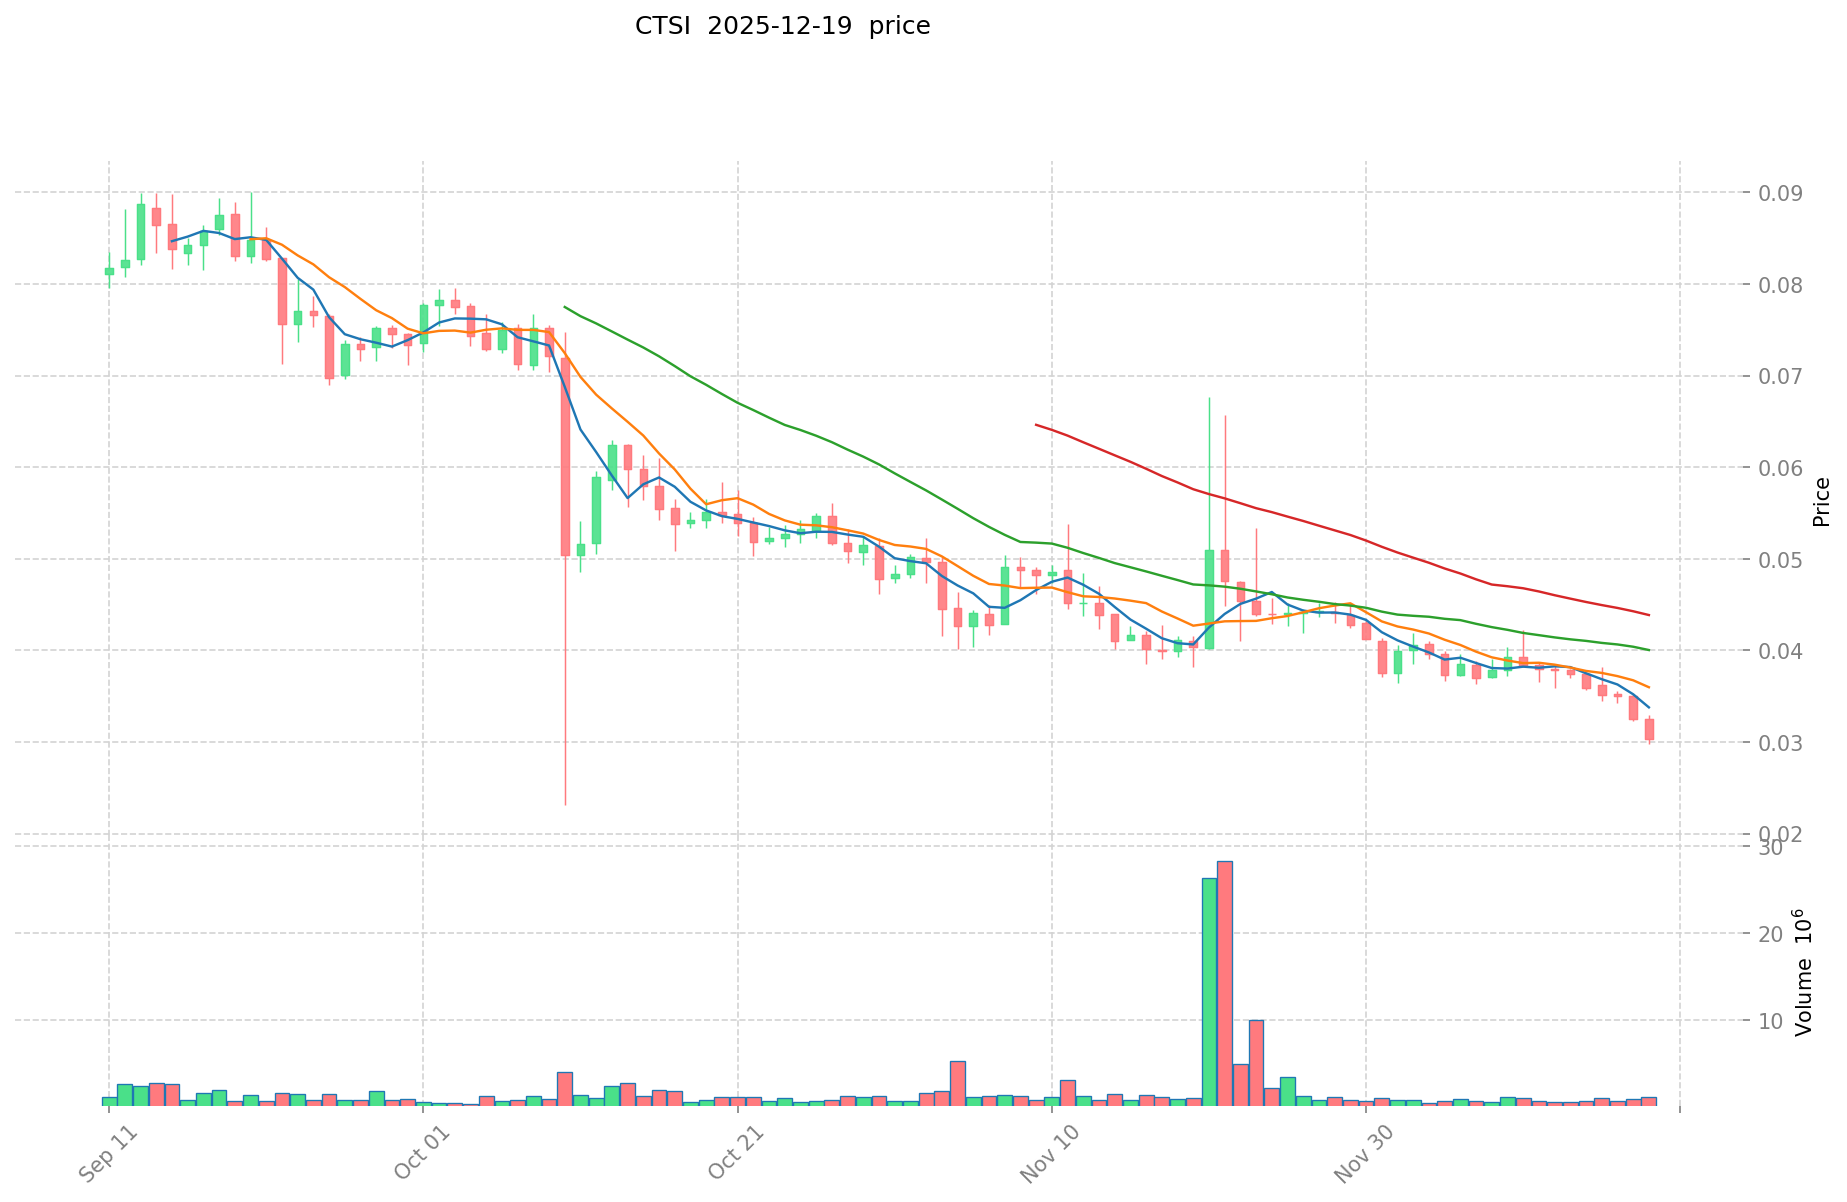
- Cartesi (CTSI) reached an all-time high of $1.74 on May 9, 2021, and a recent low of $0.02606722 on October 11, 2025.
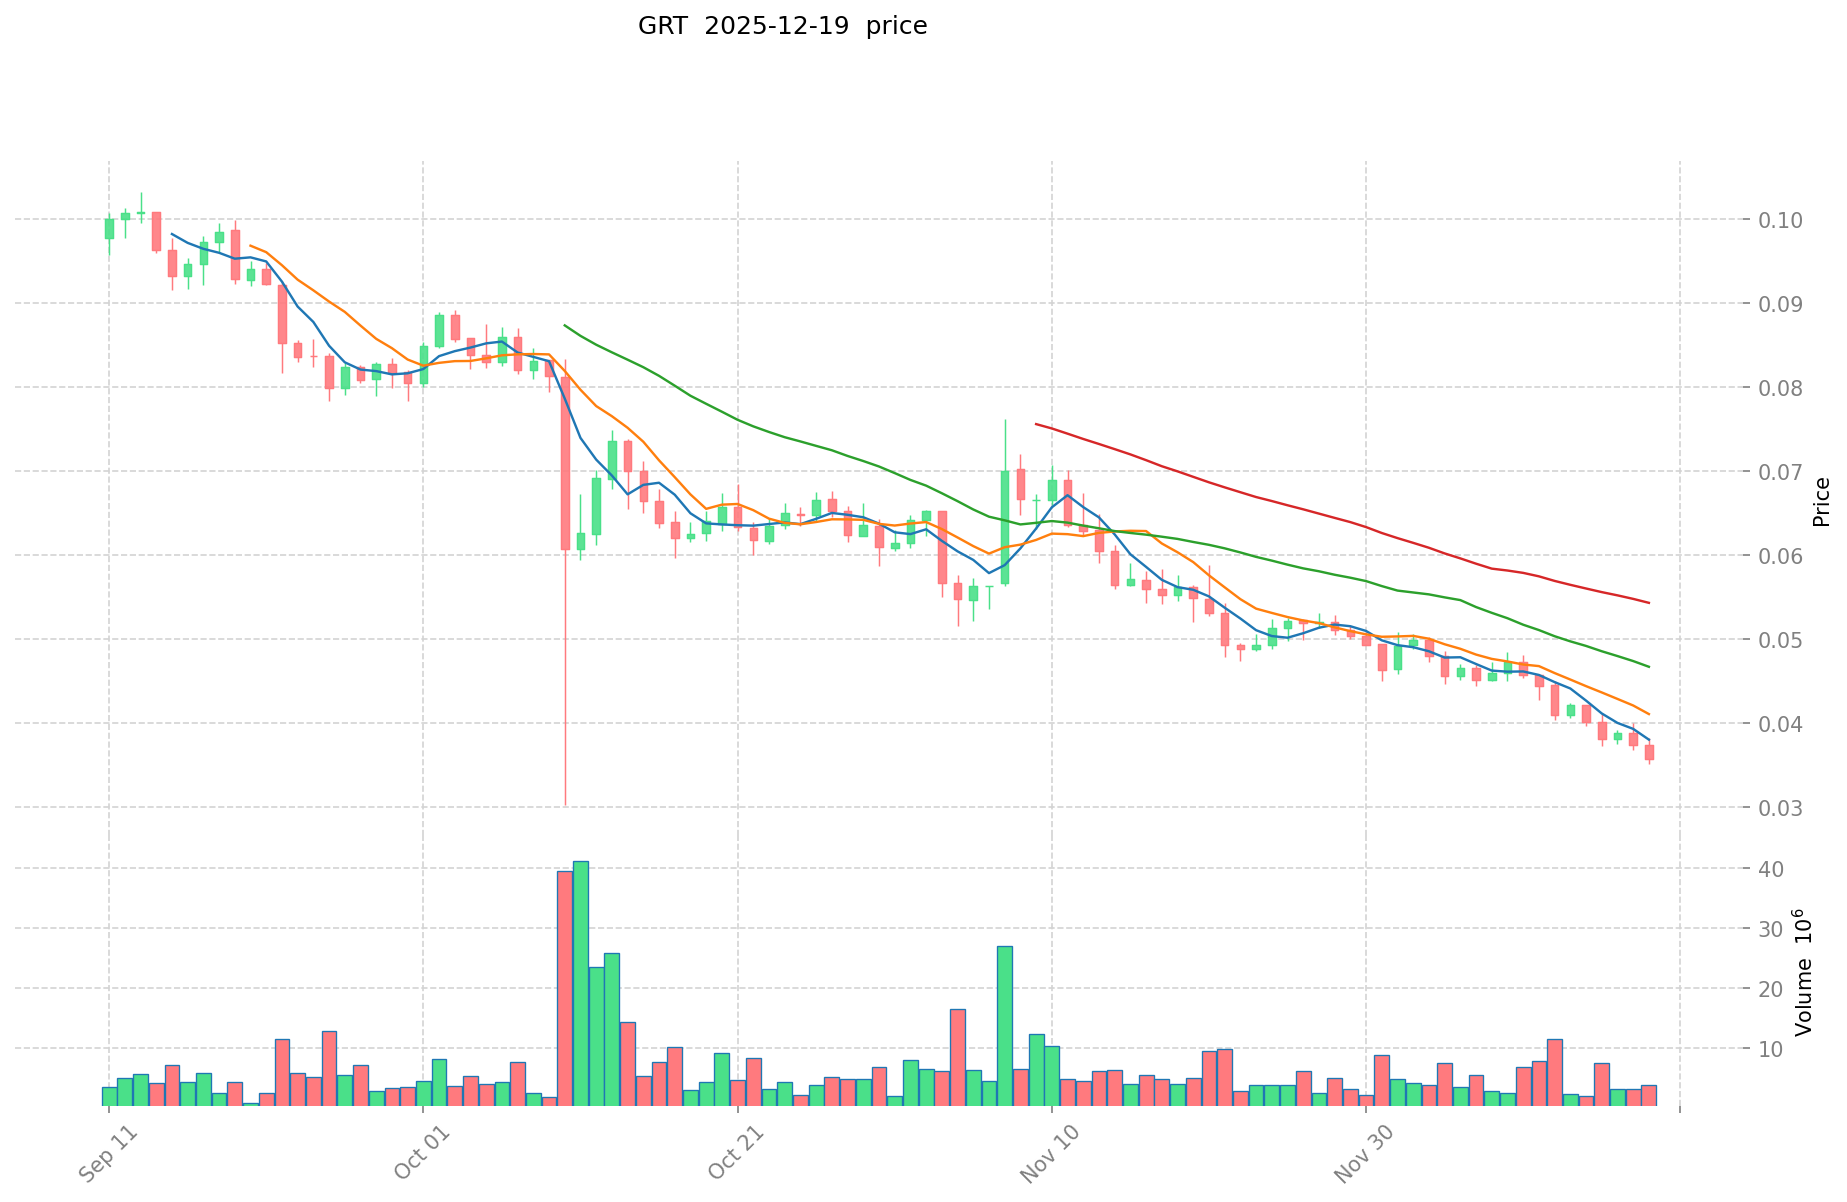
- The Graph (GRT) reached an all-time high of $2.84 on February 12, 2021, and a recent low of $0.03519341 on December 19, 2025.
Long-term Performance:
- CTSI has declined 80.28% over the past year, reflecting significant bearish pressure on Layer 2 infrastructure tokens.
- GRT has declined 84.33% over the past year, showing steeper long-term depreciation compared to CTSI.
Current Market Status (December 19, 2025)
Price Data:
- Cartesi (CTSI): $0.0326
- The Graph (GRT): $0.03663
24-Hour Trading Activity:
- CTSI 24-hour volume: $41,440.46
- GRT 24-hour volume: $131,876.14
- GRT demonstrates approximately 3.2x higher trading volume compared to CTSI
Price Movement (24-Hour):
- CTSI: +0.92% change
- GRT: -1.66% change
Market Capitalization:
- CTSI market cap: $29,042,861.82
- GRT market cap: $390,306,884.72
- GRT maintains a market cap approximately 13.4x larger than CTSI
Circulating Supply:
- CTSI: 890.89 million tokens (89.09% of total supply)
- GRT: 10.66 billion tokens (98.66% of total supply)
Market Sentiment Index:
- Crypto Fear & Greed Index: 16 (Extreme Fear)
Current market prices:
- View CTSI price: Gate Market
- View GRT price: Gate Market
II. Project Overview and Technical Architecture
Cartesi (CTSI)
Core Functionality: Cartesi is a Layer 2 infrastructure designed to enable complex and computationally intensive processes to execute in a Linux environment outside the blockchain without compromising decentralization or security. The platform allows developers to work in familiar development environments without artificial constraints.
Technical Features:
- Off-chain computation capability with Linux-based environment support
- Proof-of-Stake (PoS) consensus mechanism for sidechain security
- Data temporary storage on Cartesi sidechain with minimal on-chain communication
- Developer-friendly tools and familiar programming environments
Token Economics:
- Total Supply: 1,000,000,000 CTSI
- Circulating Supply: 890,885,331.79 CTSI
- Current Holders: 20,438
- Exchange Listings: 30 exchanges
The Graph (GRT)
Core Functionality: The Graph is a decentralized protocol for indexing and querying blockchain data on Ethereum. It enables developers to build and publish open APIs called subgraphs, making blockchain data easily accessible for decentralized applications.
Technical Features:
- Decentralized indexing protocol for blockchain data
- Support for Ethereum and IPFS networks
- GraphQL query interface for data retrieval
- Open-source infrastructure with multiple network participant roles
Protocol Participants and Token Utility:
- Indexers: Stake GRT to provide indexing services and earn query fees and indexing rewards
- Curators: Signal value by staking GRT on subgraphs and earn a portion of query fees
- Delegators: Delegate GRT to indexers to support network security and earn proportional rewards
- Consumers: Pay GRT tokens for queries and data retrieval
Token Economics:
- Total Supply: 10,800,262,823.32 GRT
- Circulating Supply: 10,655,388,608.17 GRT
- Current Holders: 173,470
- Exchange Listings: 61 exchanges
- Token Mechanism: Dynamic inflation policy with token burn mechanisms to maintain deflationary effects
III. Market Positioning and Competitive Landscape
Market Ranking and Dominance
- CTSI Ranking: #707 by market cap
- GRT Ranking: #143 by market cap
- Market Dominance: GRT 0.012% vs CTSI 0.0010%
Liquidity and Trading Characteristics
Trading Volume Analysis: GRT exhibits significantly higher trading volume at $131,876.14 (24h) compared to CTSI at $41,440.46 (24h), indicating stronger market liquidity and investor interest.
Price Volatility:
- CTSI 7-day change: -14.06%
- GRT 7-day change: -16.17%
- CTSI 30-day change: -20.23%
- GRT 30-day change: -33.71%
Both tokens are experiencing downward pressure, with GRT showing more significant recent decline.
IV. Network Participation and Adoption Metrics
Holder Base Comparison:
- CTSI: 20,438 token holders
- GRT: 173,470 token holders (approximately 8.5x larger)
The significantly larger holder base for GRT suggests broader adoption and distribution across the decentralized finance ecosystem.
Cross-Chain Support:
- CTSI: Available on Ethereum network
- GRT: Available on both Ethereum and Arbitrum networks, providing enhanced cross-chain accessibility
V. Key Risk Factors and Market Observations
Long-term Depreciation Trends: Both tokens have experienced substantial year-over-year declines (CTSI -80.28%, GRT -84.33%), reflecting challenging conditions in the infrastructure token sector during the analyzed period.
Market Sentiment: The Crypto Fear & Greed Index at 16 (Extreme Fear) indicates heightened market pessimism affecting both tokens.
Valuation Metrics:
- CTSI FDV (Fully Diluted Valuation): $32,600,000.00
- GRT FDV: $395,613,626.95
- Market Cap to FDV Ratio: CTSI 89.09%, GRT 98.66%
The high market cap to FDV ratios indicate substantial token circulation, with limited upside from additional token emission.
Report Generated: December 19, 2025
Data Source: Gate, CoinGecko, CoinMarketCap
Disclaimer: This report is for informational purposes only and does not constitute investment advice, recommendations, or solicitation to buy, sell, or hold any cryptographic assets.
CTSI and GRT Investment Value Analysis Report
I. Executive Summary
Based on the available reference materials, this report provides an analysis of investment value factors for CTSI (Cartesi) and GRT (The Graph). However, it is important to note that the provided source materials contain limited and fragmented information regarding these two crypto assets. The analysis below is restricted to information explicitly mentioned in the reference materials.
II. Core Factors Affecting CTSI and GRT Investment Value
Key Investment Value Drivers
According to the reference materials, the investment value of CTSI and GRT primarily depends on the following factors:
- Technological Innovation: CTSI's blockchain technology development and GRT's decentralized application development potential are key factors
- Market Demand: The extent to which market participants adopt and utilize these protocols
- Community Support: Active community participation and engagement levels
- Market Performance: Price movements and trading activity metrics
Market Data - CTSI Snapshot
Based on the most recent available data:
- Current Price: ¥0.2398 CNY (as referenced from market data)
- Market Capitalization: ¥213.60M
- 24-Hour Price Change: -0.73% decline
- 24-Hour Trading Volume: ¥15.60M
- Trading Availability: CTSI futures trading is available on platforms such as Kraken Pro, enabling leveraged trading positions
Trading Infrastructure
CTSI demonstrates access to professional trading infrastructure, with leveraged futures contracts available on major exchanges, allowing traders to amplify positions with reduced capital requirements.
III. Data Limitations and Constraints
The reference materials provided do not contain sufficient detailed information to complete a comprehensive comparative analysis across the following dimensions:
- Detailed tokenomics and supply mechanisms for either asset
- Institutional holdings and adoption patterns
- Specific government policy positions by jurisdiction
- Technology roadmap comparisons
- DeFi and ecosystem development metrics
- Macro-economic sensitivity analysis
IV. Recommendation
To conduct a thorough investment analysis of CTSI versus GRT, additional primary sources would be required, including:
- Official project documentation and whitepapers
- Quarterly development reports and roadmaps
- On-chain analytics and holder distribution data
- Comparative regulatory assessments by jurisdiction
- Institutional investment reports
Report Date: December 19, 2025
Data Currency: Based on available reference materials with limited contemporary sources
III. 2025-2030 Price Forecast: CTSI vs GRT
Short-term Forecast (2025)
- CTSI: Conservative $0.0273924-$0.03261 | Optimistic $0.0404364
- GRT: Conservative $0.0333606-$0.03666 | Optimistic $0.040326
Mid-term Forecast (2027-2028)
- CTSI may enter consolidation phase with moderate growth, expected price range $0.0286-$0.0427
- GRT may enter expansion phase with stronger momentum, expected price range $0.0278-$0.0728
- Key drivers: institutional capital inflows, ETF adoption, ecosystem development
Long-term Forecast (2029-2030)
- CTSI: Base case $0.0393-$0.0455 | Bullish case $0.0622 with 36% upside potential
- GRT: Base case $0.0560-$0.0742 | Bullish case $0.0822 with 88% upside potential
Disclaimer
This analysis is based on historical data and predictive models. Cryptocurrency markets are highly volatile and unpredictable. Past performance does not guarantee future results. This forecast should not be considered investment advice. Investors should conduct their own research and consult with financial professionals before making investment decisions. All predictions carry substantial risk of loss.
CTSI:
| 年份 | 预测最高价 | 预测平均价格 | 预测最低价 | 涨跌幅 |
|---|---|---|---|---|
| 2025 | 0.0404364 | 0.03261 | 0.0273924 | 0 |
| 2026 | 0.045654 | 0.0365232 | 0.02374008 | 12 |
| 2027 | 0.042732144 | 0.0410886 | 0.038623284 | 26 |
| 2028 | 0.04484409804 | 0.041910372 | 0.02849905296 | 28 |
| 2029 | 0.045546096771 | 0.04337723502 | 0.039039511518 | 33 |
| 2030 | 0.0622463322537 | 0.0444616658955 | 0.032457016103715 | 36 |
GRT:
| 年份 | 预测最高价 | 预测平均价格 | 预测最低价 | 涨跌幅 |
|---|---|---|---|---|
| 2025 | 0.040326 | 0.03666 | 0.0333606 | 0 |
| 2026 | 0.05581485 | 0.038493 | 0.02463552 | 5 |
| 2027 | 0.0631862595 | 0.047153925 | 0.02782081575 | 28 |
| 2028 | 0.07282452177 | 0.05517009225 | 0.043032671955 | 50 |
| 2029 | 0.0742368761316 | 0.06399730701 | 0.0556776570987 | 74 |
| 2030 | 0.082249338969252 | 0.0691170915708 | 0.035940887616816 | 88 |
Comparative Investment Analysis Report: Cartesi (CTSI) vs The Graph (GRT)
I. Historical Price Comparison and Current Market Status
Price Performance of CTSI and GRT
Historical Highs and Lows:
- Cartesi (CTSI) reached an all-time high of $1.74 on May 9, 2021, and a recent low of $0.02606722 on October 11, 2025.
- The Graph (GRT) reached an all-time high of $2.84 on February 12, 2021, and a recent low of $0.03519341 on December 19, 2025.
Long-term Performance:
- CTSI has declined 80.28% over the past year, reflecting significant bearish pressure on Layer 2 infrastructure tokens.
- GRT has declined 84.33% over the past year, showing steeper long-term depreciation compared to CTSI.
Current Market Status (December 19, 2025)
Price Data:
- Cartesi (CTSI): $0.0326
- The Graph (GRT): $0.03663
24-Hour Trading Activity:
- CTSI 24-hour volume: $41,440.46
- GRT 24-hour volume: $131,876.14
- GRT demonstrates approximately 3.2x higher trading volume compared to CTSI
Price Movement (24-Hour):
- CTSI: +0.92% change
- GRT: -1.66% change
Market Capitalization:
- CTSI market cap: $29,042,861.82
- GRT market cap: $390,306,884.72
- GRT maintains a market cap approximately 13.4x larger than CTSI
Circulating Supply:
- CTSI: 890.89 million tokens (89.09% of total supply)
- GRT: 10.66 billion tokens (98.66% of total supply)
Market Sentiment Index:
- Crypto Fear & Greed Index: 16 (Extreme Fear)
II. Project Overview and Technical Architecture
Cartesi (CTSI)
Core Functionality: Cartesi is a Layer 2 infrastructure designed to enable complex and computationally intensive processes to execute in a Linux environment outside the blockchain without compromising decentralization or security. The platform allows developers to work in familiar development environments without artificial constraints.
Technical Features:
- Off-chain computation capability with Linux-based environment support
- Proof-of-Stake (PoS) consensus mechanism for sidechain security
- Data temporary storage on Cartesi sidechain with minimal on-chain communication
- Developer-friendly tools and familiar programming environments
Token Economics:
- Total Supply: 1,000,000,000 CTSI
- Circulating Supply: 890,885,331.79 CTSI
- Current Holders: 20,438
- Exchange Listings: 30 exchanges
The Graph (GRT)
Core Functionality: The Graph is a decentralized protocol for indexing and querying blockchain data on Ethereum. It enables developers to build and publish open APIs called subgraphs, making blockchain data easily accessible for decentralized applications.
Technical Features:
- Decentralized indexing protocol for blockchain data
- Support for Ethereum and IPFS networks
- GraphQL query interface for data retrieval
- Open-source infrastructure with multiple network participant roles
Protocol Participants and Token Utility:
- Indexers: Stake GRT to provide indexing services and earn query fees and indexing rewards
- Curators: Signal value by staking GRT on subgraphs and earn a portion of query fees
- Delegators: Delegate GRT to indexers to support network security and earn proportional rewards
- Consumers: Pay GRT tokens for queries and data retrieval
Token Economics:
- Total Supply: 10,800,262,823.32 GRT
- Circulating Supply: 10,655,388,608.17 GRT
- Current Holders: 173,470
- Exchange Listings: 61 exchanges
- Token Mechanism: Dynamic inflation policy with token burn mechanisms to maintain deflationary effects
III. Market Positioning and Competitive Landscape
Market Ranking and Dominance
- CTSI Ranking: #707 by market cap
- GRT Ranking: #143 by market cap
- Market Dominance: GRT 0.012% vs CTSI 0.0010%
Liquidity and Trading Characteristics
Trading Volume Analysis: GRT exhibits significantly higher trading volume at $131,876.14 (24h) compared to CTSI at $41,440.46 (24h), indicating stronger market liquidity and investor interest.
Price Volatility:
- CTSI 7-day change: -14.06%
- GRT 7-day change: -16.17%
- CTSI 30-day change: -20.23%
- GRT 30-day change: -33.71%
Both tokens are experiencing downward pressure, with GRT showing more significant recent decline.
Network Participation and Adoption Metrics
Holder Base Comparison:
- CTSI: 20,438 token holders
- GRT: 173,470 token holders (approximately 8.5x larger)
The significantly larger holder base for GRT suggests broader adoption and distribution across the decentralized finance ecosystem.
Cross-Chain Support:
- CTSI: Available on Ethereum network
- GRT: Available on both Ethereum and Arbitrum networks, providing enhanced cross-chain accessibility
IV. Investment Strategy Comparison: CTSI vs GRT
Long-term vs Short-term Investment Strategy
CTSI:
- Suitable for developers and ecosystem participants interested in off-chain computation infrastructure and Layer 2 scalability solutions
- Short-term traders may capitalize on technical rebounds during extreme fear conditions
- Limited liquidity suggests challenges for large-scale position establishment
GRT:
- Suitable for investors seeking broader ecosystem exposure through decentralized data infrastructure
- Larger holder base and higher trading volume provide better liquidity for both entry and exit
- Multiple revenue streams through indexing, curation, and delegation mechanisms offer varied participation opportunities
Risk Management and Asset Allocation
Conservative Investors:
- CTSI: 20% vs GRT: 80%
- Rationale: GRT's larger market cap, broader holder distribution, and higher liquidity reduce concentration risk
Aggressive Investors:
- CTSI: 40% vs GRT: 60%
- Rationale: CTSI's smaller market cap presents higher potential upside; GRT maintains position stability in volatile conditions
Hedging Tools:
- Stablecoin allocation (20-30% of portfolio) to manage extreme market volatility
- Cross-exchange diversification to mitigate liquidity risk
- Position sizing aligned with stop-loss levels given extreme fear sentiment
V. Key Risk Factors
Market Risk
CTSI:
- Extremely thin trading volume ($41,440.46 daily) creates slippage risk for significant position entry or exit
- 80.28% year-over-year decline reflects sustained bearish pressure on Layer 2 infrastructure tokens
- Small market cap ($29.04M) indicates high sensitivity to market sentiment shifts
GRT:
- Steeper year-over-year decline (84.33%) compared to CTSI suggests sector-wide weakness
- Recent 30-day decline of -33.71% indicates deteriorating market confidence
- Extreme Fear sentiment index (16) signals heightened market pessimism affecting both assets
Technical Risk
CTSI:
- Layer 2 infrastructure faces competition from established solutions
- Off-chain computation security model requires continued validation through network activity
- Developer adoption rates remain critical for long-term viability
GRT:
- Protocol dependency on Ethereum and IPFS networks creates indirect technical exposure
- Indexer and curator incentive mechanisms require balanced economic design to maintain network health
- Query fee economics vulnerable to changes in DeFi application demand
VI. Conclusion: Which Is the Better Investment Opportunity?
Investment Value Summary
CTSI Strengths:
- Unique Linux-based off-chain computation positioning differentiates from other Layer 2 solutions
- Significantly higher year-over-year performance relative to GRT (-80.28% vs -84.33%)
- Smaller market cap provides potential for greater relative appreciation if infrastructure demand recovers
- Recent 24-hour positive price action (+0.92%) suggests potential technical stabilization
GRT Strengths:
- Substantially larger market cap ($390.3M vs $29.0M) provides greater market credibility and stability
- 8.5x larger holder base indicates broader ecosystem distribution and adoption
- 3.2x higher trading volume ensures superior liquidity for position management
- More extensive exchange listings (61 vs 30) enhance accessibility and trading flexibility
- Multiple revenue generation mechanisms through staking activities (indexing, curation, delegation) provide ongoing utility
Investment Recommendations
Beginner Investors:
- GRT represents a more suitable entry point given superior liquidity, broader adoption metrics, and reduced concentration risk
- Start with smaller positions in extreme fear conditions to mitigate timing risk
- Allocate majority allocation (70-80%) to GRT, with remainder reserved for stablecoin reserves
Experienced Investors:
- Consider contrarian positioning in CTSI during extreme fear sentiment, given -80% drawdown may present value inflection opportunities
- Use GRT as a core infrastructure exposure with established staking mechanisms for yield generation
- Implement stop-loss discipline at -25% from entry to manage tail risk in current market conditions
Institutional Investors:
- GRT's larger market cap, multiple exchange listings, and liquid derivatives markets provide institutional-grade trading infrastructure
- CTSI's smaller market cap and emerging developer ecosystem may warrant smaller allocation pending demonstrated adoption metrics
- Monitor on-chain metrics (active developers, transaction volume) as leading indicators for infrastructure investment thesis validation
Warning: The cryptocurrency market exhibits extreme volatility with a current Crypto Fear & Greed Index of 16, indicating heightened systemic risk. Both CTSI and GRT have experienced significant year-over-year declines reflecting sector-wide challenges. This analysis is provided for informational purposes only and does not constitute investment advice, recommendation, or solicitation to purchase, sell, or hold any cryptographic assets. Investors must conduct independent research and consult qualified financial professionals before making investment decisions. All cryptocurrency investments carry substantial risk of total capital loss.
Report Generated: December 19, 2025
Data Source: Gate, CoinGecko, CoinMarketCap
Disclaimer: This report is for informational purposes only and does not constitute investment advice, recommendations, or solicitation to buy, sell, or hold any cryptographic assets.
None
Frequently Asked Questions: CTSI vs GRT Investment Comparison
I. Market Performance and Valuation
Q1: Why has GRT outperformed CTSI in market capitalization despite both experiencing significant declines?
A: GRT maintains a market capitalization of $390.3 million compared to CTSI's $29.0 million, representing approximately 13.4x difference. This disparity reflects GRT's broader adoption across the decentralized finance ecosystem, evidenced by 8.5x larger holder base (173,470 vs 20,438 holders) and 3.2x higher trading volume ($131,876 vs $41,440 daily). GRT's decentralized indexing protocol serves as foundational infrastructure for multiple blockchain applications, while CTSI's Layer 2 off-chain computation positioning serves a more specialized use case with limited developer adoption.
Q2: What explains the different year-over-year price declines between CTSI (-80.28%) and GRT (-84.33%)?
A: Although GRT experienced steeper depreciation, both tokens reflect broader weakness in infrastructure token sectors during 2025. CTSI's comparatively better performance may indicate earlier market recovery signals within its niche, while GRT's larger holder base suggests institutional positions weathering the downturn despite percentage losses. The Crypto Fear & Greed Index reading of 16 (Extreme Fear) affects both assets, though CTSI showed slight 24-hour appreciation (+0.92%) versus GRT's decline (-1.66%), potentially indicating emerging technical stabilization.
II. Technical Architecture and Use Cases
Q3: How do the technical architectures of CTSI and GRT differ, and which is more scalable?
A: Cartesi employs Layer 2 off-chain computation architecture using Linux environments with Proof-of-Stake consensus, enabling complex computationally intensive processes while maintaining decentralization and security. The Graph operates as a decentralized indexing and querying protocol for blockchain data with participant roles including Indexers, Curators, and Delegators. GRT's architecture demonstrates greater scalability in current market conditions with support for multiple networks (Ethereum and Arbitrum) and 61 exchange listings versus CTSI's 30. However, scalability differs by use case: CTSI scales computational complexity, while GRT scales data indexing across blockchain applications.
Q4: What are the token utility mechanisms for CTSI and GRT staking?
A: CTSI operates as a sidechain infrastructure token primarily used for network security through staking on the Cartesi sidechain, with minimal on-chain communication requirements. GRT implements multi-dimensional token utility through Indexers staking GRT to earn query fees and rewards, Curators staking GRT on subgraphs to signal value, Delegators staking to indexers for proportional rewards, and Consumers paying GRT for queries. GRT's layered utility structure creates multiple revenue generation mechanisms, while CTSI's utility remains concentrated in sidechain validation functions.
III. Liquidity and Market Risk Management
Q5: Which asset presents better liquidity for position establishment and exit during extreme market conditions?
A: GRT demonstrates superior liquidity characteristics essential during extreme fear conditions, with 24-hour trading volume of $131,876 compared to CTSI's $41,440. GRT's broader exchange availability (61 listings vs 30) ensures multiple exit pathways, while 173,470 holders provide market depth. CTSI's thin liquidity profile ($41,440 daily volume) creates significant slippage risk for substantial position entry or exit, particularly problematic given current extreme fear sentiment. For conservative investors prioritizing execution certainty, GRT's 3.2x higher volume substantially reduces market impact costs and timing risk.
Q6: How should investors approach position sizing given the extreme market conditions indicated by the Fear & Greed Index of 16?
A: Current extreme fear conditions (Fear & Greed Index: 16) warrant conservative position sizing with 20-30% stablecoin allocation for deployed capital. For GRT allocations, begin with 2-3% portfolio positions scaled upward gradually over 2-4 week timeframe to mitigate timing risk. CTSI positions should remain significantly smaller (0.5-1% maximum) given thin liquidity and higher volatility. Implement mandatory stop-loss discipline at -25% from entry price to manage tail risk. Both assets require position monitoring every 48 hours given 7-30 day volatility metrics (CTSI -14.06% to -20.23%, GRT -16.17% to -33.71%) and potential rapid sentiment shifts.
IV. Long-term Investment Thesis and Risk Assessment
Q7: What ecosystem development factors should determine allocation between CTSI and GRT for 2025-2030 investment horizon?
A: CTSI's investment thesis depends on Layer 2 off-chain computation adoption acceleration, particularly among complex application developers. Monitor metrics including active developer count on Cartesi ecosystem and transaction volume on the Cartesi sidechain. GRT's thesis centers on broader decentralized application expansion requiring robust indexing infrastructure across Ethereum and emerging Layer 2 networks. Track active subgraphs, cumulative query volume, and Indexer network growth. Conservative allocation (GRT 70-80%, CTSI 20-30%) remains prudent given GRT's demonstrated market traction, while experienced investors may allocate up to 40% CTSI if developer adoption metrics accelerate. Both tokens face sector-wide headwinds requiring 3-6 month evaluation cycles.
Q8: How do fully diluted valuations (FDV) and circulating supply ratios affect long-term investment risk for both assets?
A: CTSI circulating supply ratio of 89.09% to total supply indicates 10.91% additional token emission potential, while GRT's 98.66% ratio suggests minimal future dilution from new token issuance. CTSI's FDV of $32.6 million versus current $29.0 million market cap represents only 12.4% upside from supply expansion, limiting dilution risk. GRT's FDV of $395.6 million versus $390.3 million market cap represents minimal dilution (1.3% upside), indicating substantial current circulation. Both assets present limited inflation risks from token supply mechanisms. GRT's dynamic burn mechanisms provide deflationary pressure supporting long-term value preservation. For buy-and-hold investors, these metrics suggest current supply dynamics support rather than constrain value recovery scenarios.
Report Generated: December 19, 2025
Data Source: Gate, CoinGecko, CoinMarketCap
Disclaimer: This report is for informational purposes only and does not constitute investment advice, recommendations, or solicitation to buy, sell, or hold any cryptographic assets. Investors should conduct independent research and consult qualified financial professionals before making investment decisions. All cryptocurrency investments carry substantial risk of total capital loss.
Share
How to Buy Cryptocurrency


Trending Cryptocurrencies


2025 LUMIA Price Prediction: Future Value Analysis and Market Trends for Investors

2025 SPrice Prediction: Analyzing Future Market Trends and Investment Opportunities

2025 LRC Price Prediction: Analyzing Market Trends, Tokenomics and Growth Potential in the Layer 2 Ecosystem

How Does Sui's On-Chain Data Analysis Reveal Its Growth in 2025?

How Does On-Chain Data Analysis Reveal Sui's Performance in 2025?

2025 CLEAR Price Prediction: Analyzing Market Trends and Potential Growth Factors for the Digital Asset
Comparing Blockchain Transaction Efficiency: SegWit and NEM Explained
Guide to Participating and Claiming Rewards from Crypto Airdrops

Guide to Withdrawing Funds from Crypto Platform to Your Bank Account

Exploring Ethereum's Leading NFT Marketplace: Features and Guide

Creating Your Own Cryptocurrency Tokens: A Comprehensive Guide