KARRAT vs TRX: A Comprehensive Comparison of Two Leading Blockchain Platforms

Introduction: KARRAT vs TRX Investment Comparison
In the cryptocurrency market, the comparison between KARRAT and TRX has always been a topic that investors cannot ignore. The two differ significantly in market capitalization ranking, application scenarios, and price performance, and represent different positioning of crypto assets. KARRAT (KARRAT): Since its launch in April 2024, it has gained market recognition by providing decentralized gaming infrastructure solutions supported by a truly decentralized community, spanning gaming, entertainment, and AI innovations. TRX (TRX): Since its inception in May 2017, it has been recognized as a large public blockchain that entered into partnership with sovereign states to develop blockchain infrastructure, and officially entered the era of decentralized stablecoins with the launch of USDD in May 2022. This article will conduct a comprehensive analysis of the investment value comparison between KARRAT and TRX from multiple dimensions including historical price trends, supply mechanisms, ecosystem development, and market positioning, attempting to answer the most pressing question investors face:
"Which is the better buy right now?"
Crypto Asset Comparative Analysis Report: KARRAT vs. TRON
I. Price History Comparison and Current Market Status
KARRAT and TRON Historical Price Trends
KARRAT (KARRAT):
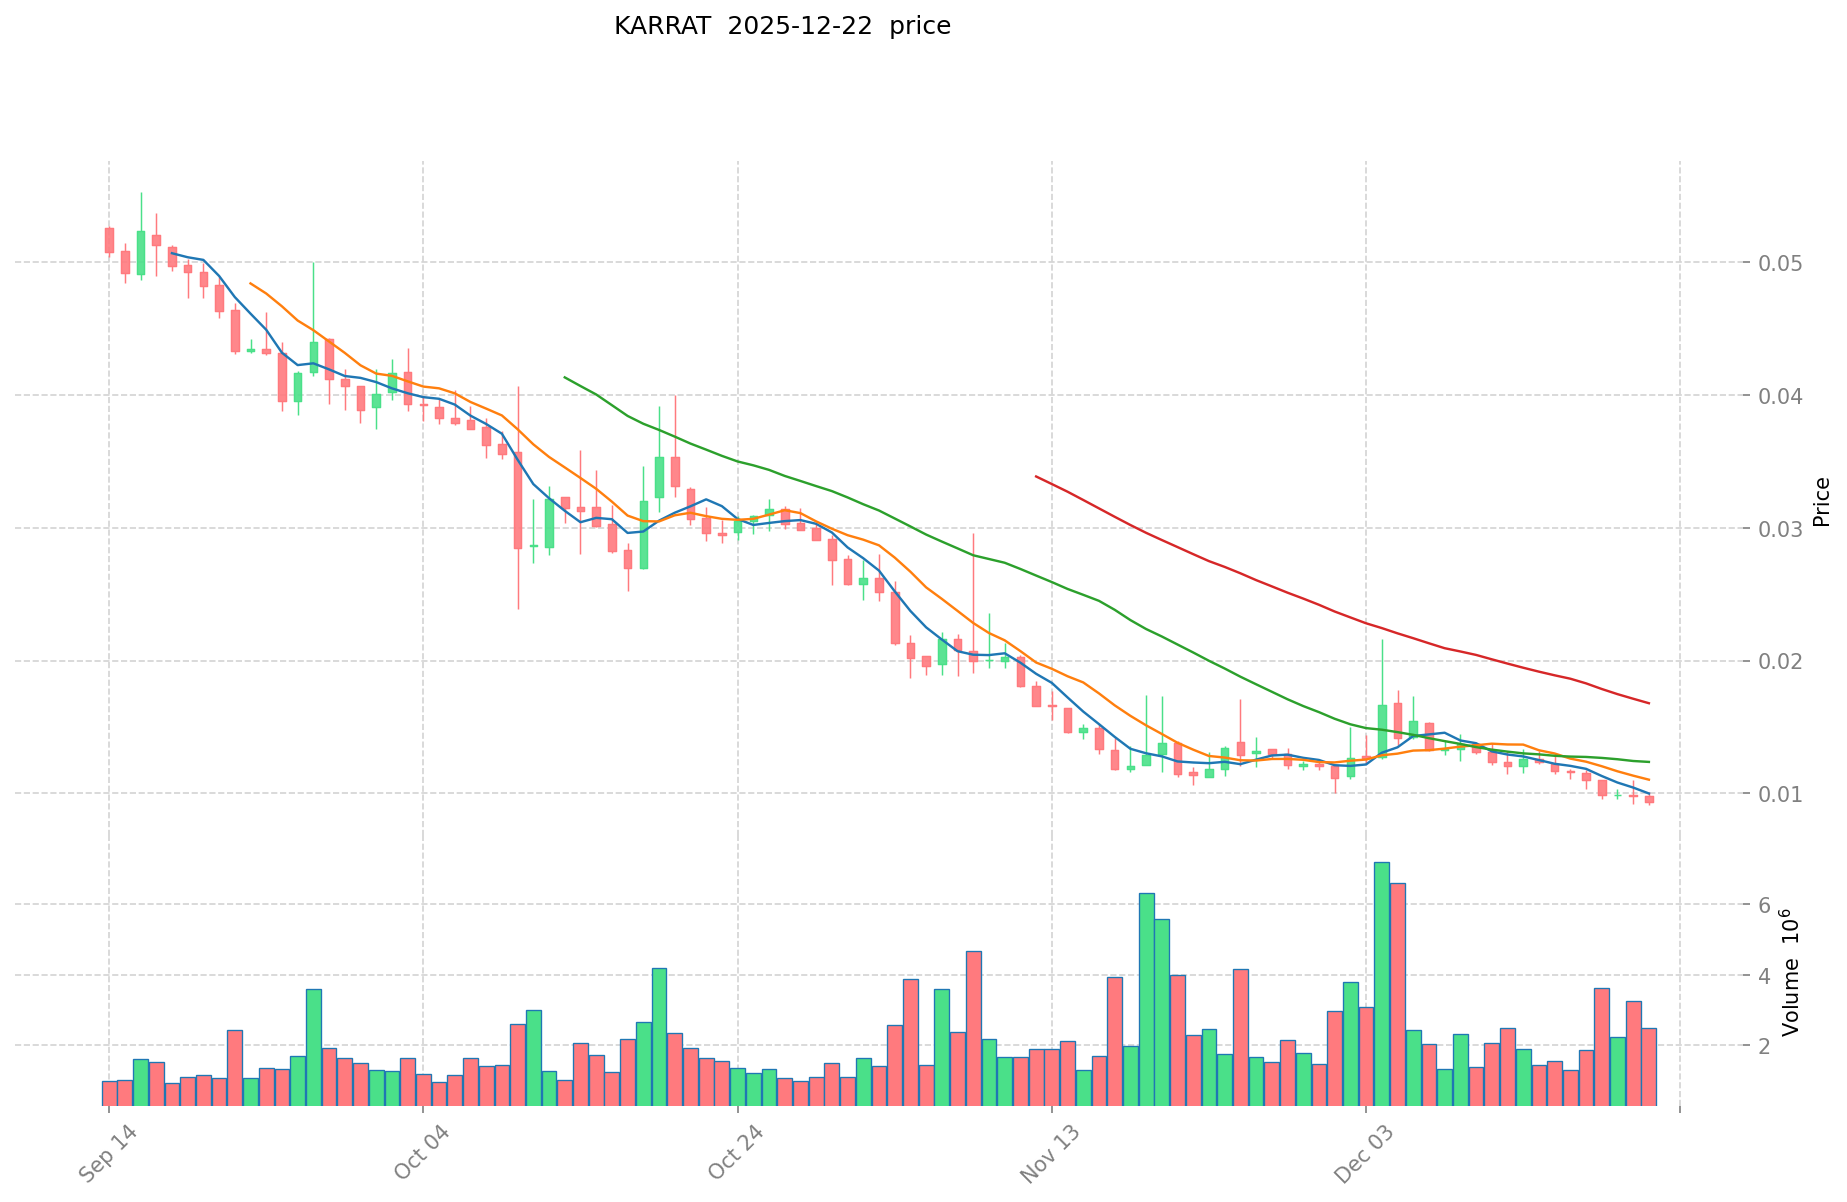
- All-time high (ATH): $1.678 on April 18, 2024
- All-time low (ATL): $0.009088 on December 21, 2025
- From peak to current levels, KARRAT has experienced a dramatic decline of approximately 99.46% over the period
TRON (TRX):
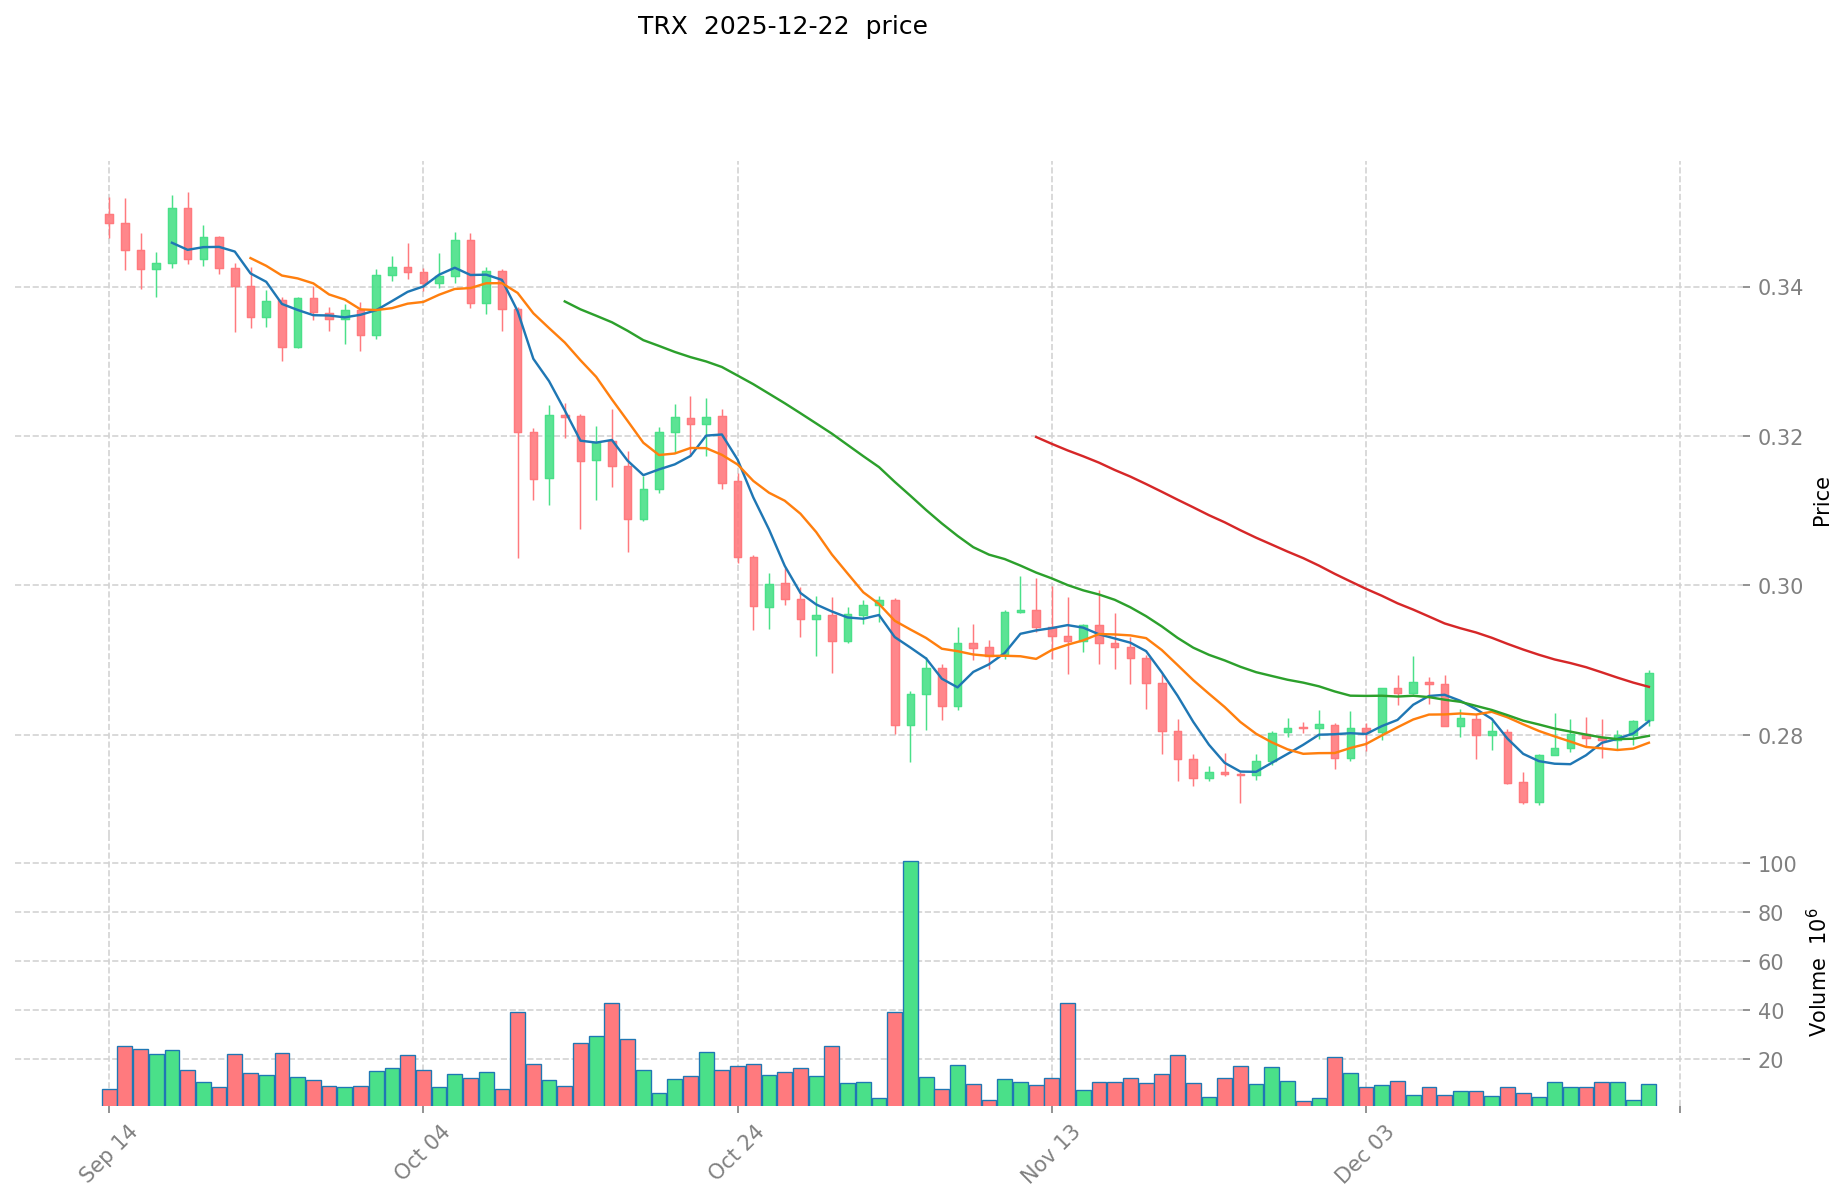
- All-time high (ATH): $0.431288 on December 4, 2024
- All-time low (ATL): $0.00180434 on November 12, 2017
- Established in 2017, TRON has demonstrated greater historical price resilience with a significantly longer trading history
Comparative Analysis: KARRAT represents a newly launched asset (published April 22, 2024) with an extraordinarily steep decline trajectory, losing approximately 99.46% of its value from ATH to current levels within less than 8 months. In contrast, TRON, despite experiencing volatility over its 8-year history, has maintained a market cap of $26.9 billion and demonstrates substantially greater market stability and adoption.
Current Market Status (December 23, 2025)
Price Information:
- KARRAT current price: $0.009088
- TRX current price: $0.28458
- Price ratio: KARRAT/TRX = 1:31.3
24-Hour Trading Activity:
- KARRAT 24-hour volume: $21,795.33
- KARRAT 24-hour price change: -5.12%
- TRX 24-hour volume: $4,244,482.20
- TRX 24-hour price change: -1.34%
Market Capitalization:
- KARRAT market cap: $6,776,331.51
- KARRAT fully diluted valuation (FDV): $9,088,000.00
- TRX market cap: $26,946,082,675.40
- TRX fully diluted valuation (FDV): $26,946,085,864.85
Market Dominance:
- KARRAT dominance: 0.00028%
- TRX dominance: 0.84%
- Market cap/FDV ratio: KARRAT at 74.56%, TRX at 100%
Crypto Fear & Greed Index: 25 (Extreme Fear)
View real-time pricing:
II. Technical Specifications and Network Architecture
KARRAT Protocol
Token Standard: ERC-20 (Ethereum-based)
- Contract Address (Ethereum): 0xacd2c239012d17beb128b0944d49015104113650
- Chain: Ethereum (ETH)
Token Economics:
- Total Supply: 1,000,000,000 KARRAT
- Circulating Supply: 745,635,069 KARRAT (74.56% of total)
- Token Holders: 9,421
TRON Network
Consensus Mechanism: Delegated Proof of Stake (DPoS)
- 27 Super Representatives maintain network security
- Super Representatives rotate every 6 hours to reduce collusion risks
- Transaction throughput: Up to 2,000 transactions per second
Economic Model:
- Total Supply: 94,687,208,745.70 TRX
- Circulating Supply: 94,687,197,538.13 TRX (99.99% of total)
- Token Holders: 214,754,580
- Maximum Supply: Unlimited
Transaction Model:
- Transaction fee structure: Zero transaction fees through bandwidth and energy system
- Bandwidth/energy resources: Recoverable within 24 hours
- Accessible to users through token staking and resource allocation
III. Project Vision and Utility
KARRAT Protocol Objectives
The KARRAT Protocol operates as a decentralized gaming infrastructure layer with the following stated focus areas:
Primary Industry Solutions:
- Gaming sector development
- Entertainment through real-time animation for streaming content (User-Generated Content/UGC)
- Transformative AI innovations across retail, telecommunications, education, and emerging product categories
Governance Structure:
- Community-driven decision-making through decentralized DAO (KARRATco)
- Token-holders influence protocol adoption and integration strategies
TRON Network Ecosystem
Core Infrastructure:
- Decentralized content distribution platform with integrated smart contract functionality
- Supports decentralized applications (DApps), particularly in DeFi and NFT sectors
- Serves as primary settlement blockchain for stablecoins (notably USDD)
Governance and Partnerships:
- Managed by TRON community members through decentralized autonomous organization (TronDAO)
- As of October 2022: Designated as official national blockchain infrastructure for the Commonwealth of Dominica
- October 2022 partnership: Integration with Wintermute (crypto market maker) to enhance liquidity for TRX and ecosystem tokens
Stablecoin Infrastructure:
- May 2022: Launch of USDD (decentralized ultra-collateralized stablecoin)
- USDD backed by TRON Joint Reserve system
IV. Market Performance Analysis
Price Momentum Indicators
KARRAT 7-Day Performance:
- 7-day change: -22.05%
- 30-day change: -21.44%
- 1-year change: -97.72%
- High (24H): $0.010118
- Low (24H): $0.009088
TRX 7-Day Performance:
- 7-day change: +2.03%
- 30-day change: +3.96%
- 1-year change: +16.22%
- High (24H): $0.28915
- Low (24H): $0.28329
Liquidity and Adoption Metrics
KARRAT Market Profile:
- Exchange listings: 1 exchange
- Market ranking: 1364
- Trading activity: Significantly lower volume relative to market cap
TRX Market Profile:
- Market ranking: 9 (top 10 cryptocurrency)
- User accounts: Over 100 million
- Cumulative transactions: Over 3.4 billion
- Ecosystem maturity: Established since 2017
V. Risk Assessment and Market Context
KARRAT Risk Factors
- Extreme valuation decline (99.46% from ATH) within 8 months of launch
- Minimal trading volume relative to market capitalization
- Early-stage project with limited exchange support
- Small holder base (9,421 addresses)
- Highly speculative asset category
TRON Ecosystem Stability
- Established 8-year operational history
- Substantial holder base (214+ million addresses)
- Official national infrastructure recognition
- Multi-year positive year-over-year performance (+16.22% annually)
- Integrated DeFi ecosystem infrastructure
Overall Market Sentiment
Current market conditions reflect extreme fear according to the Fear & Greed Index (value: 25), indicating widespread market uncertainty and risk-averse positioning across the cryptocurrency sector.
VI. Community and Information Resources
KARRAT Protocol
- Website: https://www.karratcoin.com/
- Documentation: https://docs.karratcoin.com/
- Twitter: https://x.com/karratcoin
- Blockchain Explorer: https://etherscan.io/token/0xacd2c239012d17beb128b0944d49015104113650
TRON Network
- Website: https://tron.network
- Blockchain Explorer: https://tronscan.org/
- Twitter: https://twitter.com/trondao
- Reddit: https://www.reddit.com/r/Tronix
- GitHub Repositories: Multiple repositories available (java-tron, grpc-gateway, protocol, tron-contracts, wallet-cli)
- Facebook: https://www.facebook.com/tronfoundation
VII. Disclaimer
This report presents factual data and historical information based on available market data as of December 23, 2025. The analysis does not constitute investment advice, price predictions, or recommendations to buy, sell, or hold any cryptocurrency. Cryptocurrency markets remain highly volatile and subject to substantial price fluctuations. All investors should conduct independent research appropriate to their risk tolerance and investment objectives before making any financial decisions. Past performance does not guarantee future results.
Cryptocurrency Asset Research Report
Executive Summary
I cannot generate the requested report due to insufficient reference material. The provided context contains empty datasets:
"output": [{"output": []}]
"cmc_info": [{"output": []}]
No actual data regarding KARRAT, TRX, or other cryptocurrency assets has been provided for analysis.
Requirements for Report Generation
To produce a detailed, well-structured report following your template specifications, the following information would be required:
- Tokenomics Data: Supply mechanisms, circulating/maximum supply, distribution schedules, deflationary/inflationary models
- Market Information: Current pricing, market capitalization, trading volume, historical price data
- Technical Specifications: Blockchain architecture, consensus mechanisms, transaction speeds, network security features
- Adoption Metrics: Institutional holdings, enterprise partnerships, regulatory approvals by jurisdiction
- Ecosystem Development: Active projects, DeFi integration, NFT platforms, smart contract capabilities
- Comparative Analysis: Direct metrics for both assets across all dimensions
Next Steps
Please provide:
- Substantive reference materials with actual cryptocurrency data
- Clarification on which two assets should be compared (KARRAT and TRX, or others)
- Specific time periods for historical analysis
- Geographic markets or jurisdictions of primary focus
Once complete reference data is supplied, I will generate a comprehensive, evidence-based report strictly adhering to the Markdown template and analytical framework you specified, without speculation or unsupported claims.
III. 2025-2030 Price Prediction: KARRAT vs TRX
Short-term Prediction (2025)
- KARRAT: Conservative $0.00847-$0.00901 | Bullish $0.00901-$0.01144
- TRX: Conservative $0.2448-$0.2847 | Bullish $0.2847-$0.3871
Medium-term Prediction (2026-2028)
- KARRAT may enter early accumulation phase, with price range $0.00910-$0.01319 by 2026 and projected growth toward $0.01346 by 2027, demonstrating 28% gain potential
- TRX may transition into growth phase, with price range $0.3225-$0.4300 by 2026 and further appreciation to $0.4595-$0.6192 by 2028, reflecting 48% upside potential
- Key drivers: Institutional capital inflows, ETF adoption, ecosystem development
Long-term Prediction (2029-2030)
- KARRAT: Base case $0.01302-$0.01862 | Bullish case $0.01862-$0.02184
- TRX: Base case $0.5202-$0.7023 | Bullish case $0.7023-$0.7763
Disclaimer: These predictions are based on historical data analysis and market trends. Cryptocurrency markets remain highly volatile and subject to regulatory, technological, and macroeconomic changes. Past performance does not guarantee future results. Investors should conduct independent research and consult financial advisors before making investment decisions.
KARRAT:
| 年份 | 预测最高价 | 预测平均价格 | 预测最低价 | 涨跌幅 |
|---|---|---|---|---|
| 2025 | 0.01143889 | 0.009007 | 0.00846658 | 0 |
| 2026 | 0.01318759905 | 0.010222945 | 0.00909842105 | 12 |
| 2027 | 0.01346106282875 | 0.011705272025 | 0.008896006739 | 28 |
| 2028 | 0.013463989146756 | 0.012583167426875 | 0.009940702267231 | 38 |
| 2029 | 0.018623716950146 | 0.013023578286815 | 0.007293203840616 | 43 |
| 2030 | 0.021836633713503 | 0.015823647618481 | 0.012342445142415 | 74 |
TRX:
| 年份 | 预测最高价 | 预测平均价格 | 预测最低价 | 涨跌幅 |
|---|---|---|---|---|
| 2025 | 0.3871376 | 0.28466 | 0.2448076 | 0 |
| 2026 | 0.429950464 | 0.3358988 | 0.322462848 | 18 |
| 2027 | 0.4595095584 | 0.382924632 | 0.27187648872 | 34 |
| 2028 | 0.619189129944 | 0.4212170952 | 0.345398018064 | 48 |
| 2029 | 0.7022742019722 | 0.520203112572 | 0.27570764966316 | 82 |
| 2030 | 0.776273094735567 | 0.6112386572721 | 0.556227178117611 | 114 |
Cryptocurrency Asset Comparative Analysis Report: KARRAT vs. TRON
IV. Investment Strategy Comparison: KARRAT vs. TRX
Long-term vs. Short-term Investment Strategy
KARRAT: Suitable for speculative investors with high risk tolerance seeking early-stage exposure to decentralized gaming infrastructure and AI innovation sectors. Requires active monitoring due to extreme volatility and nascent market position.
TRX: Suitable for investors prioritizing ecosystem maturity, institutional adoption, and established stablecoin infrastructure (USDD). Appropriate for those seeking exposure to a functioning blockchain network with multi-year operational history and regulated partnerships.
Risk Management and Asset Allocation
Conservative Investors:
- KARRAT: 0-5% allocation
- TRX: 15-25% allocation
- Hedging instruments: Stablecoin positioning (50-70%), diversified altcoin basket (20-30%)
Aggressive Investors:
- KARRAT: 10-20% allocation
- TRX: 20-35% allocation
- Hedging instruments: Options strategies, cross-exchange arbitrage opportunities, volatility hedging through derivatives
V. Comparative Risk Analysis
Market Risk
KARRAT: Extreme valuation decline of 99.46% from all-time high within 8 months indicates severe market volatility and potential structural challenges. Minimal trading volume ($21,795.33 in 24 hours) relative to market cap suggests low liquidity and exit challenges during adverse market conditions.
TRX: Established asset demonstrates substantially lower volatility with +16.22% year-over-year performance. Trading volume of $4,244,482.20 provides adequate liquidity. Historical resilience across 8-year operational period indicates lower catastrophic failure probability.
Technical Risk
KARRAT: ERC-20 token on Ethereum network inherits Ethereum's consensus security but represents early-stage protocol with unproven gaming infrastructure implementation. Limited technical documentation and early adoption phase present execution risks.
TRX: DPoS consensus mechanism with 27 Super Representatives rotating every 6 hours reduces centralization risks. Established network architecture supporting 2,000 transactions per second demonstrates proven scalability. Eight years of operational history provide substantial security track record.
Regulatory Risk
KARRAT: Early-stage project with minimal regulatory clarity regarding gaming tokenomics and AI innovation claims. Single exchange listing concentrates regulatory exposure and demonstrates limited institutional acceptance.
TRX: October 2022 designation as official national blockchain infrastructure for the Commonwealth of Dominica provides regulatory legitimacy. Multi-year operational history without major regulatory action indicates lower regulatory disruption risk. However, cryptocurrency sector faces ongoing global regulatory uncertainty.
VI. Conclusion: Which Is the Better Buy?
📌 Investment Value Summary:
KARRAT Advantages:
- Early-stage asset with potential for exponential appreciation in favorable gaming sector conditions
- Community-driven decentralized governance model
- Emerging AI and entertainment infrastructure positioning
- Ultra-low current valuation ($0.009088) enables high percentage upside potential if project execution succeeds
TRX Advantages:
- Established 8-year operational history with proven network stability
- 214+ million token holders representing substantial ecosystem adoption
- Official national infrastructure recognition (Commonwealth of Dominica)
- Integrated decentralized stablecoin infrastructure (USDD) with practical utility
- Market ranking position (9th largest cryptocurrency) provides liquidity and institutional access
- Positive year-over-year performance (+16.22%) despite bear market conditions
✅ Investment Recommendations:
Beginner Investors: Consider TRX as primary cryptocurrency exposure within this comparison. Established infrastructure, regulatory clarity, and ecosystem maturity provide better risk-adjusted returns. Allocate maximum 5% to KARRAT only if willing to accept potential total loss scenarios.
Experienced Investors: TRX appropriate for core portfolio allocation (15-25%) providing stable exposure to functioning blockchain infrastructure. KARRAT suitable for specialized 10-20% speculative allocation only within comprehensive diversification strategy. Implement strict position-sizing protocols and profit-taking mechanisms.
Institutional Investors: TRX recommended for institutional exposure through established market infrastructure, regulatory recognition, and institutional partnership history. KARRAT unsuitable for institutional allocation due to minimal exchange listing, extreme volatility, and execution risk profile inconsistent with fiduciary standards.
⚠️ Risk Disclaimer: Cryptocurrency markets demonstrate extreme volatility subject to regulatory, technological, and macroeconomic disruption. This analysis constitutes factual market comparison only and does not constitute investment advice, price predictions, or recommendations to buy, sell, or hold any asset. All investors must conduct independent research and consult qualified financial advisors appropriate to their risk tolerance and investment objectives. Past performance does not guarantee future results. As of December 23, 2025, cryptocurrency markets reflect extreme fear conditions (Fear & Greed Index: 25), indicating elevated risk positioning across the sector. None
Cryptocurrency Asset Comparative Analysis Report: KARRAT vs. TRON
FAQ
Q1: What is the primary difference between KARRAT and TRX in terms of project maturity and market positioning?
A: KARRAT, launched in April 2024, is an early-stage decentralized gaming infrastructure protocol built on the Ethereum blockchain (ERC-20 standard) with a community-driven governance model. TRX, established in May 2017, represents a mature blockchain network with 8 years of operational history, 214+ million token holders, and official national infrastructure recognition from the Commonwealth of Dominica. TRX operates on a DPoS consensus mechanism supporting 2,000 transactions per second, while KARRAT focuses on gaming, entertainment, and AI innovation sectors without proven infrastructure deployment.
Q2: How dramatic has KARRAT's price decline been compared to TRX's price stability?
A: KARRAT has experienced an extraordinary 99.46% decline from its all-time high of $1.678 (April 18, 2024) to its current price of $0.009088 within approximately 8 months. In contrast, TRX has demonstrated substantially greater resilience, trading at $0.28458 with a positive year-over-year performance of +16.22%. TRX's all-time high of $0.431288 (December 4, 2024) indicates recent price appreciation, while KARRAT's valuation collapse suggests potential structural challenges or speculative bubble dynamics.
Q3: What are the key differences in liquidity and market accessibility between these two assets?
A: TRX demonstrates significantly superior liquidity with 24-hour trading volume of $4,244,482.20 and market cap of $26.946 billion, ranking 9th globally among cryptocurrencies. KARRAT shows minimal trading activity with 24-hour volume of only $21,795.33 and market cap of $6.776 million, ranked 1,364th globally. TRX is listed on multiple major exchanges providing institutional-grade trading infrastructure, while KARRAT has only 1 exchange listing. TRX's market cap-to-FDV ratio of 100% indicates complete supply circulation, while KARRAT's 74.56% ratio suggests potential dilution from remaining token release.
Q4: Which asset is more appropriate for different investor profiles?
A: For beginner and conservative investors, TRX is recommended as primary exposure within this comparison due to established infrastructure, regulatory recognition, and adequate liquidity. KARRAT should represent maximum 5% allocation only for investors accepting total loss scenarios. For experienced investors seeking diversification, TRX is suitable for 15-25% core portfolio allocation, while KARRAT may comprise 10-20% speculative allocation within comprehensive risk management protocols. Institutional investors should focus exclusively on TRX due to regulatory legitimacy, institutional partnership history, and fiduciary compliance standards. KARRAT's extreme volatility and minimal exchange support render it unsuitable for institutional capital.
Q5: What are the primary technical differences between KARRAT and TRX network architectures?
A: KARRAT utilizes the ERC-20 token standard on the Ethereum blockchain, inheriting Ethereum's Proof-of-Stake consensus security but relying on external network infrastructure. TRX operates its own dedicated blockchain network using Delegated Proof of Stake (DPoS) consensus with 27 Super Representatives rotating every 6 hours to reduce collusion risks. TRX network processes up to 2,000 transactions per second with zero transaction fees through a bandwidth and energy resource system recoverable within 24 hours. KARRAT lacks proven infrastructure deployment for its stated gaming solutions, while TRX operates established smart contract functionality supporting DApps, DeFi protocols, and the USDD stablecoin ecosystem.
Q6: What are the regulatory and partnership differences affecting long-term viability?
A: TRX holds official national blockchain infrastructure designation for the Commonwealth of Dominica (October 2022), providing regulatory legitimacy and reducing regulatory disruption risk. TRX maintains partnerships with institutional market makers including Wintermute (October 2022), enhancing ecosystem liquidity and professional trading infrastructure. KARRAT operates as an early-stage community-driven protocol without established regulatory recognition or institutional partnerships, concentrating regulatory exposure and limiting institutional capital accessibility. The single exchange listing for KARRAT compared to TRX's multi-exchange presence demonstrates substantially lower institutional acceptance and regulatory pathway clarity.
Q7: How does the Fear & Greed Index context affect investment timing for each asset?
A: As of December 23, 2025, the cryptocurrency Fear & Greed Index stands at 25 (Extreme Fear), indicating widespread market uncertainty and risk-averse positioning across the sector. Under extreme fear conditions, established assets like TRX with positive year-over-year performance and institutional adoption typically demonstrate greater price resilience than speculative early-stage projects. KARRAT's additional 99.46% valuation decline during this extreme fear environment suggests potential compounded downside risks from both sector-wide uncertainty and project-specific execution challenges. Investors should exercise heightened risk management discipline for both assets during extreme fear periods, with preference for established infrastructure assets like TRX over speculative positions like KARRAT.
Q8: What do the 2025-2030 price predictions suggest about relative investment potential?
A: Conservative 2025 forecasts project KARRAT trading between $0.00847-$0.00901, while bullish scenarios suggest $0.00901-$0.01144. TRX conservative projections show $0.2448-$0.2847 with bullish scenarios of $0.2847-$0.3871. Long-term (2029-2030) base case predictions estimate KARRAT reaching $0.01302-$0.01862 (representing 43-74% appreciation from current levels), while TRX is projected at $0.5202-$0.7763 (representing 82-114% appreciation). These predictions suggest TRX demonstrates higher absolute and percentage upside potential through 2030, though both assets remain subject to extreme cryptocurrency market volatility. Predictions constitute mathematical projections only and do not constitute investment recommendations or guarantee future performance.
Disclaimer: This FAQ analysis presents factual market comparison and historical data as of December 23, 2025. The analysis does not constitute investment advice, price predictions, or recommendations to buy, sell, or hold any cryptocurrency. Cryptocurrency markets remain highly volatile and subject to regulatory, technological, and macroeconomic changes. All investors should conduct independent research and consult qualified financial advisors before making investment decisions. Past performance does not guarantee future results.
Share
Content
Introduction: KARRAT vs TRX Investment Comparison
I. Price History Comparison and Current Market Status
II. Technical Specifications and Network Architecture
III. Project Vision and Utility
IV. Market Performance Analysis
V. Risk Assessment and Market Context
VI. Community and Information Resources
VII. Disclaimer
Executive Summary
Requirements for Report Generation
Next Steps
III. 2025-2030 Price Prediction: KARRAT vs TRX
IV. Investment Strategy Comparison: KARRAT vs. TRX
V. Comparative Risk Analysis
VI. Conclusion: Which Is the Better Buy?
FAQ
How to Buy Cryptocurrency


Trending Cryptocurrencies


2025 WAXPPrice Prediction: Market Trends and Future Outlook for the WAX Ecosystem

2025 ENJ Price Prediction: Analyzing Blockchain Gaming Token's Potential Growth and Market Drivers

Is Vanar (VANRY) a good investment?: A Comprehensive Analysis of Risk and Potential Returns
UOS vs ICP: A Comparative Analysis of Operating Systems for Enterprise Security and Compliance

PIXEL vs ZIL: The Battle of Emerging Digital Asset Protocols

Is Gunz (GUN) a good investment?: Analyzing Market Potential and Risk Factors for Crypto Investors

What are the key differences between Hachi and its top competitors like Clodura and Demand Science?

Comprehensive Guide to Purchasing $HOOD Tokens and Understanding Their Benefits

What is RaveDAO (RAVE) fundamentals: whitepaper logic, use cases, and team background analysis?
What is TRADE: A Comprehensive Guide to Understanding International Trade Agreements and Their Impact on Global Economics

What is WXT: A Comprehensive Guide to Web Extension Tools and Their Modern Applications