Master Hammer Candlestick Pattern for Crypto Reversal Trading Techniques
The Hammer Candlestick: individuare le inversioni rialziste nel mercato
The Hammer candlestick pattern represents one of the most reliable and widely recognized technical analysis tools for identifying potential bullish reversals in financial markets. This pattern emerges at the conclusion of downtrends and serves as a crucial indicator that selling pressure is diminishing while buying interest begins to dominate, potentially leading to upward price movements. Understanding what a Hammer is and properly identifying this pattern enables traders to gain valuable insights into market dynamics and make well-informed trading decisions.
Cos'è un hammer?
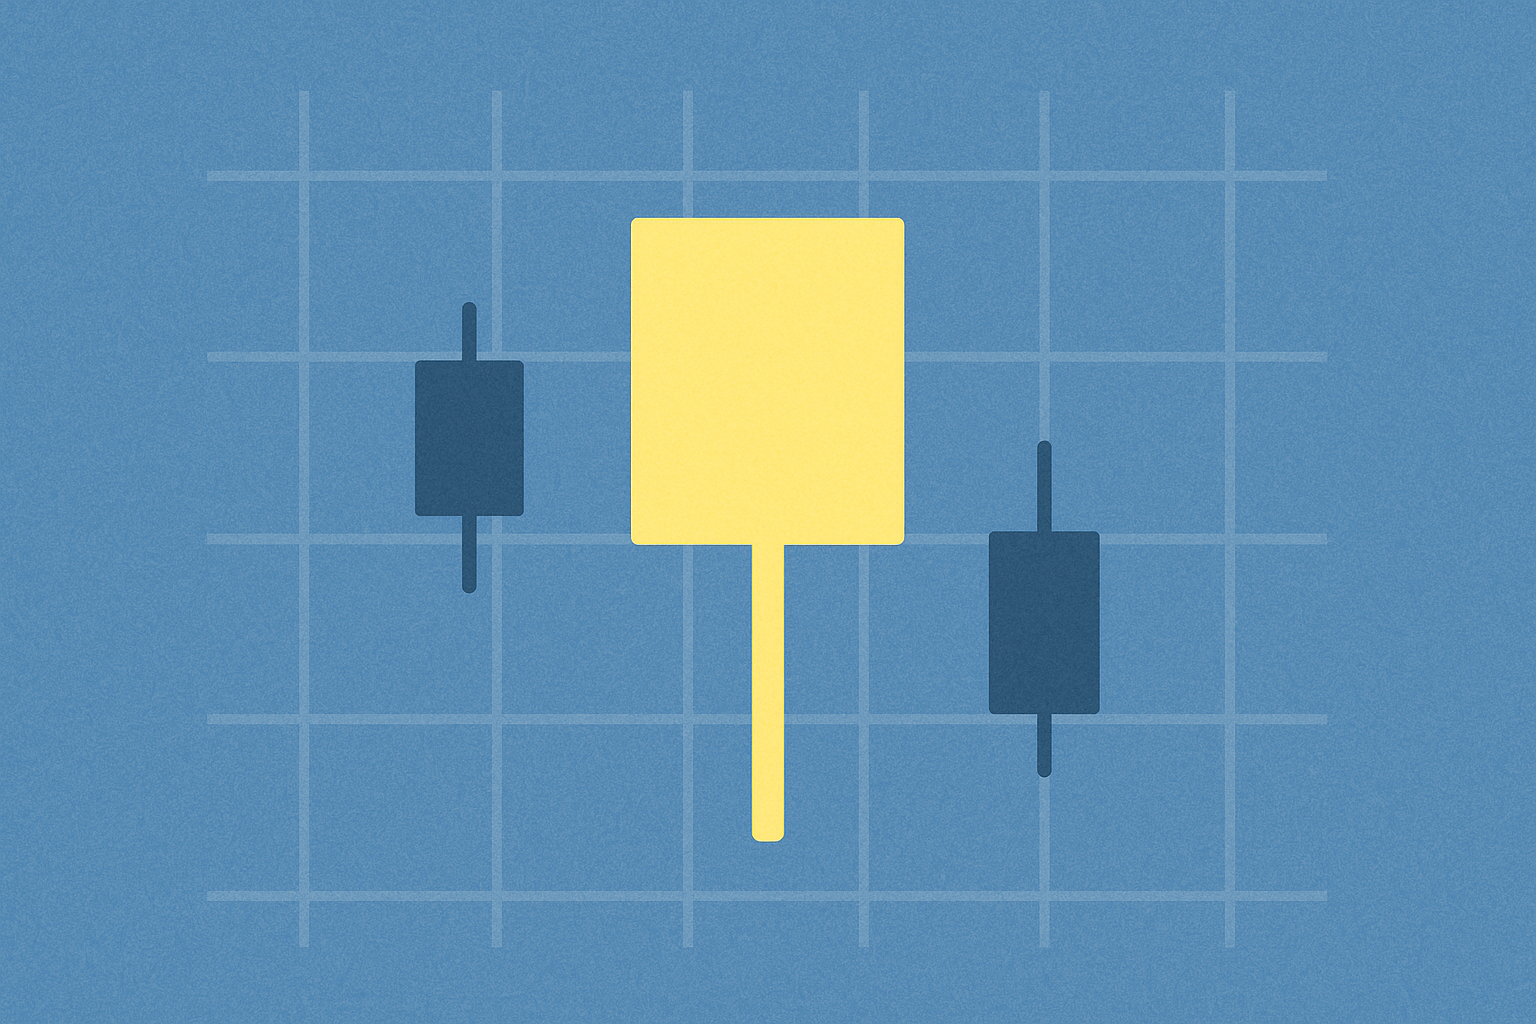
A Hammer candlestick forms during a trading session when an asset's price experiences significant downward pressure but subsequently recovers to close near its opening price. Understanding what a Hammer is begins with recognizing its distinctive visual appearance characterized by a small body positioned at the upper portion of the candle accompanied by an extended lower wick or shadow. The formation demonstrates that despite aggressive selling pressure pushing prices lower during the session, buyers successfully regained control and drove prices higher before the close.
The defining characteristics of an authentic Hammer pattern include a small real body located at the top of the candlestick, representing the narrow range between opening and closing prices. The lower shadow extends at least twice the length of the real body, providing visual evidence that prices were pushed significantly lower but recovered strongly. Additionally, the upper shadow should be minimal or completely absent, indicating that prices did not move substantially above the opening and closing levels. These specific proportions and positioning are essential for proper pattern identification and understanding what a Hammer truly represents.
Il martello come segnale di inversione rialzista
The Hammer pattern functions as a bullish reversal signal when it appears following a sustained downtrend. The pattern's significance lies in its representation of a critical shift in market sentiment and momentum. Initially, sellers dominated the trading session and pushed prices downward, but buyers subsequently intervened with sufficient strength to drive prices back upward, suggesting that bearish momentum may be weakening. This transformation in market dynamics indicates that the market could be transitioning toward a bullish phase, presenting potentially favorable opportunities for traders to establish long positions.
The reversal signal stems from several key factors. The extended lower wick demonstrates buyer strength, as it shows that while sellers initially controlled the session, buyers possessed adequate power to push prices higher, signaling a momentum shift. From a market psychology perspective, after a series of declining prices, the Hammer indicates that sellers are becoming exhausted while buyers prepare to assume control. This psychological transition often precedes significant trend reversals and represents a critical inflection point in market sentiment. Understanding what a Hammer signals helps traders identify these crucial market turning points.
Tipi di candele Hammer
Several variations of the Hammer candlestick exist, each displaying slight differences while conveying similar implications. The standard Hammer forms after a downtrend and signals a bullish reversal, characterized by its small body at the top and long lower shadow. The Inverted Hammer, another important variation, features a long upper shadow with a small body positioned at the bottom of the candlestick. Despite its different appearance, the Inverted Hammer also signals a potential reversal following a downtrend, representing a similar shift in market dynamics where buyers begin asserting their influence.
Both variations provide valuable information about market sentiment and potential trend changes. When considering what a Hammer is, it's important to recognize these variations as they both serve similar purposes in identifying potential bullish reversals. The choice between recognizing one pattern over another depends on the specific price action during the formation period. Traders should familiarize themselves with these variations to ensure comprehensive market analysis and avoid missing important reversal signals.
Utilizzo delle candele Hammer nelle strategie di trading
While the Hammer candlestick provides a reliable indication of potential reversals, prudent traders confirm its signal using additional technical indicators and market conditions before executing trades. Successful implementation of Hammer-based strategies requires multiple layers of confirmation to reduce false signals and improve trading accuracy.
Traders typically seek confirmation through several methods. A confirmation candle appearing in the subsequent trading session, characterized by strong bullish price action, validates the reversal signal and increases confidence in the pattern's reliability. Volume analysis plays a crucial role, as a Hammer accompanied by elevated trading volume suggests strong buying interest at new price levels, making the signal more dependable. Additionally, when a Hammer forms near established support levels, the reversal signal gains additional strength, as these areas often attract buying interest and provide natural price floors.
Integrating these confirmation techniques with proper risk management ensures that traders maximize the Hammer pattern's effectiveness while minimizing exposure to false signals. This multi-faceted approach combines pattern recognition with broader market analysis for optimal trading outcomes. Understanding what a Hammer is and how to confirm its signals remains fundamental to successful trading strategies.
Martello contro Appeso: non confonderti
A critical distinction exists between the Hammer and the Hanging Man pattern, despite their identical visual appearance. The context in which each pattern appears determines its interpretation and implications. While the Hammer signals a bullish reversal and forms after a downtrend, the Hanging Man represents a bearish reversal pattern that appears during uptrends, warning that bearish market conditions may emerge following a prolonged upward movement.
This distinction emphasizes the importance of considering the broader trend context when analyzing candlestick patterns. The same visual formation can convey opposite meanings depending on its position within the prevailing trend. Traders must carefully assess the preceding price action to correctly identify whether they are observing a Hammer or Hanging Man pattern, as misidentification could lead to incorrect trading decisions and potential losses. Understanding this differentiation represents a fundamental aspect of competent candlestick pattern analysis and clarifies what a Hammer truly signifies.
Limitazioni del candelabro Hammer
Despite its effectiveness as a technical analysis tool, the Hammer pattern possesses certain limitations that traders must acknowledge. Like all technical indicators, the Hammer should not be used in isolation but rather as part of a comprehensive analytical framework incorporating multiple indicators and techniques. The pattern's reliability varies depending on market conditions and context.
Occasionally, a Hammer may appear during temporary retracements within broader downtrends, generating false reversal signals. In such cases, the pattern does not indicate a genuine trend change but merely represents a brief pause in the continuing downward movement. This phenomenon underscores the necessity for confirmation signals and additional analysis before acting on Hammer patterns. Traders should maintain realistic expectations about the pattern's predictive power and always employ proper risk management strategies to protect against potential false signals.
Market volatility, liquidity conditions, and overall market sentiment can all influence the Hammer pattern's effectiveness. Recognizing these limitations enables traders to use the pattern more judiciously and avoid over-reliance on any single indicator. A complete understanding of what a Hammer is includes awareness of its limitations.
Conclusion
The Hammer candlestick pattern represents an essential component of technical analysis that every serious trader should master. Its appearance at the conclusion of downtrends provides a powerful indication of potential bullish momentum and can signal attractive buying opportunities before prices rise. Understanding what a Hammer is and recognizing its reliability stems from its clear representation of shifting market dynamics, as selling pressure gives way to buying interest.
However, successful application of this pattern requires disciplined confirmation through additional indicators and thorough analysis of prevailing market conditions before executing trades. The Hammer should never be used as a standalone signal but rather integrated into a comprehensive trading strategy that incorporates multiple forms of analysis and robust risk management. When applied wisely and confirmed properly, the Hammer pattern becomes an invaluable addition to any trader's technical analysis toolkit, providing clear visual signals of potential market turning points and helping traders capitalize on emerging bullish trends. Through careful study, practice, and integration with other analytical tools, traders can leverage the Hammer pattern's predictive power to enhance their trading performance and make more informed market decisions. Mastering what a Hammer is and how to use it effectively remains a cornerstone of successful technical trading.
FAQ
Che cos'è un hammer?
Un hammer è un pattern grafico formato da una candela con corpo piccolo e ombra inferiore lunga, indicando una forte pressione ribassista seguita da una possibile inversione del trend.
Che cos'è la figura tecnica Hammer?
L'Hammer è un pattern tecnico formato da una singola candela con corpo piccolo e lunga ombra inferiore. Indica una potenziale inversione rialzista dopo un ribasso, rappresentando il tentativo dei compratori di riprendere il controllo del mercato.
Share
Content
How to Buy Cryptocurrency


Trending Cryptocurrencies


Doji Candle Explained

Demo Trading

Trading Simulator: The Complete Guide to Paper, Backtests, and Live Drills
What Does TP Mean in Cryptocurrency Trading: A Beginner's Guide

What Does TP Mean in Text?

What Does TP Mean in Crypto Trading Slang?

What is SAUCE: A Comprehensive Guide to Understanding This Essential Condiment and Its Global Culinary Applications
What is DSYNC: A Comprehensive Guide to Distributed Synchronization Technology

Ethereum and Ethereum Classic: Key Distinctions Explained

What is XPLA: A Comprehensive Guide to the Next-Generation Layer-1 Blockchain Platform

What is MBX: A Comprehensive Guide to Understanding Mailbox Format and Its Applications