Mastering Candlestick Patterns: A Guide for Crypto Trading Success
What Does a Candle Mean? Understanding Candlestick Charts in Trading
Introduction to Candlesticks
A candle, or candlestick, is a fundamental element of technical analysis used in financial markets, including cryptocurrency trading. Understanding what a candle means is essential for any trader looking to analyze price movements and make informed trading decisions.
What Is a Candlestick?
A candlestick is a visual representation of price movement during a specific time period. Each candle shows four critical price points:
- Open: The price at the beginning of the time period
- Close: The price at the end of the time period
- High: The highest price reached during the period
- Low: The lowest price reached during the period
Components of a Candle
Understanding what a candle means requires knowing its two main components:
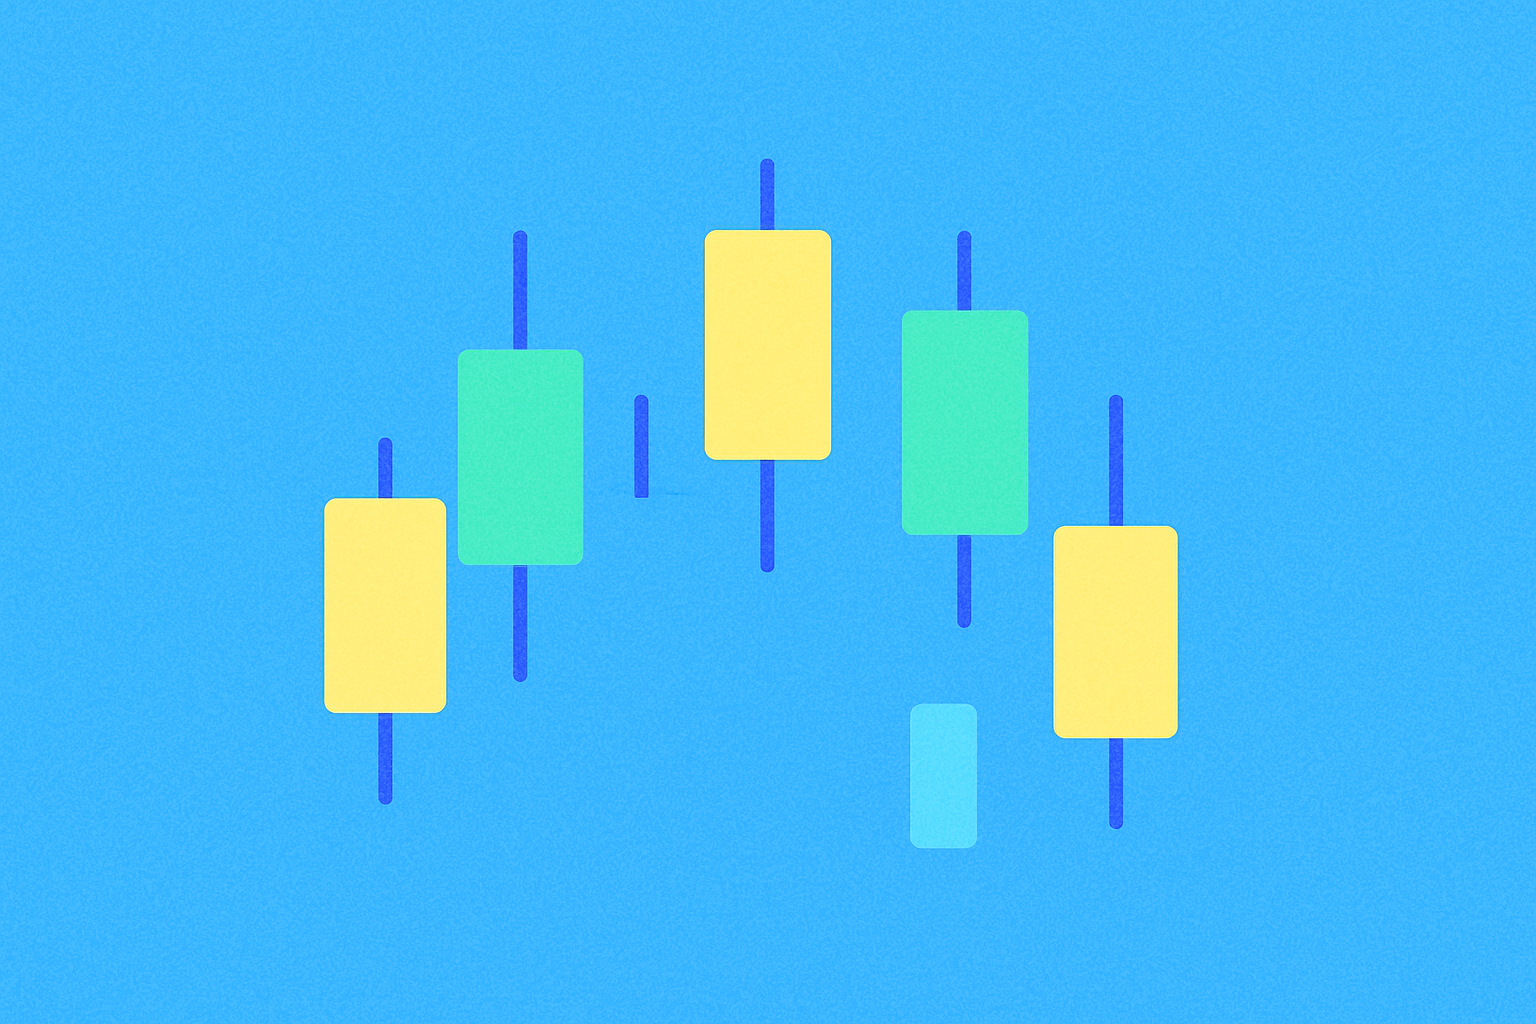
The Body
The rectangular part of the candle represents the range between the opening and closing prices. The body's color indicates price direction:
- Green/White candles: Close price is higher than open price (bullish)
- Red/Black candles: Close price is lower than open price (bearish)
The Wicks (Shadows)
The thin lines extending above and below the body show the high and low prices reached during the period. These wicks reveal important information about price rejection and market sentiment.
Time Frames
What a candle means can vary depending on the time frame you're analyzing:
- 1-minute candles show price action over one minute
- 5-minute, 15-minute, 1-hour candles for short-term trading
- Daily, weekly, and monthly candles for long-term analysis
Reading Candlestick Patterns
Understanding what each candle means becomes more powerful when reading patterns:
Single Candle Patterns
- Doji: Open and close prices are nearly equal, indicating indecision
- Hammer: Small body with long lower wick, suggesting potential reversal
- Shooting Star: Small body with long upper wick, indicating possible downturn
Multiple Candle Patterns
- Bullish Engulfing: Large green candle follows small red candle
- Bearish Engulfing: Large red candle follows small green candle
- Morning Star: Three-candle pattern signaling potential upward reversal
Practical Application
Traders use candlestick analysis across various trading platforms to:
- Identify trend directions
- Spot potential reversals
- Determine entry and exit points
- Set stop-loss and take-profit levels
When analyzing charts on major trading platforms, understanding what each candle means helps you make better trading decisions based on historical price behavior and market psychology.
Volume Consideration
While understanding what a candle means in terms of price is important, combining candlestick analysis with volume data provides more reliable signals. High volume during candle formation confirms the strength of the price movement.
Common Mistakes to Avoid
When learning what candles mean:
- Don't rely on single candles alone
- Consider the broader market context
- Avoid ignoring volume data
- Don't forget to analyze multiple time frames
Conclusion
Understanding what a candle means is fundamental to technical analysis in trading. Each candlestick tells a story about market sentiment, buyer and seller behavior, and potential future price movements. By mastering candlestick reading, traders can better navigate financial markets and make more informed trading decisions. Whether you're analyzing short-term price movements or long-term trends, comprehending what each candle represents is an invaluable skill for successful trading.
FAQ
What is a candle?
A candle is a candlestick chart pattern in cryptocurrency trading that displays open, close, high, and low prices within a specific time period, helping traders analyze market trends and price movements.
Czego symbolem jest świeca?
W analizie rynku kryptowalut świeca symbolem jest reprezentacja ceny. Każda świeca pokazuje cztery kluczowe dane: cenę otwarcia, zamknięcia, maksymalną i minimalną w określonym przedziale czasowym. Świece są fundamentalnym narzędziem w technicznej analizie handlu.
Share
Content
How to Buy Cryptocurrency


Trending Cryptocurrencies


What is M Pattern in Trading

How to Use MACD, RSI, and KDJ Indicators for Crypto Trading?

What is a red hammer Candlestick and how to use it
Decoding the KDJ Indicator: A Comprehensive Guide

Understanding Bullish Candlestick Patterns for Effective Trading Strategies

How to Interpret MACD and RSI Signals for Cryptocurrency Trading?
Exploring Pulse Chain TVL: Evaluating Market Trends and Dynamics
Unlock the Secrets of Bitcoin Ordinals and NFT Creation

Guide to Understanding Large Cryptocurrency OTC Transactions

Discover Your Wormhole Airdrop Eligibility Easily
Understanding Decentralized Lending: A Comprehensive Guide to DeFi Mechanics