Understanding Wicks in Trading: Their Significance and Interpretation

12-18-2025, 12:48:12 PM
Crypto Insights
Crypto Trading
Crypto Tutorial
K-line
Trading Bots
Article Rating : 3.5
half-star
45 ratings
This article provides an in-depth exploration of wicks on candlestick charts, emphasizing their role as crucial visual indicators in trading. Readers will learn about wick definition, formation, interpretation, and significance in understanding market sentiment and price action. It addresses common queries like the meaning of long wicks, their bullish or bearish implications, and their application in crypto trading. Ideal for traders of all levels seeking to enhance their technical analysis skills, the article stresses incorporating wick analysis with other tools for balanced market insight. Key concepts are detail-oriented yet concise for ease of reading and comprehension.
Understanding Wicks in Trading: Their Significance and Interpretation

Wick

Definition and Basic Concept

A wick is a fundamental element found on candlestick charts that serves as a critical visual indicator in technical analysis. Understanding what wicks mean in trading is essential for market participants seeking to interpret price action effectively. By definition, a wick represents a line on a candlestick chart that illustrates where the price of an asset fluctuates in relation to its opening and closing prices during a specific time period. This component is also commonly referred to by alternative names including whiskers, shadows, or tails, all of which describe the same graphical element that extends beyond the main body of the candlestick.

In financial markets, the wick functions as a vertical line that provides traders with immediate visual information about the high and low ranges of price action within a given timeframe. This simple yet powerful visual tool enables market participants to quickly assess the volatility and price range experienced during the trading period, making it an indispensable component of candlestick chart analysis.

Components of Candlestick Charts

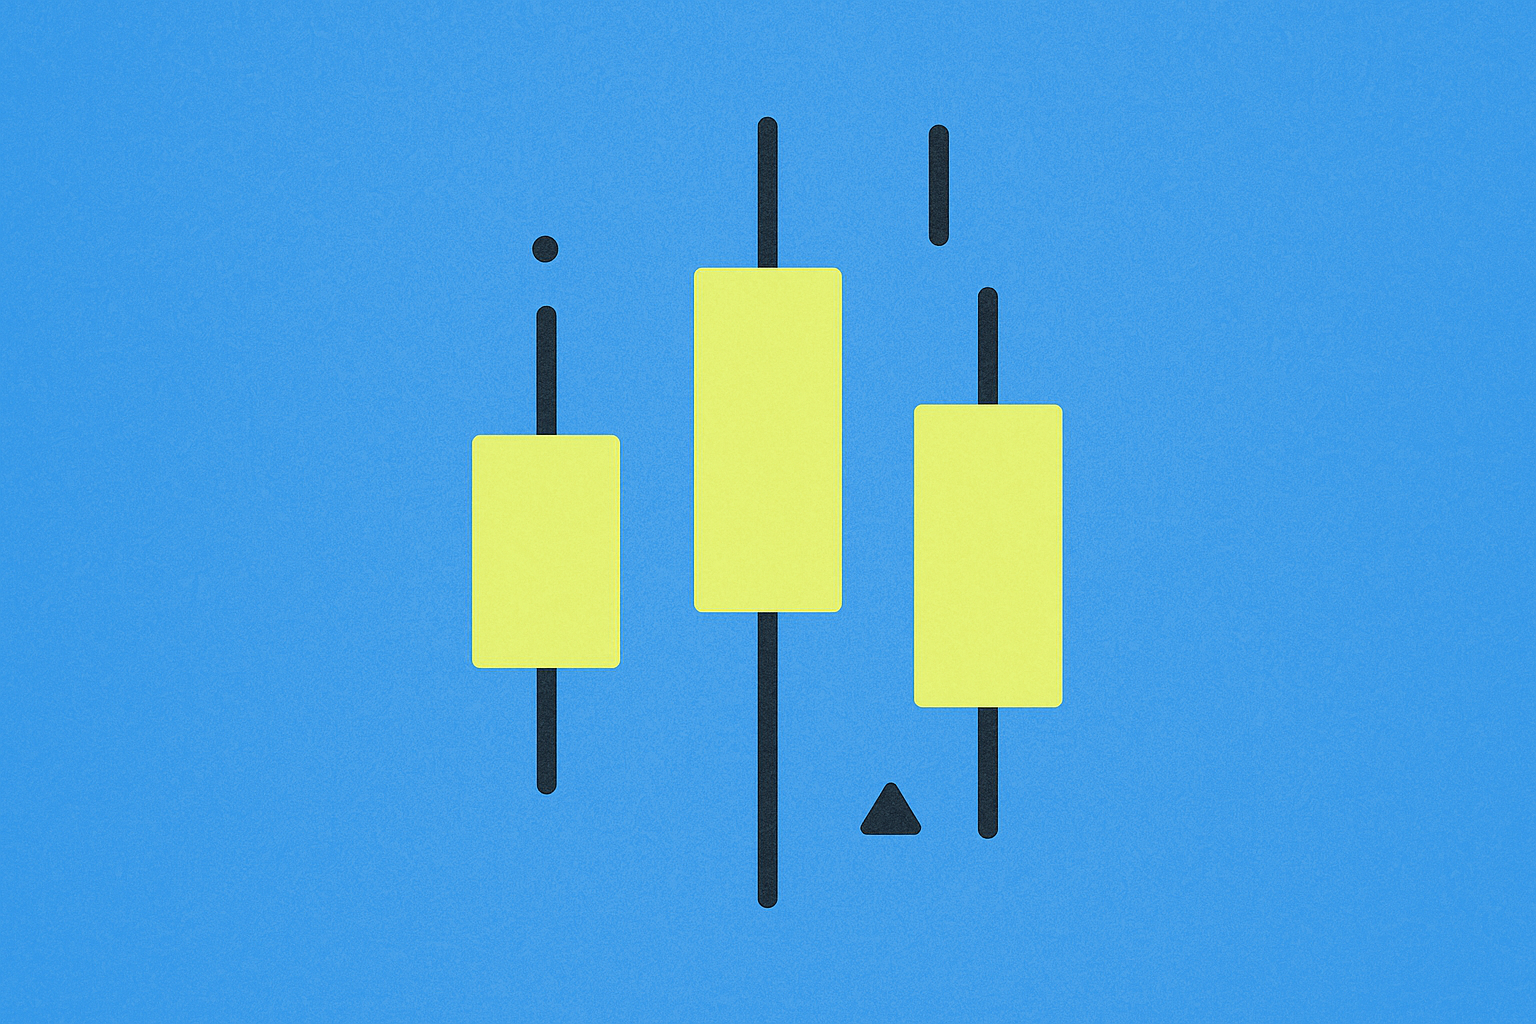
When analyzing a typical candlestick chart, traders concentrate on three primary elements that together provide a comprehensive view of price movement. These key points include the opening price, which marks where trading began for the period; the closing price, which indicates where trading concluded; and the candlestick wicks, which reveal the price extremes reached during the session.

The candlestick pattern itself is constructed based on four essential price points: the open, high, low, and close of a market during a specific timeframe. The rectangular or box-like portion of the candlestick is referred to as the body, which represents the range between the opening and closing prices. The lines extending from either end of this body are the wicks, which display the associated highs and lows that were reached but not sustained by the close of the period.

Understanding Wick Formation and Market Sentiment

When considering what wicks mean in trading, it becomes clear that the wicks themselves serve a crucial function by displaying the extremes in prices reached during the trading period, thereby enabling traders to better understand and interpret market sentiment and momentum. As the price moves in relation to both the opening and closing price throughout the session, wicks are formed as a visual record of such price movement and volatility.

This visual representation allows traders to observe rejected price levels and areas where buying or selling pressure was sufficient to push prices to extremes before a reversal occurred. The formation of wicks therefore provides valuable insight into the battle between buyers and sellers, revealing which side ultimately gained control by the close of the period.

The Significance of Wick Length

The length of a wick carries significant interpretive value for technical analysts and traders seeking to understand what wicks mean in trading contexts. For example, when a long wick appears at the bottom of a candle, it indicates that the price declined significantly during the period, moving all the way down to a lower extreme before recovering and moving back up again prior to the candle's close. This pattern suggests an increase in buying pressure and demand that emerged immediately following a period of selling pressure and supply.

Consequently, many technical analysts interpret a long wick as a potential signal of price reversal, suggesting that the market may be preparing to move in the opposite direction of that wick. A long lower wick, for instance, might indicate that sellers pushed prices down but buyers stepped in forcefully, potentially signaling a bullish reversal. Conversely, a long upper wick might suggest that buyers pushed prices higher but sellers regained control, potentially indicating a bearish reversal.

Wickless Candles

An alternative formation that traders may encounter is the wickless candle, which presents a distinctly different appearance and meaning. These candles appear as perfect squares or rectangles because the closing and opening prices precisely coincide with the high and low marks of that particular candlestick. The absence of wicks indicates that there was no price rejection beyond the opening and closing range, suggesting strong directional conviction throughout the entire period.

Wickless candles typically signal strong momentum and conviction in the prevailing direction, as prices did not test levels beyond the open-to-close range. This formation often appears during strong trending markets where one side (buyers or sellers) maintains complete control throughout the entire session.

Practical Application in Trading

When it comes to practical trading applications, developing the ability to read and interpret candlestick charts proves extremely valuable for market participants. Understanding what wicks mean in trading is particularly important when attempting to predict market sentiment and future price movements. Candlestick patterns, including the analysis of wick formations, represent important considerations when interpreting price action across various trading platforms and markets. The visual nature of these patterns allows traders to quickly process information about supply and demand dynamics, momentum shifts, and potential reversal points.

However, it is critically important to maintain a balanced and comprehensive approach to market analysis. A trader's strategy should never rely on candlestick analysis alone, but rather should incorporate it in conjunction with other analytical tools and technical analysis indicators. Complementary tools might include trend lines, support and resistance levels, volume analysis, moving averages, momentum oscillators, and various other technical indicators that can confirm or contradict the signals provided by candlestick patterns.

Conclusion

In summary, what wicks mean in trading can be understood as essential visual indicators that provide traders with immediate information about price extremes and market sentiment. Wicks represent a critical component of candlestick chart analysis, offering insights into the battle between buyers and sellers during any given timeframe. Understanding how to interpret wick formations—including their length, position, and context—enables traders to gain valuable insights into the dynamics of buying and selling pressure within the market. Whether analyzing long wicks that suggest potential reversals, or wickless candles that indicate strong directional conviction, this element of technical analysis serves as a powerful tool for understanding price action. However, successful trading requires integrating wick analysis within a broader framework of technical indicators and analytical tools, ensuring a comprehensive and balanced approach to market analysis and decision-making.

FAQ

Are wicks bullish or bearish?

Wicks can be either bullish or bearish depending on direction. Long lower wicks suggest bullish recovery after selling pressure. Long upper wicks indicate bearish rejection after buying pressure. Wicks reveal market sentiment and price rejection levels.

What does a long wick mean in trading?

A long wick indicates significant price movement beyond open or close levels, signaling weakness at the close price. A long lower wick suggests potential bearish reversal, while an upper wick shows buying pressure rejection.

Is a 3 wick candle better?

Three-wick candles are not inherently better; it depends on your trading style. They show stronger rejection at price levels with multiple touches, indicating robust support or resistance. However, single or double-wick patterns can be equally effective for identifying reversals and trend confirmation in different market conditions.

What does wick mean in crypto?

A wick is the thin line extending from a candlestick chart, showing the highest and lowest prices reached during a specific time period. Upper wicks indicate rejected price levels, while lower wicks show support areas traders tested.

* The information is not intended to be and does not constitute financial advice or any other recommendation of any sort offered or endorsed by Gate.
Related Articles
How to Read Crypto Charts: Beginner's Guide to Trading

How to Read Crypto Charts: Beginner's Guide to Trading

This beginner's guide to trading cryptocurrencies explains how to read crypto charts effectively. It covers the fundamentals of chart types — line, bar, and candlestick — and their impact on price movement analysis. The article delves into interpreting candlestick patterns for profitable trades and highlights essential technical indicators like Moving Averages, RSI, and MACD for comprehensive market analysis. It also explores advanced chart analysis techniques such as support, resistance, and market psychology, particularly useful for traders using Gate. This guide is perfect for new and experienced traders looking to enhance their trading strategies and market understanding.
9-18-2025, 4:23:32 AM
How to Interpret MACD, RSI, and Moving Averages for Crypto Trading Signals?

How to Interpret MACD, RSI, and Moving Averages for Crypto Trading Signals?

This article explores crucial cryptocurrency trading indicators—MACD, RSI, Moving Averages, and Bollinger Bands—focusing on their interpretation for recognizing entry and exit points. It addresses traders' need for reliable signals amidst market volatility, with particular emphasis on ChainOpera AI's trading patterns. Readers will understand the indicators' roles, see practical examples, and learn the importance of volume-price analysis in anticipating market shifts. Keywords such as MACD, RSI, Moving Averages, and Volume-price convergence ensure enhanced readability and quick comprehension for crypto traders.
11-17-2025, 12:48:44 PM
How to Interpret MACD, RSI, and Moving Averages for Crypto Trading Signals?

How to Interpret MACD, RSI, and Moving Averages for Crypto Trading Signals?

This article demystifies key technical indicators used in crypto trading, such as MACD, RSI, and KDJ, by explaining their roles in identifying market trends and entry or exit points. It covers how moving averages help spot trend reversals with golden and death crosses. Additionally, the importance of analyzing volume and price divergence is discussed, offering insights into managing risks and predicting potential reversals. Ideal for traders seeking advanced strategies, the article provides actionable guidance on leveraging these tools for better trading decisions.
11-26-2025, 12:13:03 PM
How to Interpret Technical Indicators for Crypto Trading Success?

How to Interpret Technical Indicators for Crypto Trading Success?

This article explores the interpretation of key technical indicators such as MACD, RSI, KDJ, and Bollinger Bands to enhance crypto trading success, specifically for ASTER tokens. It addresses how traders can leverage these indicators to understand market trends, identify reversal points, and anticipate price volatility. Additionally, the significance of moving average crossovers and volume-price divergence patterns are discussed, providing traders with tools to make informed decisions. Suitable for traders seeking to navigate ASTER's dynamic price action, the article highlights the importance of combining multiple indicators for reliable analysis.
11-13-2025, 9:00:52 AM
How to Interpret Multiple Technical Indicators for Cryptocurrency Trading?

How to Interpret Multiple Technical Indicators for Cryptocurrency Trading?

The article explores the interpretation of multiple technical indicators and their application in cryptocurrency trading. It covers MACD, RSI, KDJ, and Bollinger Bands to enhance trading accuracy. It addresses trend identification, momentum measurement, volatility assessment, and short-term signal generation, providing actionable insights for traders. The content structure includes detailed indicator analysis, moving average crossovers, and volume-price divergence implications. Geared towards traders seeking improved prediction accuracy, it merges various technical tools for strategic decision-making. Keywords focus on understanding indicators, trend predictions, and trading improvement.
12-1-2025, 11:48:35 AM
How to Use MACD, RSI, and KDJ Indicators for Technical Analysis of Cryptocurrencies?

How to Use MACD, RSI, and KDJ Indicators for Technical Analysis of Cryptocurrencies?

This article provides a comprehensive guide to using MACD, RSI, and KDJ indicators for cryptocurrency technical analysis. It explains the primary functions, signal types, and best use cases of each indicator, emphasizing their combined use for more accurate trading decisions. It discusses moving averages for identifying golden and death crosses, and highlights their applications in different trading styles. The article also delves into volume and price divergence analysis to detect market reversals. It targets traders looking to enhance their strategies by utilizing these technical tools effectively, optimizing decision-making and risk management.
11-25-2025, 2:29:58 AM
Recommended for You
Top 10 Promising Cryptocurrencies to Consider for 2024 Investments

Top 10 Promising Cryptocurrencies to Consider for 2024 Investments

Discover the top 10 promising cryptocurrencies for 2024 investments, focusing on market fundamentals, technological innovation, and real-world utility. The article addresses key questions about which coins hold value, catering to investors seeking informed decisions. It covers aspects such as market capitalization, trading volume, and adoption, emphasizing Bitcoin, Ethereum, and emerging projects. The structured guide helps investors understand cryptocurrency value indicators and risk management. Optimize your portfolio across valuable assets with strong fundamentals and genuine use cases, staying updated on market trends.
12-18-2025, 4:23:46 PM
Top Wallet Options for Avalanche AVAX: Complete Guide

Top Wallet Options for Avalanche AVAX: Complete Guide

This guide offers a comprehensive overview of the top AVAX wallet options, essential for securely managing and interacting with Avalanche's robust blockchain ecosystem. It highlights key features such as security, portability, multi-currency support, and NFT compatibility, addressing the needs of both novice and advanced users. Presenting nine wallet choices including hardware and mobile solutions, it also dives into criteria for selecting the best AVAX wallet. Designed for cryptocurrency enthusiasts and investors, the article ensures users can make informed decisions on safeguarding their digital assets while optimizing usability.
12-18-2025, 4:19:34 PM
Simple Guide to Purchasing CVT Tokens in India

Simple Guide to Purchasing CVT Tokens in India

This guide provides a comprehensive pathway for selling CV tokens efficiently, catering to both novice and experienced cryptocurrency traders in India. It breaks down critical stages, from understanding CV tokens to selecting the right trading platform with a focus on centralized, decentralized, and peer-to-peer options. The article emphasizes vital considerations like timing, security, and tax implications while minimizing fees. Common mistakes to avoid and methods like OTC trading for large transactions are highlighted. The structured approach ensures readers can optimize their returns and manage digital assets with confidence.
12-18-2025, 4:19:01 PM
Understanding KYC: Essential Verification for Cryptocurrency Platforms in India

Understanding KYC: Essential Verification for Cryptocurrency Platforms in India

This article explores the importance of KYC for cryptocurrency exchanges in India, highlighting security and regulatory considerations. It addresses the safety of providing identification, necessary KYC procedures, potential risks, and best practices for secure transactions. Targeting Indian users navigating the evolving crypto landscape, it emphasizes researching platforms, using established exchanges like Gate, and ensuring robust security. The guide aids in informed decision-making by balancing security features, regulatory compliance, and personal risk tolerance, ultimately promoting a safer trading environment.
12-18-2025, 4:02:39 PM
Cryptocurrencies in Latin America: Trends and Adoption Prospects

Cryptocurrencies in Latin America: Trends and Adoption Prospects

Discover how cryptocurrencies are reshaping financial systems across Latin America. Get insights into emerging technologies, regulatory developments, and market opportunities in key countries like Brazil and Argentina.
12-18-2025, 4:01:07 PM
Worldcoin thành World: Khám phá chuỗi Worldchain Layer 2 và dự án 1 tỷ đô la!

Worldcoin thành World: Khám phá chuỗi Worldchain Layer 2 và dự án 1 tỷ đô la!

Bài viết này khám phá quá trình đổi tên của dự án UMA và tác động của nó lên cộng đồng và giá trị token. Nó giải đáp các thắc mắc về lý do đổi tên, lộ trình chuyển đổi thương hiệu, và cách theo dõi thông tin cập nhật từ các nguồn chính thức. Ngoài ra, bài viết xem xét các kinh nghiệm từ dự án đã đổi tên thành công và phân tích cơ hội và thách thức sau quá trình tái cấu trúc thương hiệu. Đây là một tài liệu hữu ích cho nhà đầu tư và người dùng trong việc hiểu rõ những thay đổi quan trọng của dự án.
12-18-2025, 3:57:56 PM