15 Key Bitcoin Market Top Indicators
Forward the Original Title: 15 Key Indicators for Exiting at the Peak of a Bitcoin Bull Market

Design | Senka
I remember that in an article in December 2022, we once helped you sort out 10 Bitcoin indicators, and believed that it had entered the later stage of the bear market at that time, and it was also a better time to start to DCA-in. As shown below.

Two years have passed in the blink of an eye, and we finally have the long-awaited new round of bull market.
While it’s said that bear markets have no bottom and bull markets have no ceiling, many people seem to enjoy searching for answers to this question. So, in the spirit of research, let’s share 15 indicators for timing the peak of the Bitcoin market.
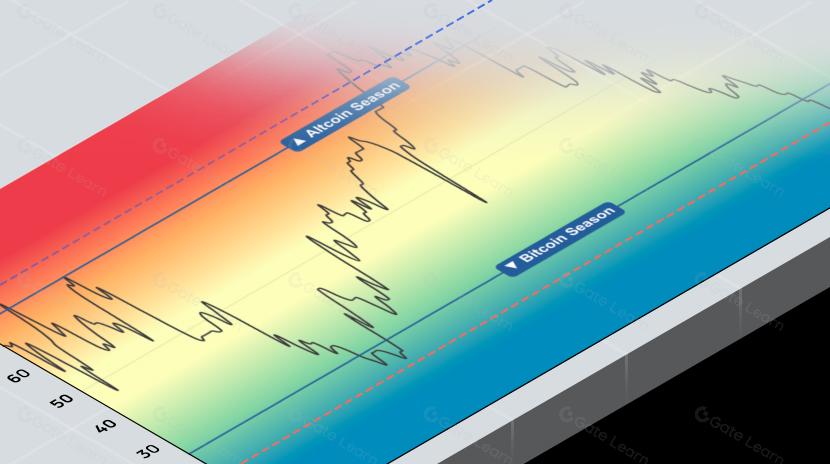
Indicator No. 1: Rainbow Price Chart Indicator
As a long-term value valuation tool for Bitcoin, everyone should be familiar with the rainbow chart indicator, or at least have heard of it. This indicator uses a logarithmic growth curve to predict the potential future price direction of Bitcoin. It superimposes rainbow color bands. At the top of the logarithmic growth curve channel, to highlight the market sentiment in each rainbow-colored phase as Bitcoin price moves, the top escape location suggested here can be chosen between the yellow and red zones. As shown below.

Indicator No 2: Terminal Price
This indicator has proven highly reliable for predicting Bitcoin price cycle peaks. Historical data shows clear validation - Bitcoin hit the indicator’s red line during both the November-December 2017 and March-May 2021 bull market tops. The strategy is straightforward: consider selling when Bitcoin’s price approaches or touches the red line. Based on current projections, this terminal price level is approximately $170,000. As shown below.

Indicator No 3: Stock-to-Flow Model (S2F Model)
The Stock-to-Flow (S2F) model tracks Bitcoin’s price movements relative to its scarcity. When Bitcoin’s price rises above the S2F baseline, the divergence indicator shifts from green to red, signaling potential overvaluation. Conversely, when the price falls below the S2F line, the indicator turns from red to green, suggesting undervaluation. Current S2F model projections indicate Q1 2025 could present an optimal selling opportunity. As shown below.

Indicator No 4: Pi Cycle Top Indicator
This indicator combines two moving averages to identify potential market cycle tops: the 111-day moving average (111DMA) and twice the 350-day moving average (350DMA x 2). During the past three bull cycles, market peaks occurred when the 111DMA crossed above the 350DMA x 2. Currently, the indicator’s green line (350DMA x 2) sits at $120,000, suggesting Bitcoin may reach its peak after surpassing this level. As shown below.

Indicator No. 5: The Puell Multiple
The Puell Multiple highlights two key Bitcoin price zones. When it enters the green box area, Bitcoin is considered significantly undervalued. Conversely, when it enters the red box area, Bitcoin is likely overvalued. Based on current market conditions, consider initiating sales when the indicator exceeds 2, and consider a full exit when it surpasses 3. As shown below.

Indicator No. 6: Miner Revenue (Fees vs Rewards)
Historically, during bull markets, miner fee percentages have spiked significantly as Bitcoin approaches peak prices. This occurs because new market participants generate increased network transactions, driving up demand. Current analysis suggests considering batch sales when miner fees exceed 30% of total miner revenue. As shown below.

Indicator No 7: MVRV Z-Score
This indicator is an indicator that determines whether Bitcoin is undervalued or overvalued. Historically, since 2011, whenever the MVRV Z-score has a value close to or greater than 7, it has indicated that the market is entering a top. As shown below.

Indicator No 8: Net Unrealized Profit/Loss (NUPL)
This indicator evaluates the unrealized gains or losses of Bitcoin holdings across the market. When the indicator reaches or exceeds 75%, it historically signals a potential market top and suggests considering taking profits. As shown below.

Indicator No 9: 2-Year MA Multiplier
This indicator uses the 2-year MA (moving average), and the multiplication of that moving average, which is the 2-year MA x 5, to make predictions about Bitcoin’s price. Historically, the best time to sell Bitcoin would be when the price of Bitcoin is close to or above the 2-year MA x 5 (i.e. the red line on the chart). As shown below.

Indicator No 10: 200 Week Moving Average Heatmap
This indicator creates a color-coded heatmap reflecting the 200-week moving average’s growth rate. The chart colors shift based on the month-over-month percentage changes. When the chart displays orange or red dots, it typically signals market overheating and presents an optimal opportunity to take profits. As shown below.

Indicator No. 11: The Golden Ratio Multiplier
This indicator uses multiples of the Bitcoin’s 350-day moving average (350DMA) to identify price potential resistance zones. Based on current readings, the area that exceeds the green line and reaches the red line is a relatively good batch selling range. As shown below.

Indicator No. 12: RHODL Ratio
This indicator measures the ratio of realized value HODL waves. When the orange line nears or enters the red band area, it signals market overheating and suggests taking profits in stages. As shown below.

Indicator No 13: Coin Days Destroyed
This indicator reveals when old, dormant Bitcoins become active and return to the market. When long-term holders begin moving their coins, it typically signals their intention to take profits. Consequently, we often observe significant spikes in CDD just before market peaks. As shown below.

Indicator No. 14: Bitcoin Bull Run Index (CBBI)
This indicator combines data from 9 other indicators to help determine Bitcoin’s market cycle phase. A higher score suggests Bitcoin may be approaching a market peak. Based on current data, consider initiating gradual sales when the indicator’s value surpasses 80. As shown below.

Indicator No 15: Ahr999
This indicator was created by a Chinese crypto enthusiast known as Ahr999 in the “Hoarding Bitcoin” e-book. Ahr999 has since left the cryptocurrency space, and none of the current online accounts using this name belong to the original creator. The indicator’s calculation formula is: (Bitcoin price/200-day fixed investment cost) × (Bitcoin price/exponential growth valuation), where exponential growth valuation is derived from the relationship between Bitcoin’s price and age.
Also known as the Bitcoin Hoarding Indicator, it offers straightforward guidance: when the index falls below the green line (1.2), it signals a fixed investment opportunity; when it drops below the red line (0.45), it indicates prime buying opportunities. Conversely, when the index rises above the green line, it suggests considering sales. Currently, this indicator appears more useful for long-term investment planning rather than identifying market tops. As shown below.

In addition to the above indicators, if you like to study candlestick charts, you can also combine weekly or monthly MACD, RSI and other indicators as supplementary reference. At the same time, all these cyclical indicators can not only be used to assist in guiding the selling (peak exit) operation in the bull market, but are also suitable for seizing the accumulation opportunity to hoard currency during the bear market.
In short, there are still many indicators for Bitcoin. Although we have shared 15 indicators, the point here is not to use all indicators, but to select the ones you think are the most effective and use them for long-term supplementary reference.
No single indicator is perfect, and when an indicator is paid attention to by everyone, it may no longer be a perfect indicator, and what you need is to find new integration points from different indicators. In addition, it’s essential to stay up-to-date, considering changes in national policies regarding the crypto industry, global macroeconomic conditions, and other factors for comprehensive evaluation and judgment.
Throughout this relatively lengthy trading process, we also need to maintain enough patience and constantly improve our trading strategies and trading disciplines.
Lastly, it’s worth emphasizing that all data indicators are projections or model calculations based on historical data and can only be used as auxiliary reference. Your trading operations should also be based on your own risk preferences and positions. The decision is made based on the management situation, and the indicators we listed above are all cyclical indicators, which have limited guiding significance for short-term operations.
Note: The above content is only a personal perspective and analysis. It is only used for learning records and communication and does not constitute any investment advice. If any projects or websites are mentioned in the article, they have no direct interest relationship with Hualihuawai (Hualihuawai does not accept advertisements from any project party). Please independently evaluate the safety of related projects or websites. Investments always carry risks. If you don’t understand the situation, don’t get involved; if you can’t afford to lose, don’t play.
Disclaimer:
- This article is reproduced from [Hua Li Huawai]. Forward the original title “15 Key Indicators for Exiting at the Peak of a Bitcoin Bull Market”. The copyright belongs to the original author [Hua Li Huawai]. If you have any objections to the reprint, please contact Gate Learn team, the team will handle it as soon as possible according to relevant procedures.
- Disclaimer: The views and opinions expressed in this article represent only the author’s personal views and do not constitute any investment advice.
- Other language versions of the article are translated by the Gate Learn team. Unless otherwise stated, the translated article may not be copied, distributed or plagiarized.
Share
Content
Indicator No. 1: Rainbow Price Chart Indicator
Indicator No 2: Terminal Price
Indicator No 3: Stock-to-Flow Model (S2F Model)
Indicator No 4: Pi Cycle Top Indicator
Indicator No. 5: The Puell Multiple
Indicator No. 6: Miner Revenue (Fees vs Rewards)
Indicator No 7: MVRV Z-Score
Indicator No 8: Net Unrealized Profit/Loss (NUPL)
Indicator No 9: 2-Year MA Multiplier
Indicator No 10: 200 Week Moving Average Heatmap
Indicator No. 11: The Golden Ratio Multiplier
Indicator No. 12: RHODL Ratio
Indicator No 13: Coin Days Destroyed
Indicator No. 14: Bitcoin Bull Run Index (CBBI)
Indicator No 15: Ahr999


Related Articles

In-depth Explanation of Yala: Building a Modular DeFi Yield Aggregator with $YU Stablecoin as a Medium

BTC and Projects in The BRC-20 Ecosystem

What Is a Cold Wallet?

Blockchain Profitability & Issuance - Does It Matter?
What is the Altcoin Season Index?