Trade
Basic
Futures
Futures
Hundreds of contracts settled in USDT or BTC
TradFi
Gold
Trade global traditional assets with USDT in one place
Options
Hot
Trade European-style vanilla options
Unified Account
Maximize your capital efficiency
Demo Trading
Futures Kickoff
Get prepared for your futures trading
Futures Events
Participate in events to win generous rewards
Demo Trading
Use virtual funds to experience risk-free trading
Earn
Launch
CandyDrop
Collect candies to earn airdrops
Launchpool
Quick staking, earn potential new tokens
HODLer Airdrop
Hold GT and get massive airdrops for free
Launchpad
Be early to the next big token project
Alpha Points
Trade on-chain assets and enjoy airdrop rewards!
Futures Points
Earn futures points and claim airdrop rewards
Investment
Simple Earn
Earn interests with idle tokens
Auto-Invest
Auto-invest on a regular basis
Dual Investment
Buy low and sell high to take profits from price fluctuations
Soft Staking
Earn rewards with flexible staking
Crypto Loan
0 Fees
Pledge one crypto to borrow another
Lending Center
One-stop lending hub
VIP Wealth Hub
Customized wealth management empowers your assets growth
Private Wealth Management
Customized asset management to grow your digital assets
Quant Fund
Top asset management team helps you profit without hassle
Staking
Stake cryptos to earn in PoS products
Smart Leverage
New
No forced liquidation before maturity, worry-free leveraged gains
GUSD Minting
Use USDT/USDC to mint GUSD for treasury-level yields
More
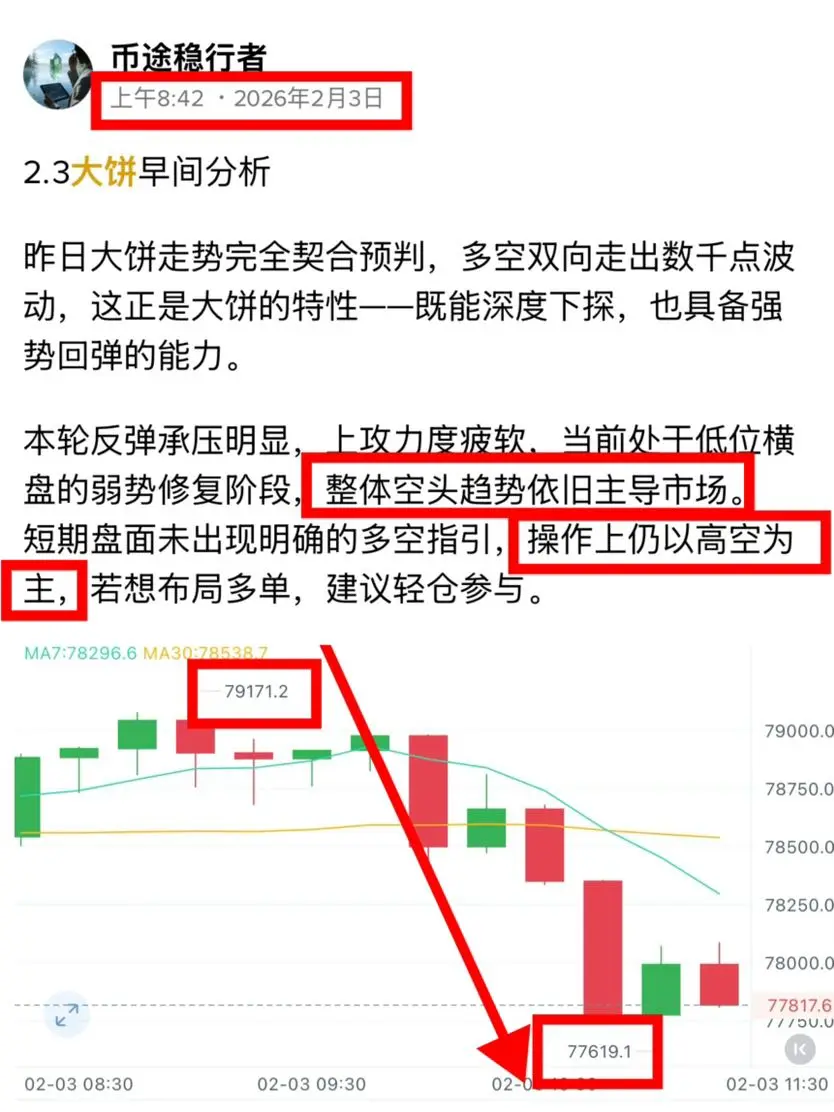
东哥财运
2.3 Midday Strategy
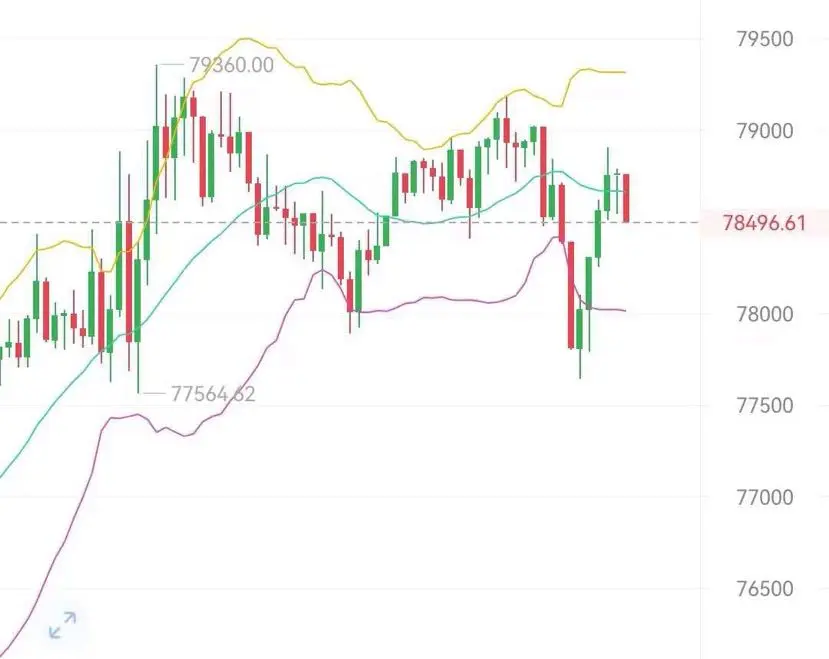
Based on the current market situation of Bitcoin, short-term fluctuations are intensifying, but trading volume remains moderate, indicating that the bulls are unable to organize an effective rebound, and upward momentum has already weakened. From a technical perspective, the hourly KDJ indicator shows a death cross at high levels and is diverging downward. The midday strategy is to maintain a high-rebound and high-short position.
Bitcoin: Range of 79,000-79,600, with a target near 77,500#BTC何时反弹? $BTC
BTC4,41%
- Reward
- like
- Comment
- Repost
- Share
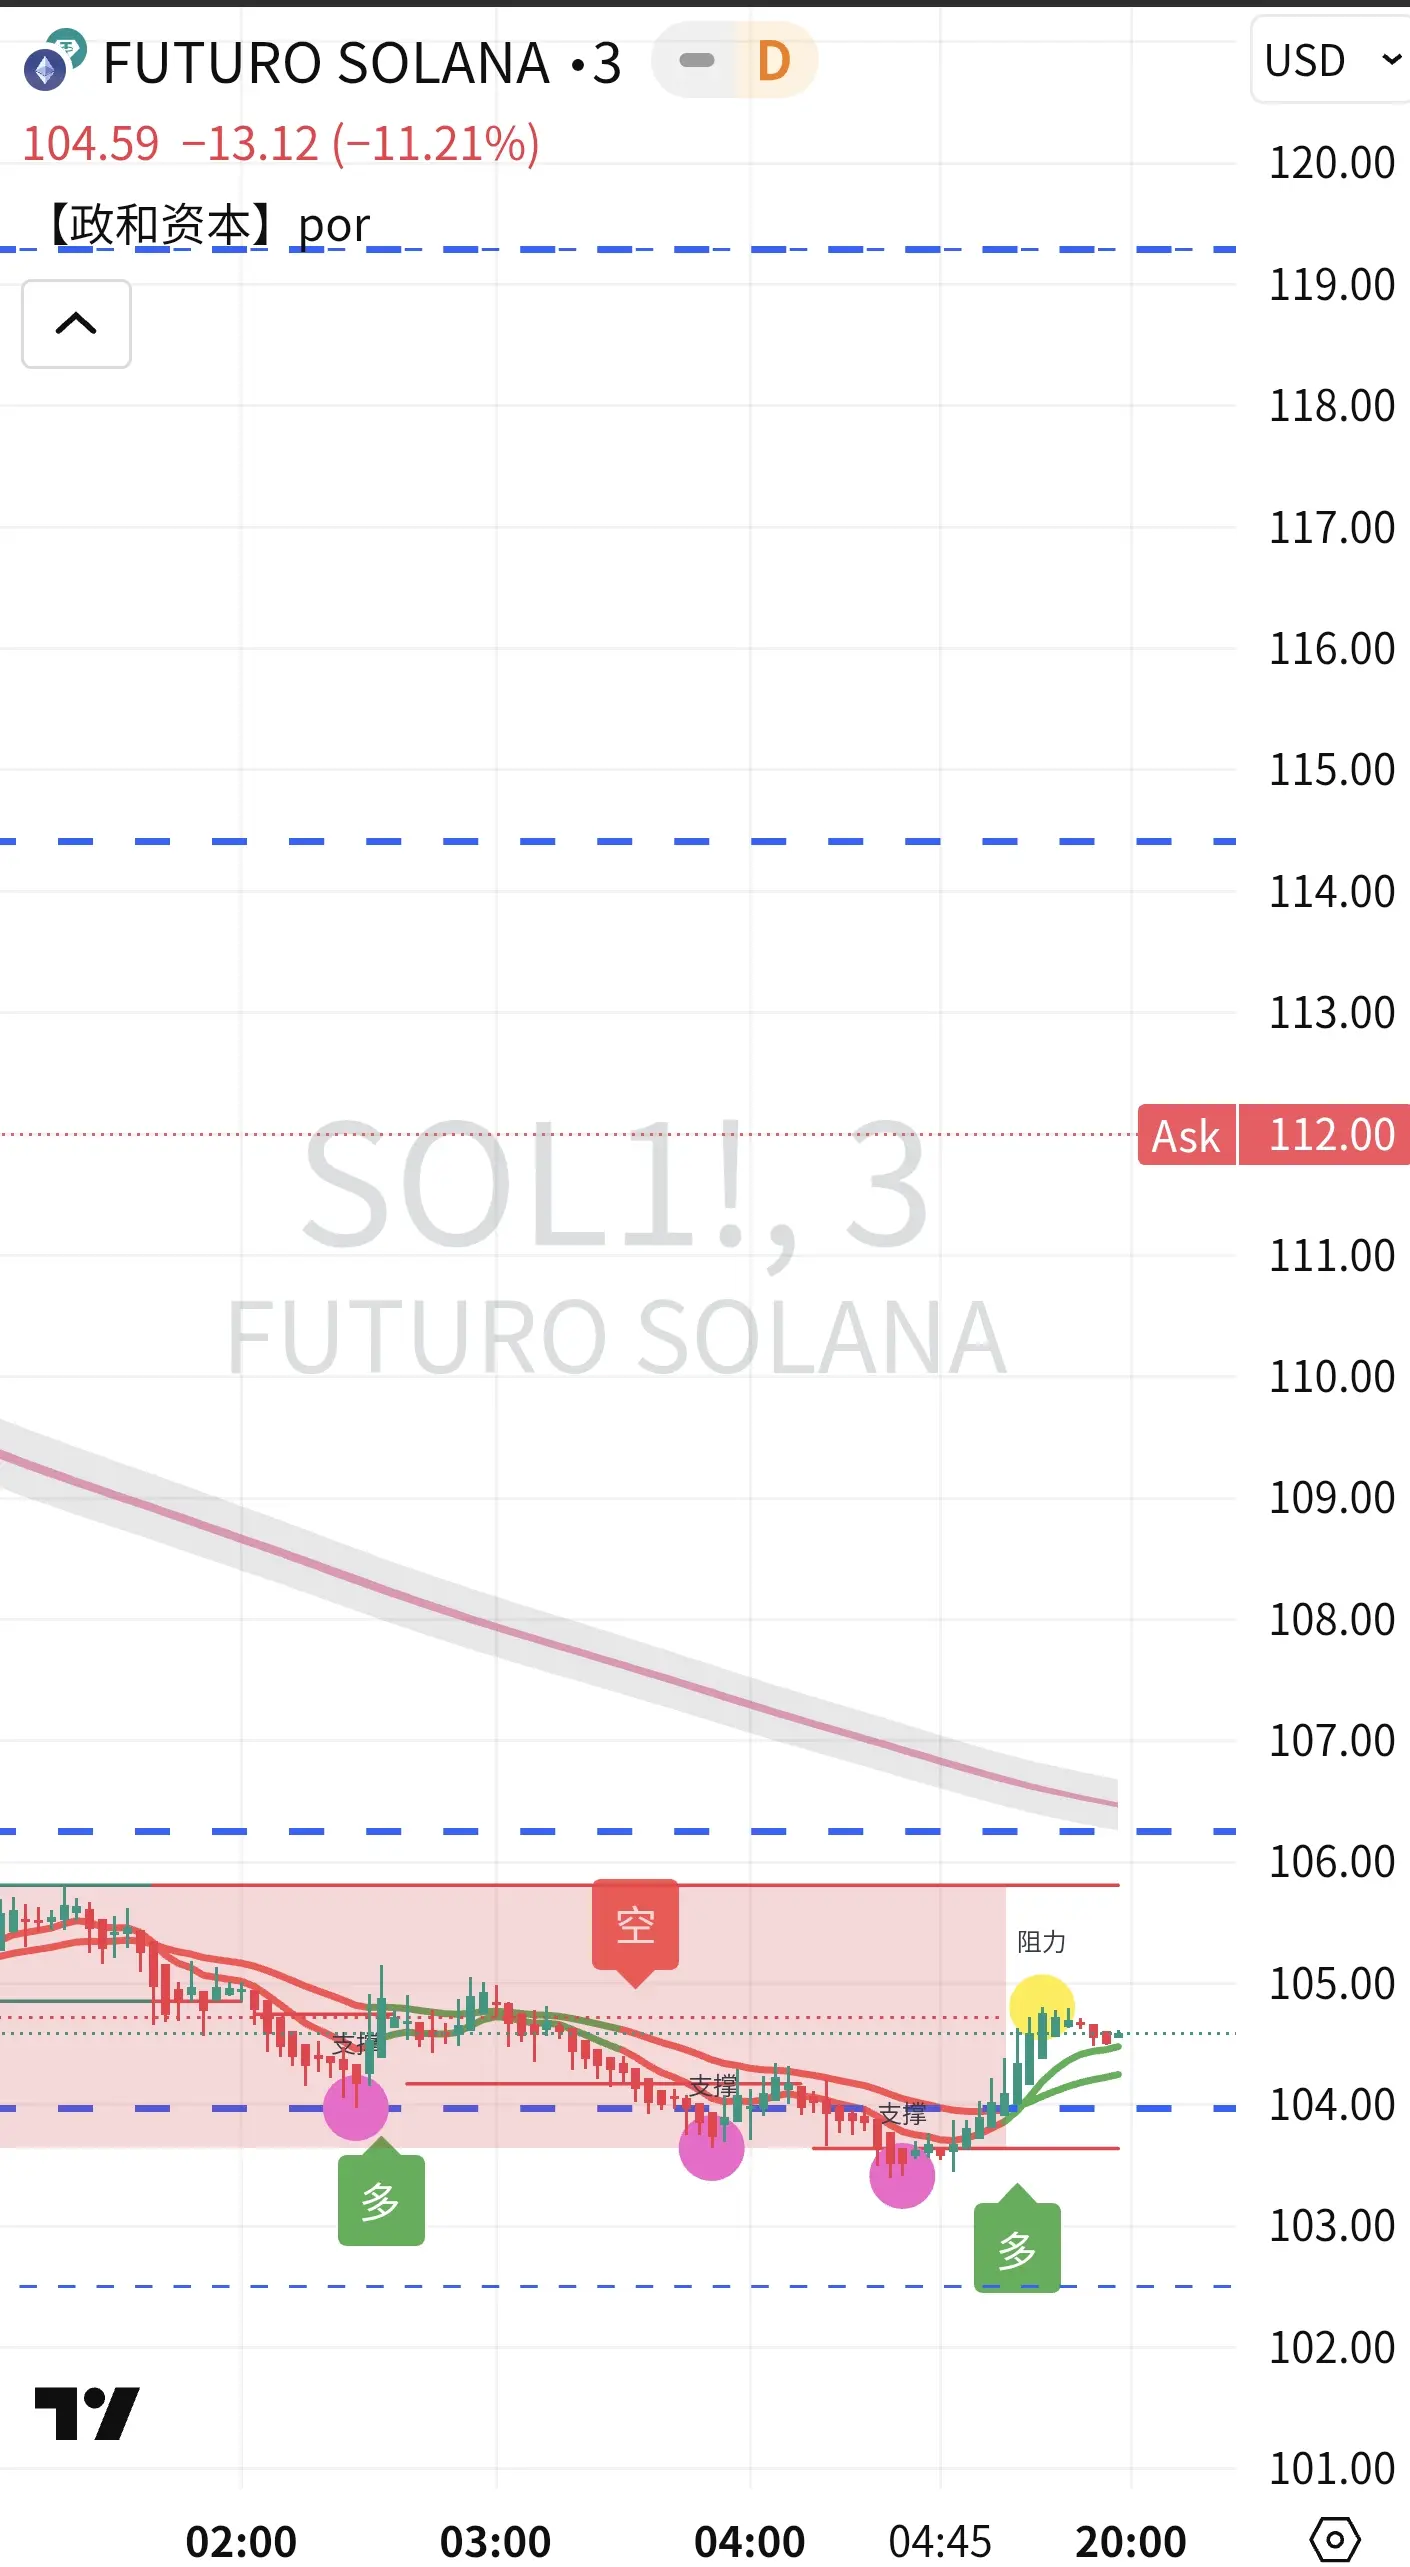
February 3, 2026 11:30 (UTC+8), SOL is currently trading at $104.8, after a brief dip to $95.9 in the past 24 hours followed by a rebound, with an increase of about 3%, indicating oversold weak correction, with the bearish dominance unchanged.
📊 Key Levels and Indicator Overview
- Resistance: $108-110/$117/$125; Support: $100/$96/$90 (Strong support at $96).
- Moving Averages: 50/200-day moving averages are in a bearish alignment, with the price well below the averages, indicating strong bearish pressure.
- RSI(14): 30-32, moving away from extreme oversold conditions, weak rebound not a rever
SOL5,57%
- Reward
- 1
- Comment
- Repost
- Share
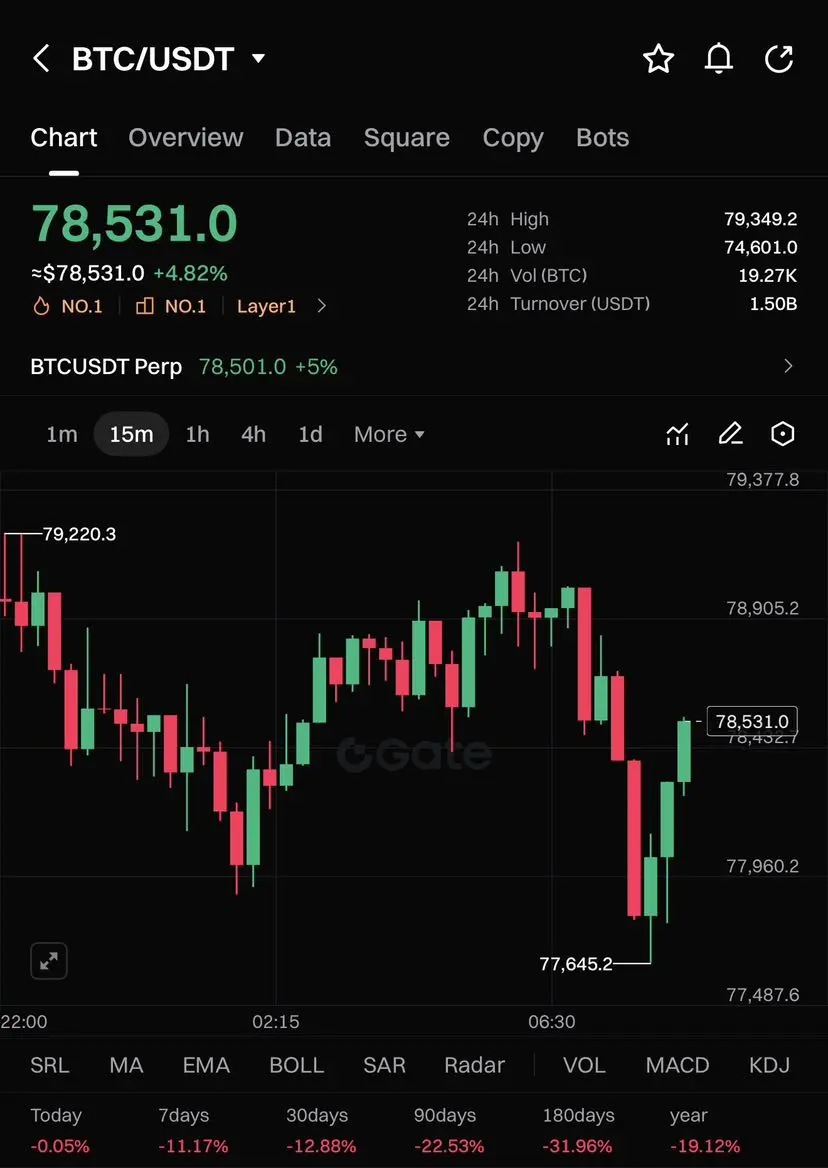
$BTC snapped back fast after a sharp downside sweep. Strong reaction shows buyers still defending key zones.
Structure remains intact with a clear liquidity grab and immediate reclaim.
EP
78,200 – 78,600
TP
TP1 79,000
TP2 79,800
TP3 81,000
SL
77,400
Liquidity below 77,700 got fully swept, stops cleared, and price rebounded aggressively. This looks like a classic shakeout before continuation. As long as BTC holds above reclaimed support, upside expansion stays on the table.
Let’s go $BTC
BTC4,41%
- Reward
- like
- Comment
- Repost
- Share
LK
Loky
Created By@BaaM
Listing Progress
0.00%
MC:
$2.87K
Create My Token
- Reward
- like
- Comment
- Repost
- Share
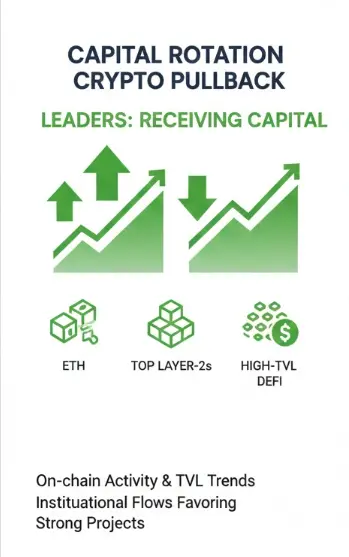
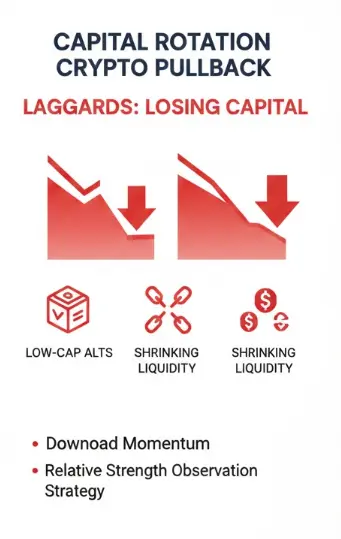
#CapitalRotation
⚡ Trading Patterns Shifting During Pullback – Dragon Fly Official
Markets are experiencing a pullback, and trading patterns are evolving as capital rotates between assets and sectors.
Key Observations:
• ETH & Layer-2: Funds are flowing into top-tier projects with strong adoption
• Altcoins: Weak performers are seeing capital exit, creating relative strength for leaders
• On-Chain Activity: Liquidity is concentrating in quality projects with high TVL and active networks
• Institutional Flows: Favor projects with structural demand and staking opportunities
Takeaway:
During pul
ETH6,16%
- Reward
- 1
- 1
- Repost
- Share
QueenOfTheDay:
2026 GOGOGO 👊Some people say that our STTW coin has no future development. We haven't responded because we have always been number one. Others say we are just harvesting profits, but we haven't sold a single coin from our holdings. I don't want to explain, I don't want to speak. Let time prove everything.
View Original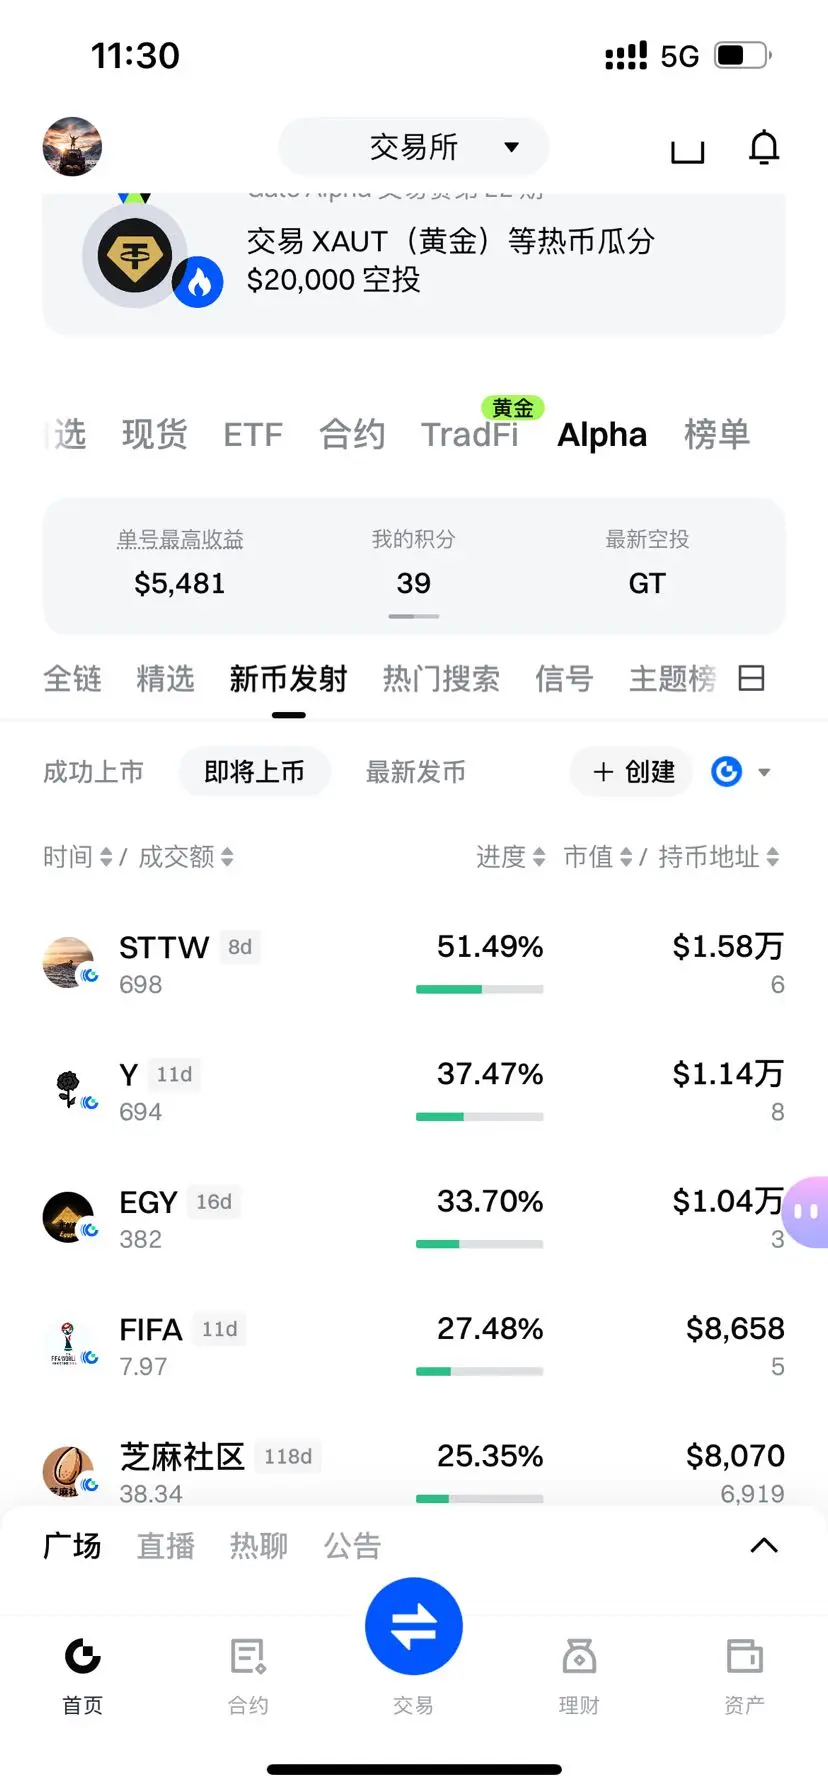
[The user has shared his/her trading data. Go to the App to view more.]
- Reward
- like
- Comment
- Repost
- Share
- Reward
- 2
- 3
- Repost
- Share
Ryakpanda :
:
Stay strong and HODL💎View More
#CryptoMarketWatch
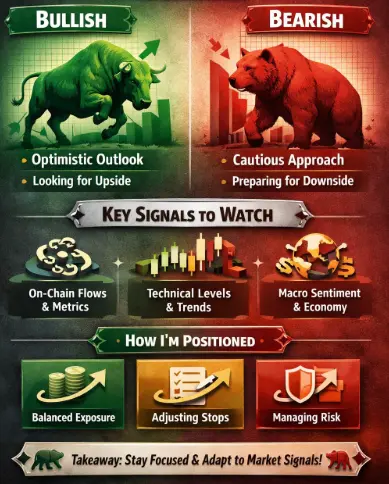
⚡ Crypto Market Volatility — Bulls vs Bears
Recent market swings have intensified, creating clear divergence between bullish and bearish sentiment.
Key Questions:
• Are you leaning bullish or cautious on what comes next?
• Which signals are you watching — on-chain flows, technical levels, or macro trends?
• How are you positioning your portfolio amid volatility?
Considerations:
• Price Action: Watch support/resistance zones for breakout or breakdown confirmation
• Capital Flow: Observe where funds are rotating — BTC, ETH, altcoins, or stablecoins
• On-Chain Metrics: Active
- Reward
- 1
- 1
- Repost
- Share
QueenOfTheDay:
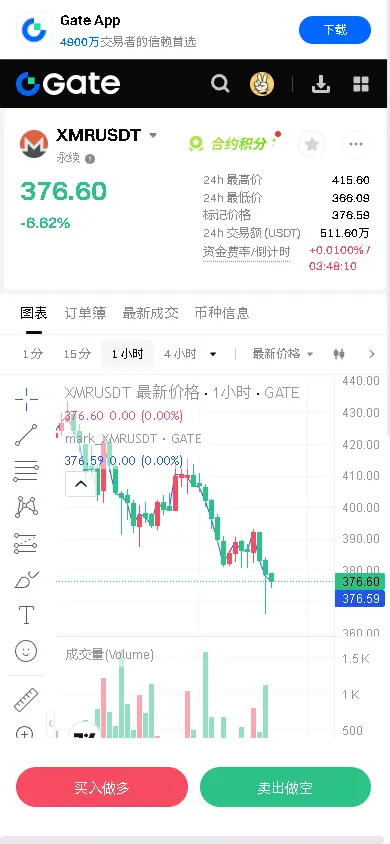
2026 GOGOGO 👊【$XMR Signal】Empty Position + Downward Volume Expansion Observation
$XMR is experiencing a volume-driven decline, with a daily drop exceeding 6%, alerting to the ongoing battle between bulls and bears behind the changes in open interest.
🎯 Direction: Empty Position
The current market shows clear selling pressure, with price action (PA) indicating a one-sided downward trend. The key point is to distinguish whether this is a liquidity washout caused by a short squeeze or sustained selling by major funds. Until clear bottom absorption structures and shrinking volume signals appear, it is not a
BTC4,41%
- Reward
- like
- 5
- Repost
- Share
Alvinxxxxxxxxxxxxxxxxxxx:
Bull Run 🐂View More
#HongKongIssueStablecoinLicenses HongKongIssueStablecoinLicenses 🇭🇰💱
Hong Kong is making a strategic move in the digital asset space — advancing its framework to issue stablecoin licenses and regulate fiat-backed digital currencies.
This isn’t just policy talk. It’s a signal.
📌 Why this matters:
• Clear licensing = stronger investor protection
• Regulated stablecoins = more institutional confidence
• Positioning Hong Kong as a Web3 finance hub
• Direct competition with US & Singapore crypto frameworks
Stablecoins are the backbone of crypto liquidity.
Whoever controls the regulatory clarity

- Reward
- 2
- 4
- Repost
- Share
HighAmbition:
HODL Tight 💪View More
#AltcoinDivergence
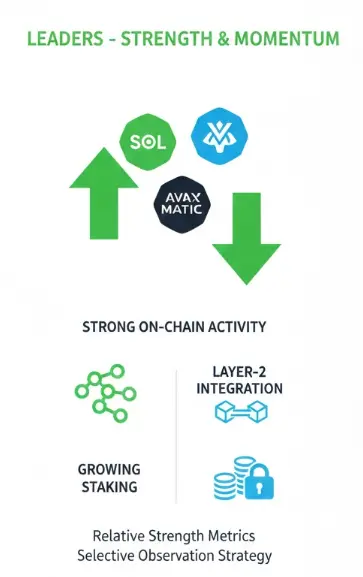
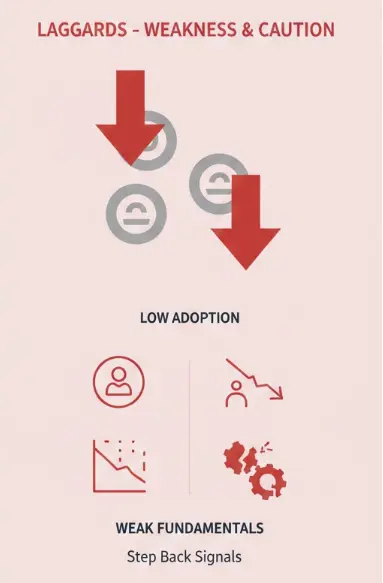
⚡ Altcoin Divergence – Dragon Fly Official
Altcoin performance is splitting — some projects outperforming, others lagging behind. Traders face a choice: step back or selectively engage.
Key Points:
• Selective Observation: Focus on altcoins showing relative strength vs the broader market
• Fundamentals Matter: On-chain activity, Layer-2 adoption, staking, and development signal quality
• Step Back When Unclear: Avoid chasing weak performers during volatile periods
• Risk Management: Position sizing and stop-losses are essential for high-volatility altcoins
Takeaway:
When th
- Reward
- 2
- 2
- Repost
- Share
QueenOfTheDay:
Happy New Year! 🤑View More
loser
loser
Created By@GateUser-8e1712fd
Listing Progress
0.00%
MC:
$2.87K
Create My Token
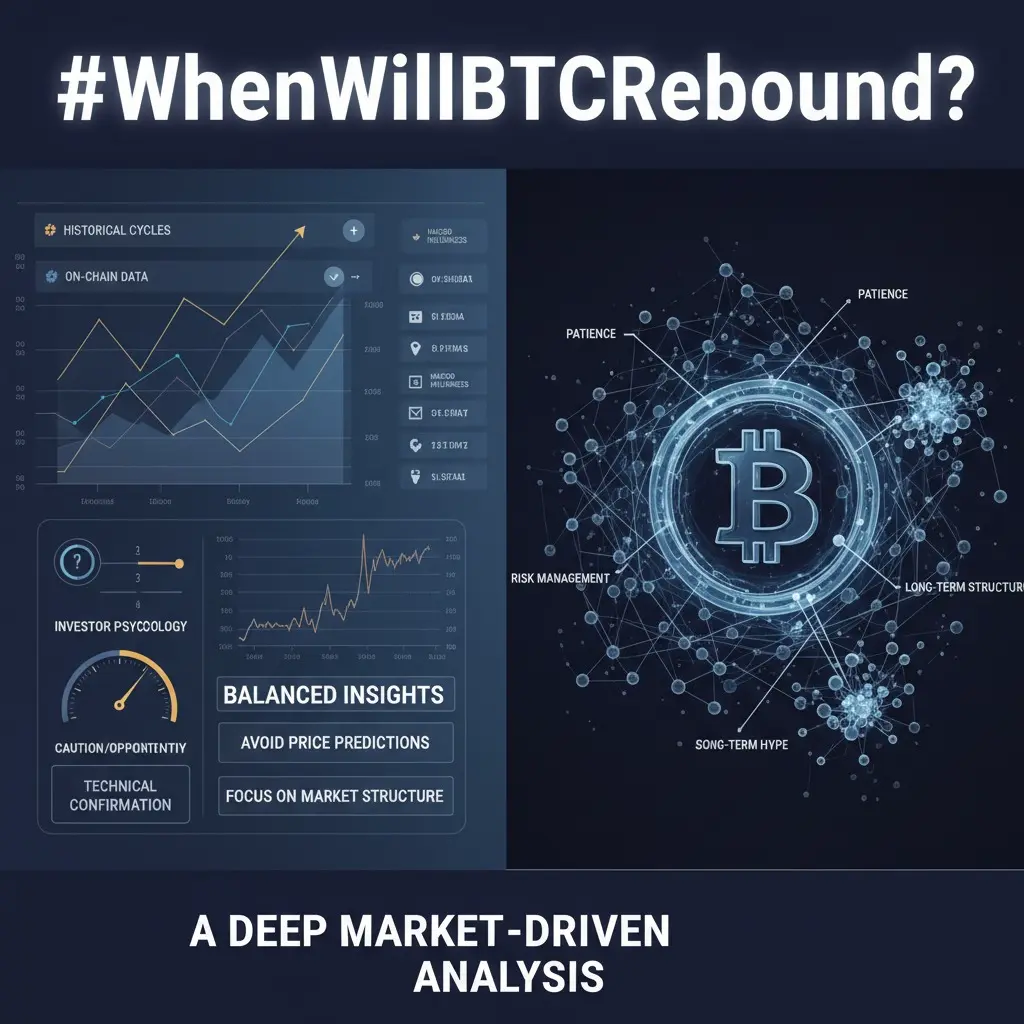
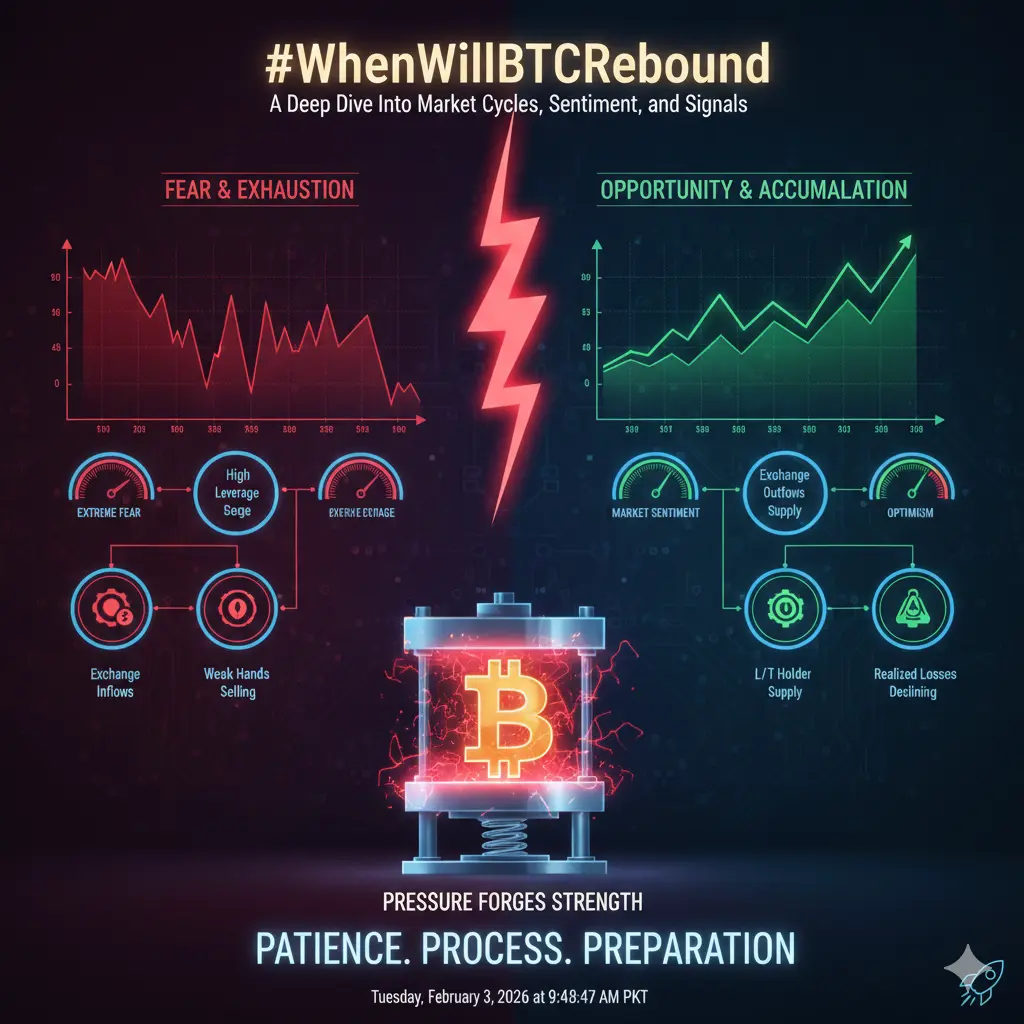
#WhenWillBTCRebound?
A Deep Dive Into Market Cycles, Sentiment, and Signals
Bitcoin has always been a market of patience, psychology, and cycles. Every major correction sparks the same question among traders and investors alike: When will BTC rebound? While no one can predict the exact day or price, history, on-chain data, and macro trends give us powerful clues about where we are in the cycle and what conditions typically lead to a rebound.
Understanding Bitcoin’s Cyclical Nature
Bitcoin does not move in straight lines. It moves in cycles of expansion, correction, consolidation, and continua
BTC4,41%
- Reward
- 2
- 3
- Repost
- Share
HighAmbition:
Ape In 🚀View More
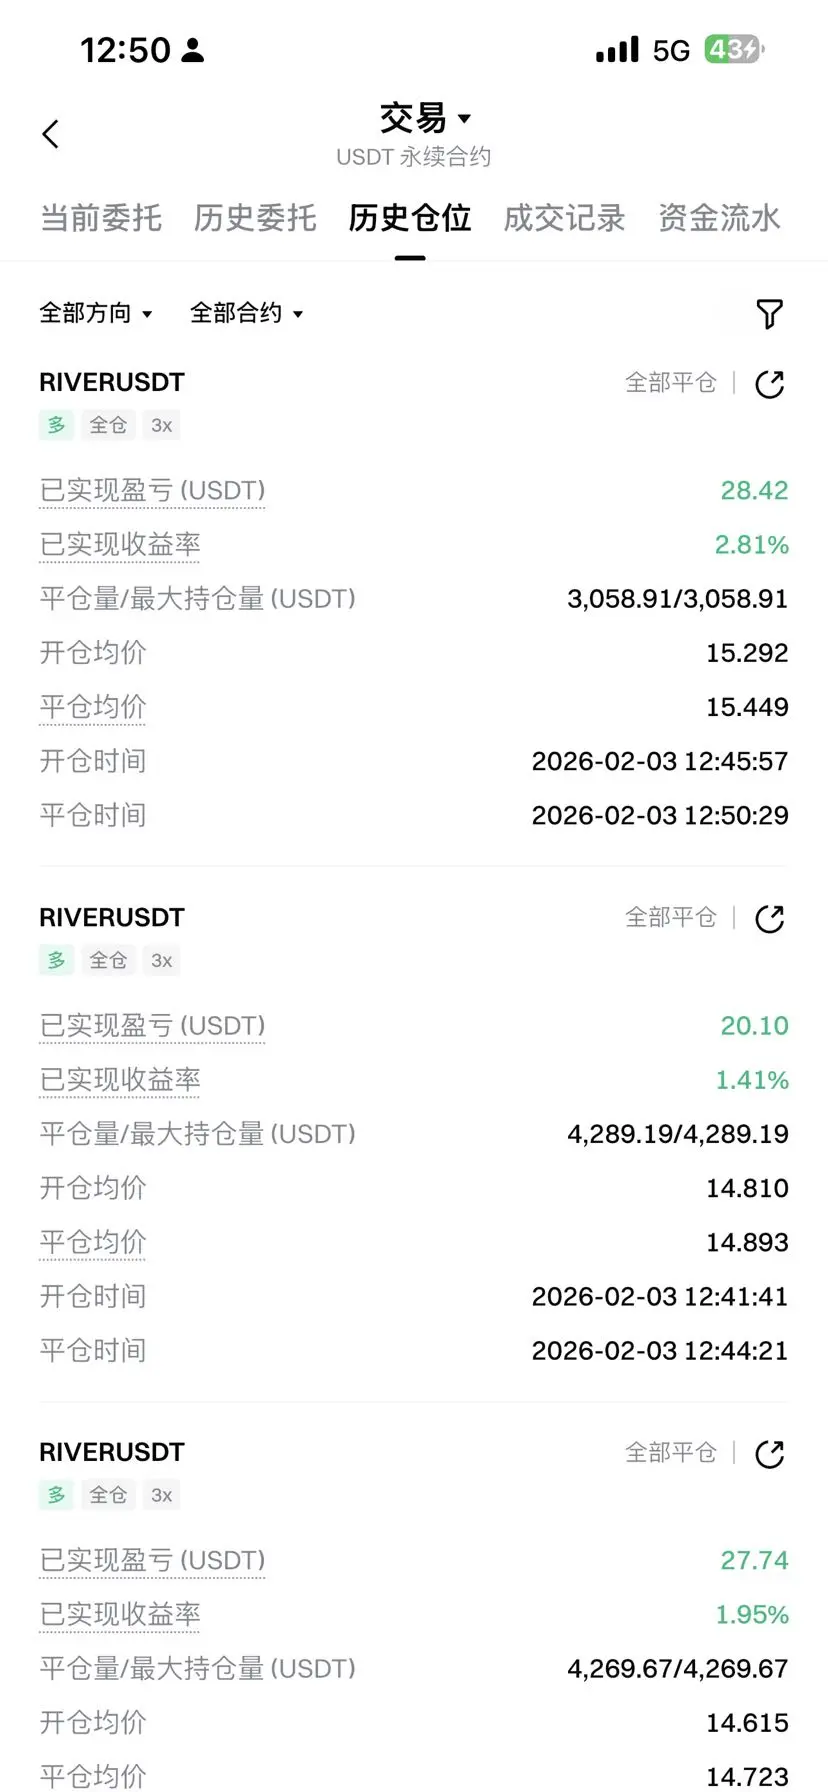
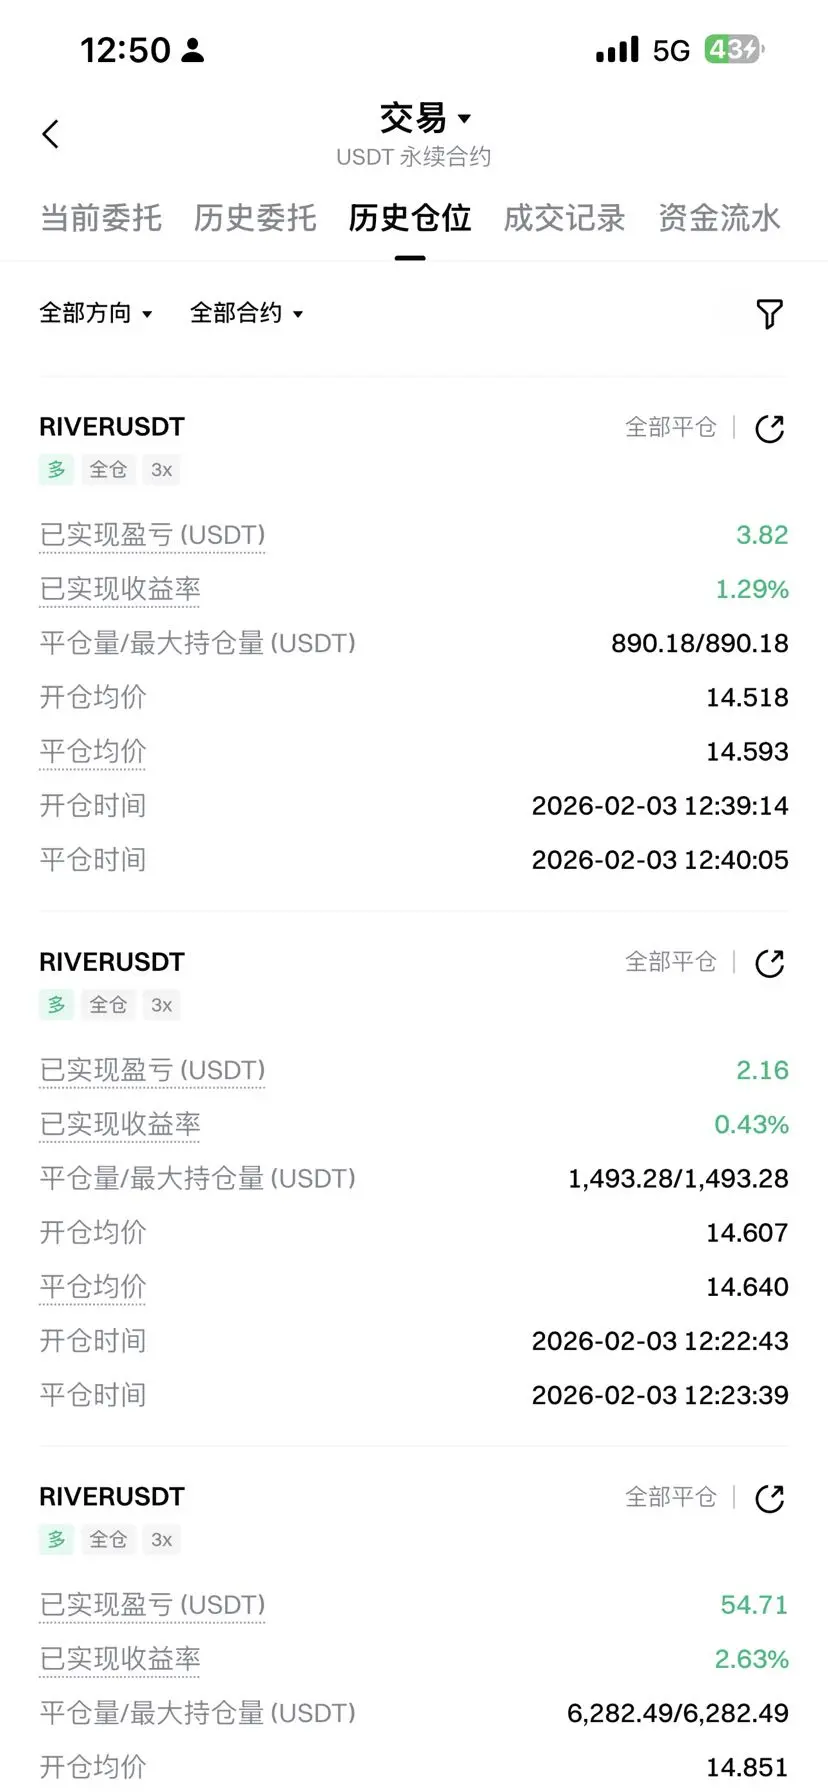
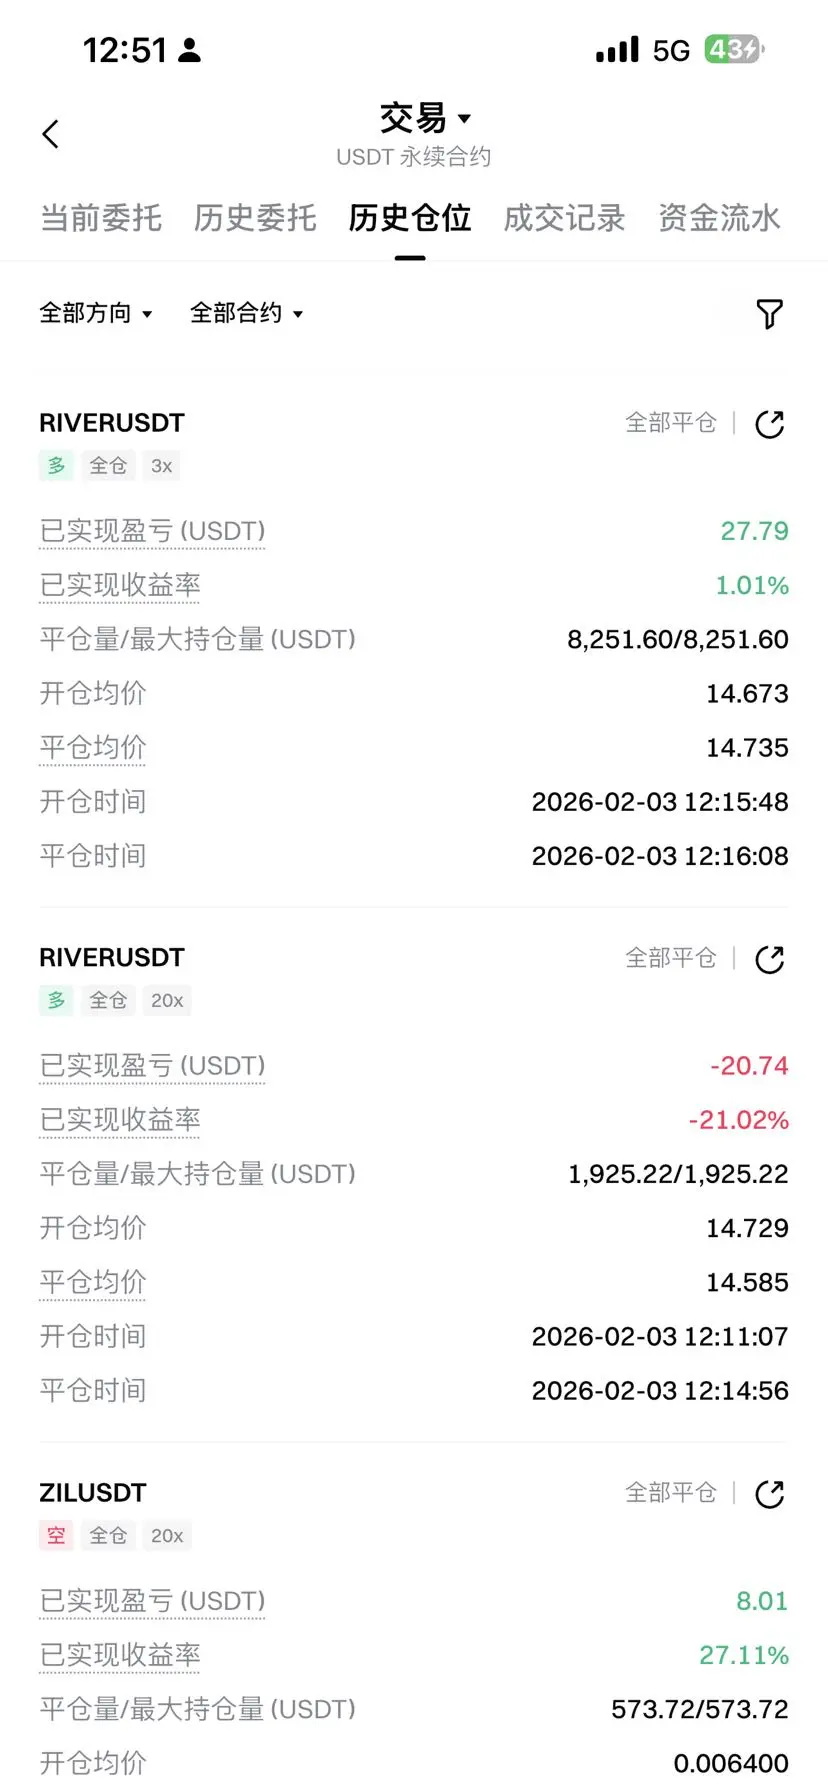
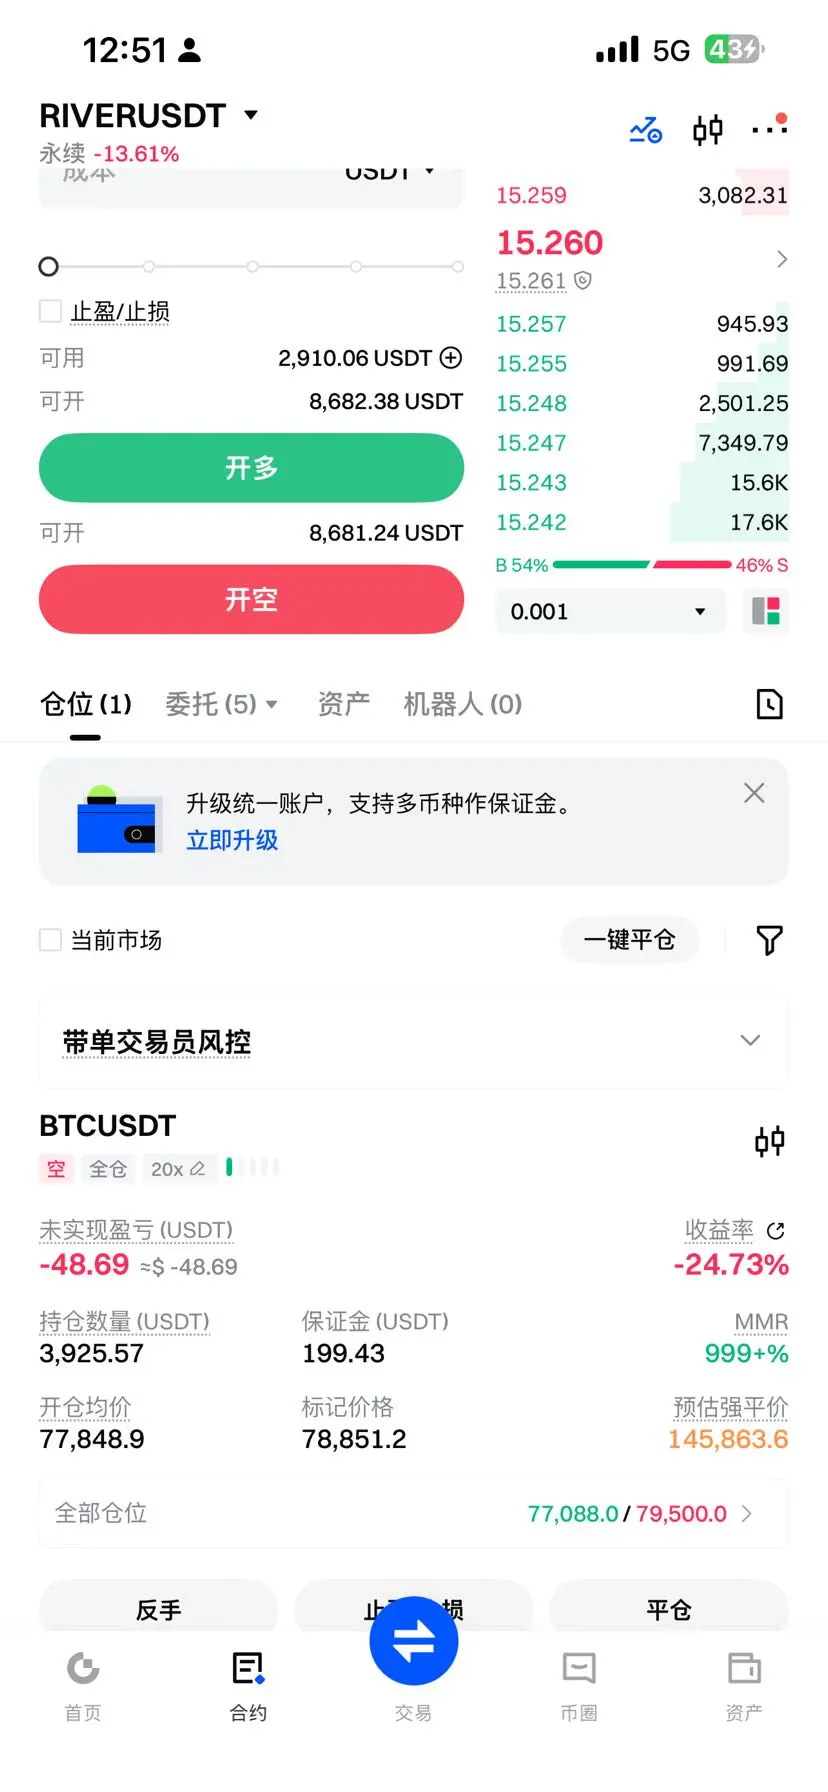
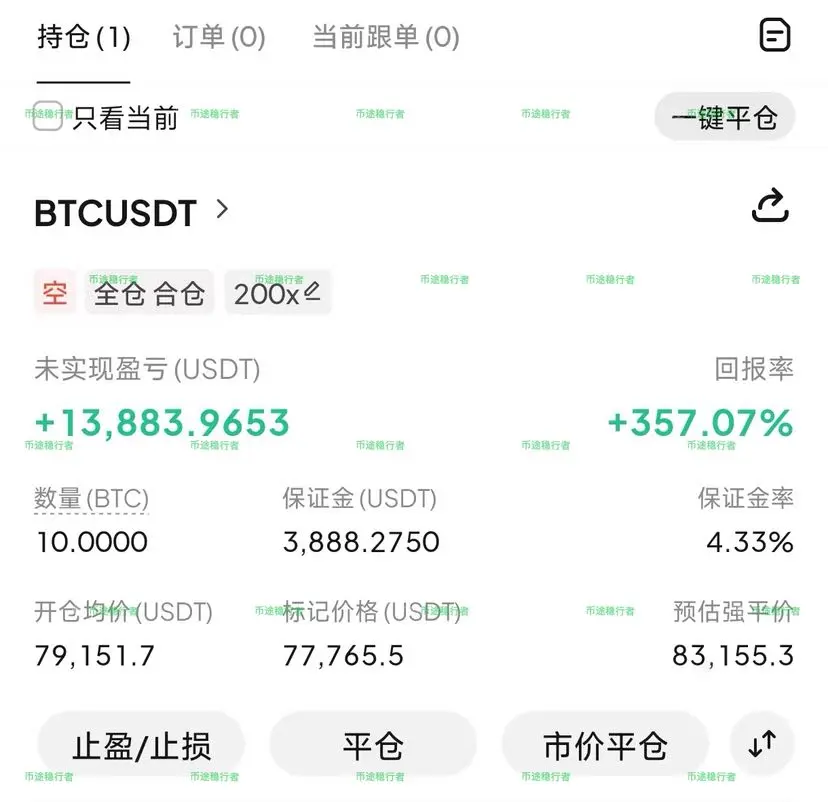
Check out the results of over a month of live trading with a $5,000 investment!
View Original
- Reward
- 1
- Comment
- Repost
- Share
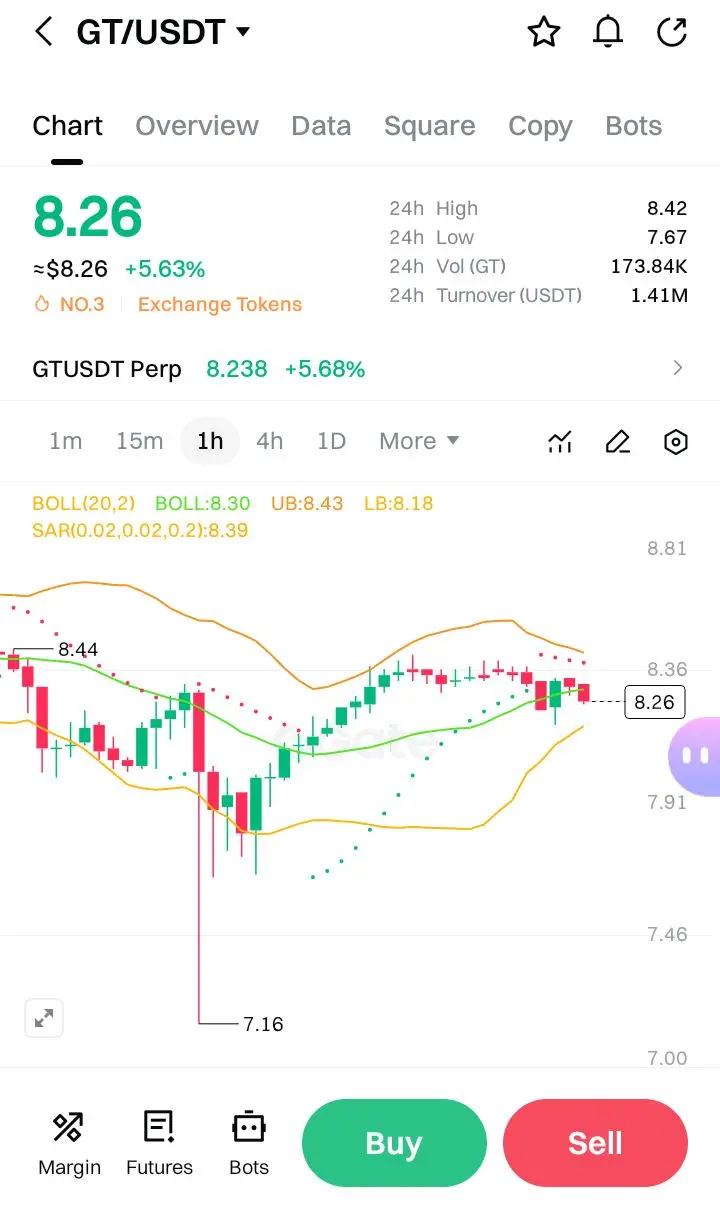
$GT GT/USDT, Here is a technical analysis:
Current Status & Indicators:
1. Price Action:
· Current price: ~8.238 USDT
· Trading near the upper Bollinger Band (UB: 8.43).
· Strong bullish move in recent candles, but the latest candle is showing a pullback or indecision (small body with wicks).
2. Bollinger Bands (20,2):
· Upper Band (UB): 8.43 – acts as resistance.
· Middle Band (BOLL): 8.30 – dynamic support.
· Lower Band (LB): 8.18 – near-term support.
· Price is hovering close to the upper band, suggesting a potential overbought condition in the short term.
3. SAR (Parab
GT6,29%

- Reward
- 2
- Comment
- Repost
- Share
The President has once again made comments about the crypto world: "I am a steadfast supporter of cryptocurrencies, holding more than anyone else." "My confidence in cryptocurrencies is very clear — if we don't do it, China will take the lead." What kind of coins does Trump have?????
TRUMP3,99%
- Reward
- like
- Comment
- Repost
- Share
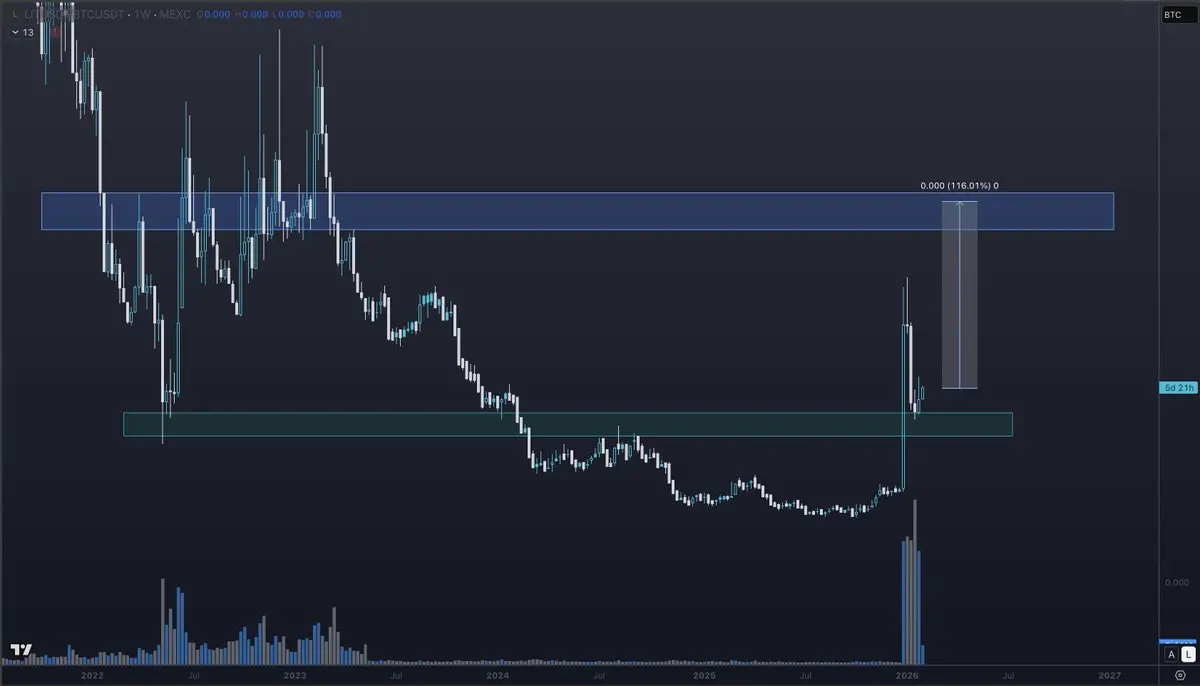
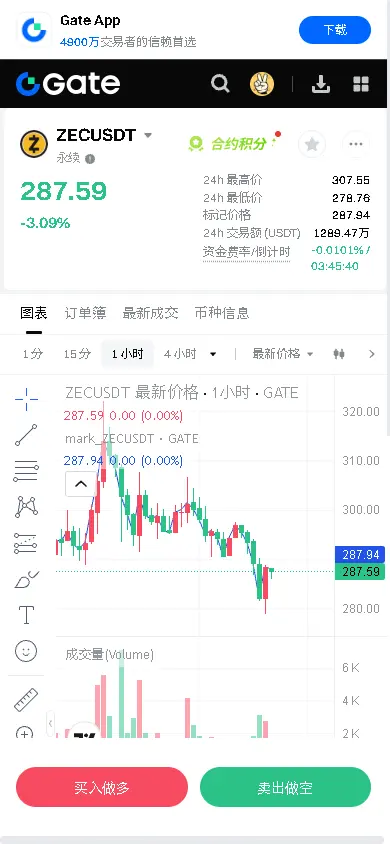
【$ZEC Signal】Empty position, wait for the downtrend momentum to be exhausted and confirmed
$ZEC is experiencing a volume-driven decline, with price action indicating sustained selling pressure.
🎯 Direction: Empty position
The chart shows the price falling with high trading volume. Market logic suggests that the decision should be based on open interest to determine whether it’s a short squeeze or main force distribution. Currently, there is no clear bottom absorption pattern; wait for signals of selling pressure weakening and buying support emerging. Small losses, big gains—profit is based
View Original$ZEC is experiencing a volume-driven decline, with price action indicating sustained selling pressure.
🎯 Direction: Empty position
The chart shows the price falling with high trading volume. Market logic suggests that the decision should be based on open interest to determine whether it’s a short squeeze or main force distribution. Currently, there is no clear bottom absorption pattern; wait for signals of selling pressure weakening and buying support emerging. Small losses, big gains—profit is based
- Reward
- like
- Comment
- Repost
- Share
BTC ETH XRP Markets Analysis
1
- Reward
- like
- Comment
- Repost
- Share
Load More
Join 40M users in our growing community
⚡️ Join 40M users in the crypto craze discussion
💬 Engage with your favorite top creators
👍 See what interests you
Trending Topics
View More4.2K Popularity
3.32K Popularity
5.69K Popularity
167 Popularity
484 Popularity
News
View MoreBULLA (Bulla) increased by 49.80% in the past 24 hours
1 m
Polymarket launches predictions related to the Chinese New Year Gala, covering whether Li Guyi will perform on stage and brands featuring robot participation
5 m
ANTFUN team project wins first place in the ICM category at the Solana Vibe Coding Hackathon Development Competition
12 m
$2.0 Billion in Token Unlocks Scheduled for February
13 m
Bitcoin spot ETF had a total net inflow of $562 million yesterday, turning from four consecutive days of net outflows to net inflows.
22 m
Pin