Trade
Basic
Futures
Futures
Hundreds of contracts settled in USDT or BTC
TradFi
Gold
Trade global traditional assets with USDT in one place
Options
Hot
Trade European-style vanilla options
Unified Account
Maximize your capital efficiency
Demo Trading
Futures Kickoff
Get prepared for your futures trading
Futures Events
Participate in events to win generous rewards
Demo Trading
Use virtual funds to experience risk-free trading
Earn
Launch
CandyDrop
Collect candies to earn airdrops
Launchpool
Quick staking, earn potential new tokens
HODLer Airdrop
Hold GT and get massive airdrops for free
Launchpad
Be early to the next big token project
Alpha Points
Trade on-chain assets and enjoy airdrop rewards!
Futures Points
Earn futures points and claim airdrop rewards
Investment
Simple Earn
Earn interests with idle tokens
Auto-Invest
Auto-invest on a regular basis
Dual Investment
Buy low and sell high to take profits from price fluctuations
Soft Staking
Earn rewards with flexible staking
Crypto Loan
0 Fees
Pledge one crypto to borrow another
Lending Center
One-stop lending hub
VIP Wealth Hub
Customized wealth management empowers your assets growth
Private Wealth Management
Customized asset management to grow your digital assets
Quant Fund
Top asset management team helps you profit without hassle
Staking
Stake cryptos to earn in PoS products
Smart Leverage
New
No forced liquidation before maturity, worry-free leveraged gains
GUSD Minting
Use USDT/USDC to mint GUSD for treasury-level yields
More
十一
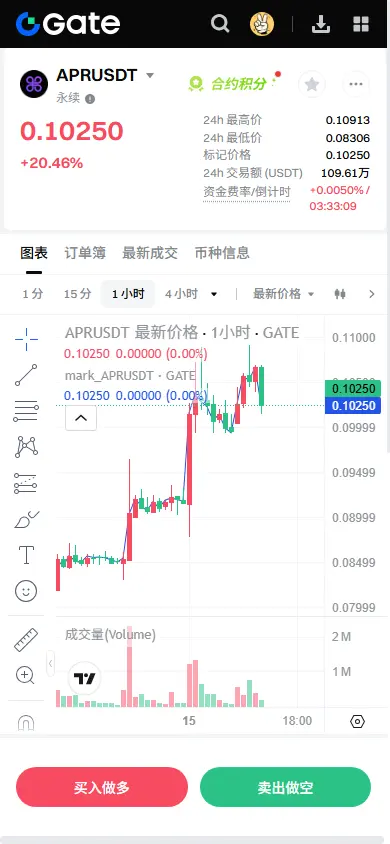
【$APR Signal】Pullback to Long + 1H Level Strong Support Confirmation
$APR After experiencing a massive rally, the 1H level is undergoing a healthy retracement and consolidation. The current price is initially supported above the 1H EMA20 (0.0993). The 4H level has confirmed a breakout of the long-term downtrend line, signaling a trend reversal. Open interest remains stable and has not dropped significantly with the price correction, indicating that bullish traders' confidence is still intact. The order book depth shows unusually thick buy orders in the 0.1023-0.1025 range, forming an invisib
View Original$APR After experiencing a massive rally, the 1H level is undergoing a healthy retracement and consolidation. The current price is initially supported above the 1H EMA20 (0.0993). The 4H level has confirmed a breakout of the long-term downtrend line, signaling a trend reversal. Open interest remains stable and has not dropped significantly with the price correction, indicating that bullish traders' confidence is still intact. The order book depth shows unusually thick buy orders in the 0.1023-0.1025 range, forming an invisib
- Reward
- 1
- Comment
- Repost
- Share
USDC minted 250M new tokens, signaling rising stablecoin demand
417
- Reward
- 2
- 4
- Repost
- Share
LittleQueen :
:
To The Moon 🌕View More
🧧 Gate Spring Festival Alert — Red Envelope Rain Incoming!
The celebration continues on Gate.io as the 2026 Spring Festival Red Envelope Rain – Day 5 is about to begin! 🎉
This is your chance to grab GT rewards and share the festive luck.
⏰ Today’s Red Envelope Rain Schedule (UTC+8)
🎁 12:00 – 15:00
🎁 16:00 – 19:00
Limited supply — fastest hands win!
🎯 How to Claim Your GT Red Envelopes
🔑 Visit the event page before the rain starts
🎁 Tap the red envelope pop-up
💰 Enter the red envelope page & claim your GT rewar
🧧 Celebrate Spring Festival with Good Luck & Rewards
✔ First come, first se
GT2,66%

- Reward
- 2
- 1
- Repost
- Share
dragon_fly2:
LFG 🔥加油鸭
加油鸭
Created By@ChainStrategyStudyGroup-
Listing Progress
0.00%
MC:
$0.1
More Tokens

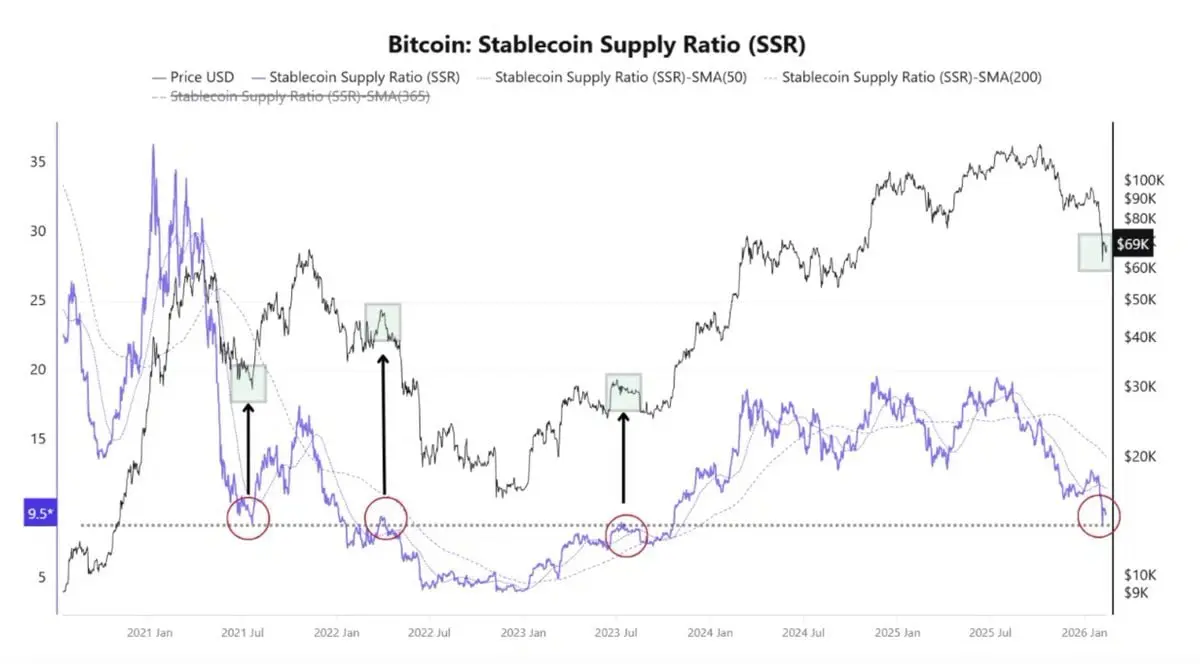
▶️ #BITCOIN $NEAR KEY PIVOT ZONE
Bitcoin’s Stablecoin Supply Ratio is now in an “equilibrium band” hovering around 9.6. This level has historically marked #major liquidity turning points. Direction from here could define the next liquidity-driven #move per CryptoQuant. #CryptoRecovery
$BTC
Bitcoin’s Stablecoin Supply Ratio is now in an “equilibrium band” hovering around 9.6. This level has historically marked #major liquidity turning points. Direction from here could define the next liquidity-driven #move per CryptoQuant. #CryptoRecovery
$BTC
BTC1,94%
- Reward
- 1
- Comment
- Repost
- Share
Participate in horse racing betting, complete tasks to earn horse racing tickets, and enjoy a million red envelope rain daily, sharing a prize pool of 100,000 USDT at the Gate 2026 Spring Festival Celebration. https://www.gate.com/competition/year-of-horse-2026?ref_type=165&utm_cmp=7EQB9Jba&ref=VVRMBFLDBG
View Original
- Reward
- 1
- Comment
- Repost
- Share
🐎 #GateSpringFestivalHorseRacingEvent
The Lunar New Year celebrations just got more exciting as Gate.io brings the Spring Festival Horse Racing Event to life — blending festive tradition, competition, and blockchain gaming into one global celebration.
🎉 Celebrate the New Year in a New Way
This Year of the Horse themed event transforms Gate Plaza into a digital racing arena where users worldwide can join virtually and compete in a festive Web3 experience.
🐎 How the Horse Racing Event Works
✔ Enter and customize your digital horse
✔ Strategize and compete in exciting races
✔ Track live stats


- Reward
- 3
- 2
- Repost
- Share
SheenCrypto:
LFG 🔥View More
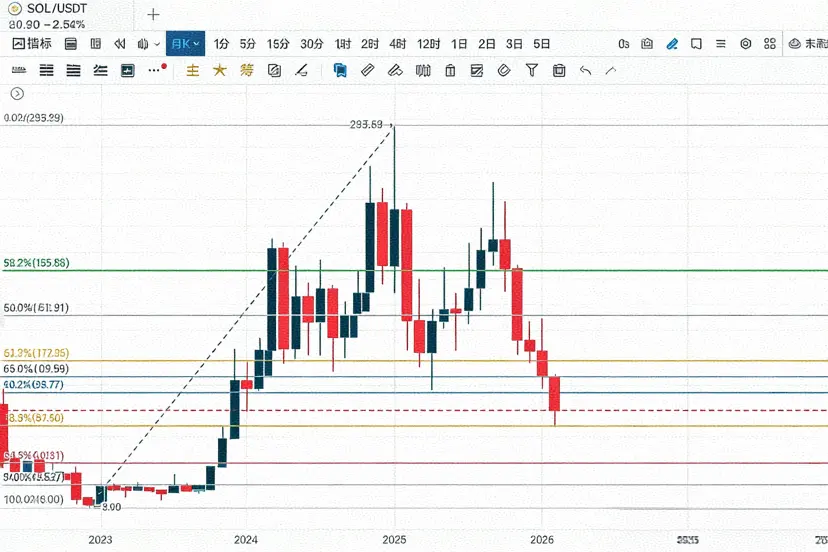
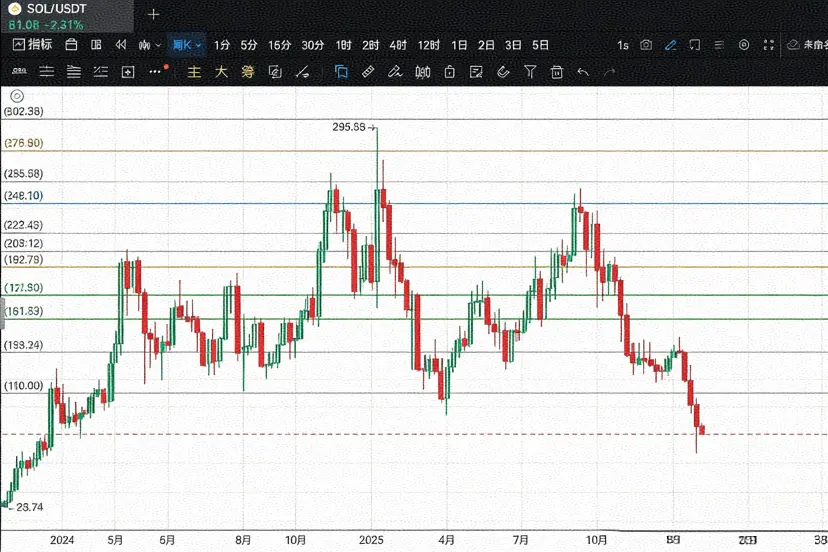
By looking at $SOL star line, we can identify key short-term levels and future bear market bottom order points.
First, look at Chart 1 (Peak Volume Structure)
101.72 — this seasonal peak volume has already been broken, and now it has become a resistance.
The previous turning point at 95.26 is similar — after breaking it, it becomes a suppression level.
This wave's lowest point reached 68.2, which coincides with the monthly peak volume breakout line.
At this level, cutting losses is not very cost-effective; it’s more like an important turning zone.
But if the market continues to plunge into a
SOL4,86%
- Reward
- 3
- 1
- Repost
- Share
FatYa888:
Wishing you great wealth in the Year of the Horse 🐴Check out Gate and join me in the hottest event! https://www.gate.com/campaigns/4067?ref=UFJNV19Z&ref_type=132

- Reward
- 1
- Comment
- Repost
- Share
Participate in horse racing betting, complete tasks to earn horse racing tickets, and enjoy a million red envelope rain daily, sharing a prize pool of 100,000 USDT at the Gate 2026 Spring Festival Celebration. https://www.gate.com/competition/year-of-horse-2026?ref_type=165&utm_cmp=7EQB9Jba&ref=VQDGVL8LBQ
View Original
- Reward
- 1
- Comment
- Repost
- Share
Participate in horse racing betting, complete tasks to earn horse racing tickets, and enjoy a million red envelope rain daily, sharing a prize pool of 100,000 USDT at the Gate 2026 Spring Festival Celebration. https://www.gate.com/competition/year-of-horse-2026?ref_type=165&utm_cmp=7EQB9Jba&ref=VVUXUQoM
View Original
- Reward
- 1
- Comment
- Repost
- Share
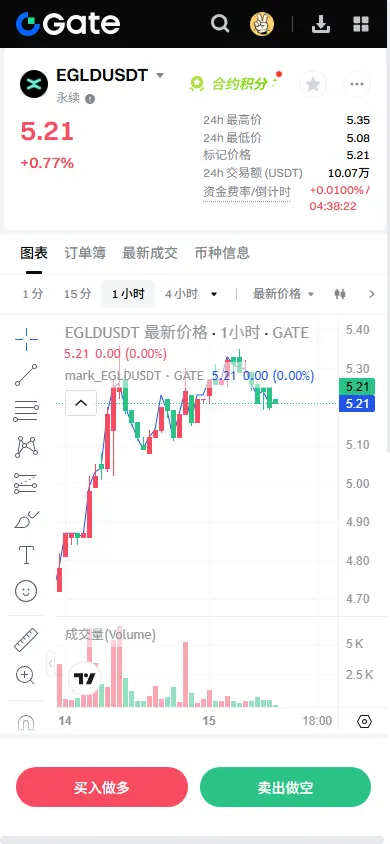
【$EGLD Signal】Long - 4H breakout pullback confirmation, 1H recharging and ready to go
$EGLD The 1H timeframe is oscillating narrowly above a key support level, with price tightly hugging the EMA20 (5.22). This is a typical breakout followed by a pullback confirmation pattern. The 4H candle has closed bullishly for several consecutive periods, breaking through the recent downward trendline, indicating an emerging bullish pattern. Currently, the price is hovering around 5.22, which is an excellent setup point for short-term entry.
🎯Direction: Long (Long)
🎯Entry/Order: 5.215 - 5.225 (Reason: 1H
View Original$EGLD The 1H timeframe is oscillating narrowly above a key support level, with price tightly hugging the EMA20 (5.22). This is a typical breakout followed by a pullback confirmation pattern. The 4H candle has closed bullishly for several consecutive periods, breaking through the recent downward trendline, indicating an emerging bullish pattern. Currently, the price is hovering around 5.22, which is an excellent setup point for short-term entry.
🎯Direction: Long (Long)
🎯Entry/Order: 5.215 - 5.225 (Reason: 1H
- Reward
- 2
- 1
- Repost
- Share
EagleEye:
thanks for sharing this informations💰
空气
Created By@FriedChickenWithChive
Subscription Progress
0.00%
MC:
$0
More Tokens
Today BTC and ETH
257
- Reward
- like
- Comment
- Repost
- Share
Participate in horse racing betting, complete tasks to earn horse racing tickets, and enjoy a million red envelope rain daily, sharing a prize pool of 100,000 USDT at the Gate 2026 Spring Festival Celebration. https://www.gate.com/competition/year-of-horse-2026?ref_type=165&utm_cmp=7EQB9Jba&ref=BFZGVl5e
View Original
- Reward
- 1
- Comment
- Repost
- Share
🇺🇸 The US is about to sell a weapons package to $20B for Taiwan
Trump is preparing a new weapons sale package to Taiwan with a scale potentially up to $20B. The final decision has not yet been made, but these rumors seem to be well-founded.
This package is considered an additional step to the $11B deal announced in December. The expected list includes:
- MIM-104 Patriot missile defense system
- NASAMS missile defense system
- Two other systems not yet publicly disclosed
If approved, this will be one of the largest weapons sales packages ever to Taiwan, and could significantly increase tens
View OriginalTrump is preparing a new weapons sale package to Taiwan with a scale potentially up to $20B. The final decision has not yet been made, but these rumors seem to be well-founded.
This package is considered an additional step to the $11B deal announced in December. The expected list includes:
- MIM-104 Patriot missile defense system
- NASAMS missile defense system
- Two other systems not yet publicly disclosed
If approved, this will be one of the largest weapons sales packages ever to Taiwan, and could significantly increase tens
- Reward
- like
- Comment
- Repost
- Share
【$SOL Signal】Long | 1H breakout and retest confirmation, main force clearly intends to support the market
$SOL The 1H timeframe is strongly consolidating above the EMA20 (87.45), just completed testing the previous high of 88.85. The 4H timeframe has stabilized above the EMA50 (86.38) and formed an upward relay structure. Price and open interest (OI) are moving in sync and stable, indicating that the main capital has not exited. Currently, the order book shows deep buy-side volume, with an imbalance rate of 3.63% leaning toward buyers. The 1H RSI (70.48) is high but not overbought, and momentu
View Original$SOL The 1H timeframe is strongly consolidating above the EMA20 (87.45), just completed testing the previous high of 88.85. The 4H timeframe has stabilized above the EMA50 (86.38) and formed an upward relay structure. Price and open interest (OI) are moving in sync and stable, indicating that the main capital has not exited. Currently, the order book shows deep buy-side volume, with an imbalance rate of 3.63% leaning toward buyers. The 1H RSI (70.48) is high but not overbought, and momentu

- Reward
- 1
- Comment
- Repost
- Share
#ApollotoBuy90MMORPHOin4Years 🚀
A major leap for DeFi!
Apollo Global Management, managing ~$900B in assets, will buy 90 million MORPHO tokens over 4 years. This partnership with the Morpho protocol shows strong institutional confidence in on-chain lending.
💹 MORPHO surged 10%+ to ~$1.25 after the announcement
📈 Apollo gains governance rights to influence development
🤝 Advised by Galaxy Digital UK Limited for a professional, structured approach
💰 Total purchase value: ~$112.5M (~17% of circulating supply)
This move is about long-term growth, not short-term hype. The integration of traditio
MORPHO15,42%

- Reward
- 3
- 2
- Repost
- Share
Peacefulheart:
To The Moon 🌕View More
Participate in horse racing betting, complete tasks to earn horse racing tickets, and enjoy a million red envelope rain daily, sharing a prize pool of 100,000 USDT at the Gate 2026 Spring Festival Celebration. https://www.gate.com/competition/year-of-horse-2026?ref_type=165&utm_cmp=7EQB9Jba&ref=VQBGVLKJCQ
View Original
- Reward
- like
- Comment
- Repost
- Share

- Reward
- 1
- 1
- Repost
- Share
BoringMantisShrimp:
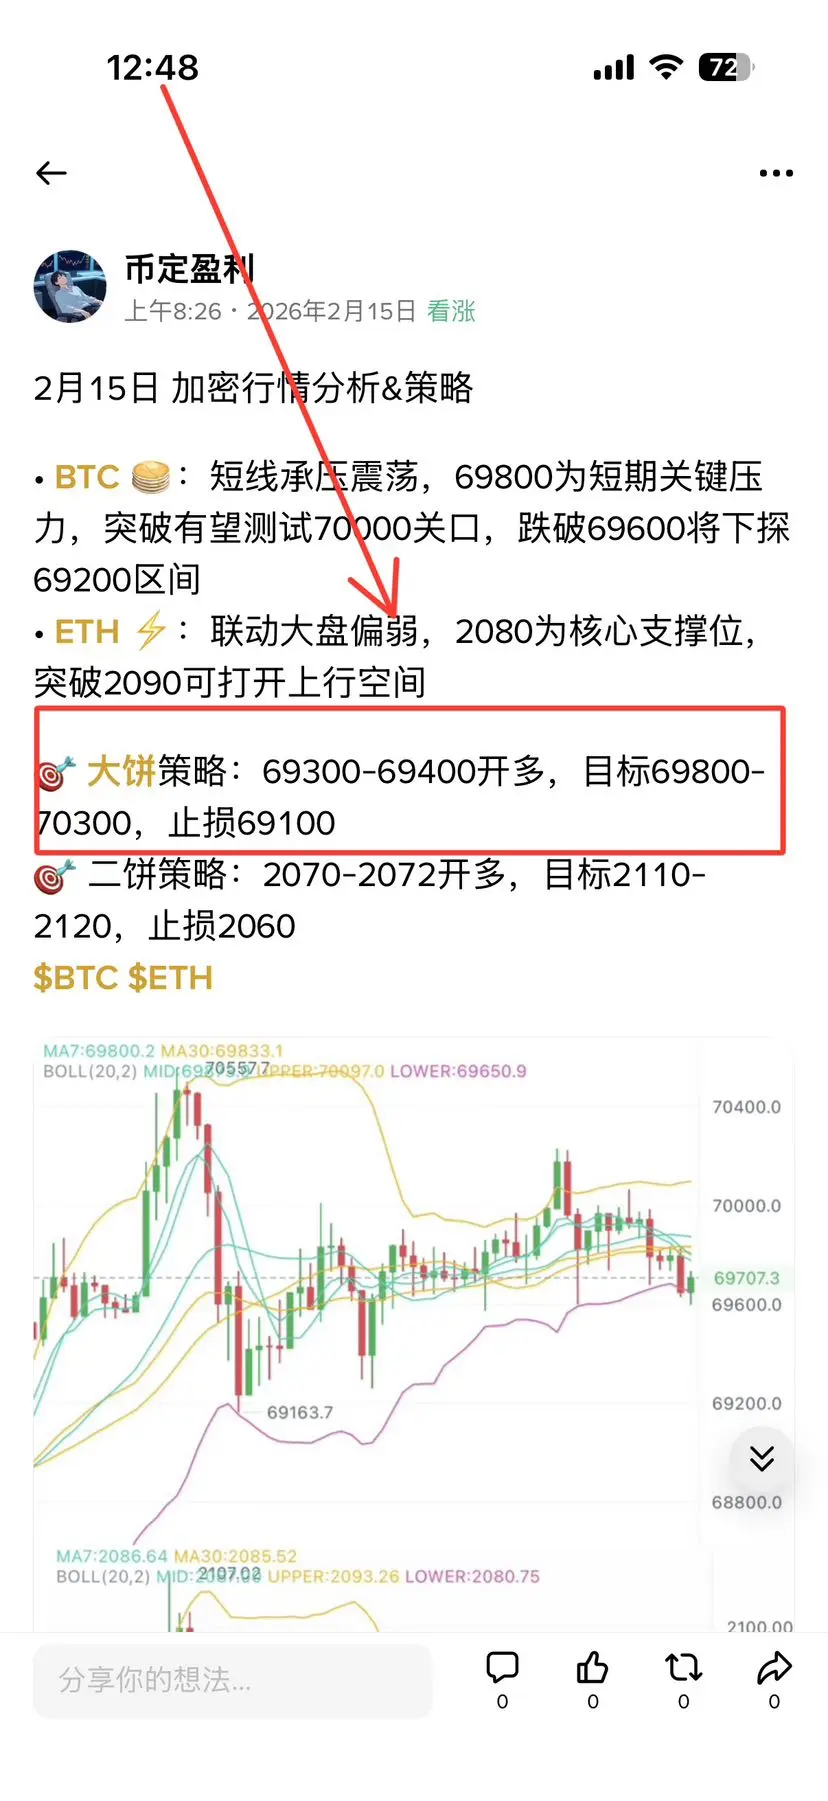
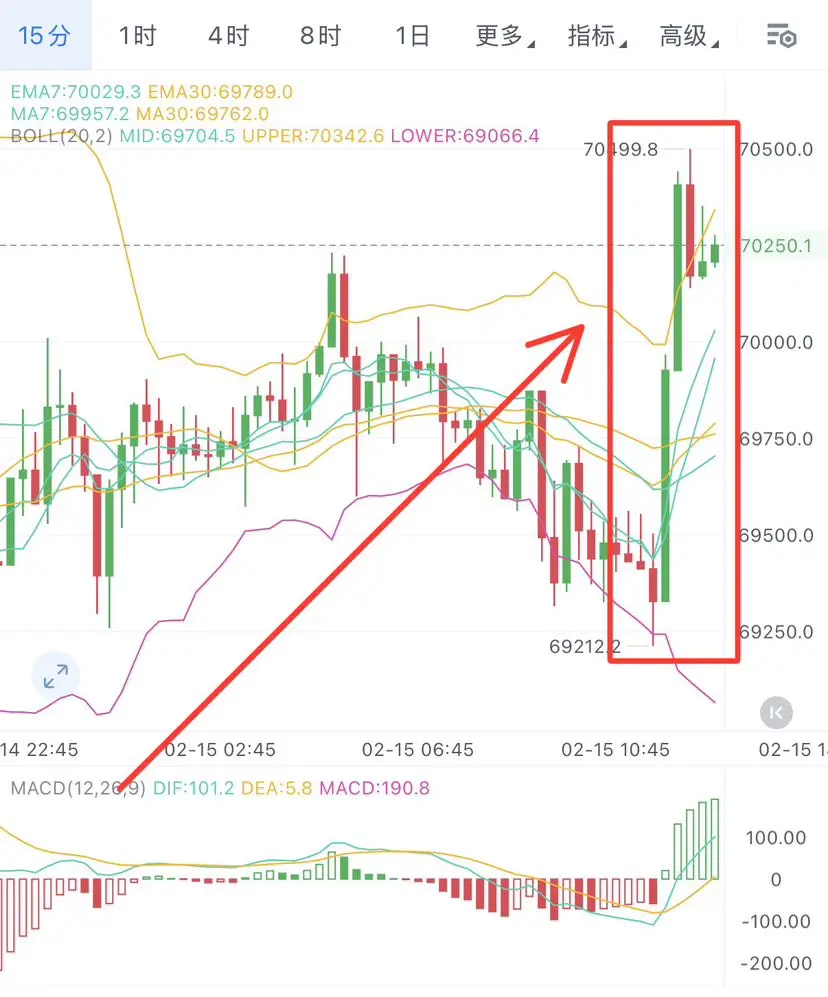
Elon Musk Exchange is opening soon✅ Today's Bitcoin long position strategy was perfectly executed!
The early morning call to open longs at 69300-69400 was spot on. After the market precisely retested the range, it surged directly, reaching a high of 70499.8, perfectly hitting our target zone of 69800-70300.
The strategy was precise, the market cooperated, and following it means profits. This is the power of professionalism!🚀
BTC1,94%
- Reward
- like
- Comment
- Repost
- Share
Load More
Join 40M users in our growing community
⚡️ Join 40M users in the crypto craze discussion
💬 Engage with your favorite top creators
👍 See what interests you
Trending Topics
View More95.4K Popularity
10.67K Popularity
10.25K Popularity
57.15K Popularity
5.8K Popularity
News
View MoreElon Musk: Tesla FSD will discontinue the one-time payment service and switch to a subscription model
1 m
Data: The current Crypto Fear & Greed Index is 9, indicating an extreme fear state.
40 m
If Bitcoin drops below $68,000, the total long liquidation strength on mainstream CEXs will reach $1.08 billion.
47 m
ETH 15-minute slight increase +0.06%: Macro positive factors and capital inflows resonate to boost the market
54 m
BTC 15-minute increase of 0.65%: Macro cooling and large investors adding positions jointly drive a short-term rebound
55 m
Pin