Trade
Basic
Futures
Futures
Hundreds of contracts settled in USDT or BTC
Options
HOT
Trade European-style vanilla options
Unified Account
Maximize your capital efficiency
Demo Trading
Futures Kickoff
Get prepared for your futures trading
Futures Events
Futures Mall
Participate in events to win generous rewards
Demo Trading
Use virtual funds to experience risk-free trading
Earn
Launch
CandyDrop
Collect candies to earn airdrops
Launchpool
Quick staking, earn potential new tokens
HODLer Airdrop
Hold GT and get massive airdrops for free
Launchpad
Be early to the next big token project
Alpha Points
NEW
Trade on-chain assets and enjoy airdrop rewards!
Futures Points
NEW
Earn futures points and claim airdrop rewards
Investment
Simple Earn
Earn interests with idle tokens
Auto-Invest
Auto-invest on a regular basis
Dual Investment
Buy low and sell high to take profits from price fluctuations
Soft Staking
Earn rewards with flexible staking
Crypto Loan
0 Fees
Pledge one crypto to borrow another
Lending Center
One-stop lending hub
VIP Wealth Hub
Customized wealth management empowers your assets growth
Private Wealth Management
Customized asset management to grow your digital assets
Quant Fund
Top asset management team helps you profit without hassle
Staking
Stake cryptos to earn in PoS products
Smart Leverage
NEW
No forced liquidation before maturity, worry-free leveraged gains
GUSD Minting
Use USDT/USDC to mint GUSD for treasury-level yields
More
# MarketStructure
3.57K
Mosfick
JUST IN: Bitcoin Challenges $90,000 Resistance as Geopolitical Risk Premium Evaporates.
The market has effectively erased the weekend's panic-driven sell-off. Bitcoin is currently testing the crucial $90,000 psychological level as the narrative shifts away from Greenland tariff fears back to underlying market structure.
This recovery is notable because it is being driven by spot demand, not leverage chasing. Funding rates remain neutral, suggesting a healthy rebuild of positions rather than a speculative frenzy.
Traders should watch the close today. A convincing hold above $90,000 validates th
BTC0,18%

- Reward
- 1
- 2
- Repost
- Share
Discovery :
:
2026 GOGOGO 👊View More
JUST IN: Bitcoin Defends $88,000 Support as Weekend Sell-Off Exhausts Liquidity.
The bleeding has finally stopped. After a relentless slide driven by geopolitical fears, Bitcoin found a hard floor at $87,950 during the Asian Monday open. The aggressive selling pressure that dominated the weekend has evaporated, leaving the market in a state of quiet accumulation.
This is a classic "absorption" phase.
Order book data shows that whales are not chasing price; they are simply parking massive limit buy orders below $88k and letting retail panic-sellers fill them. Funding rates have flipped back to
BTC0,18%
- Reward
- like
- Comment
- Repost
- Share
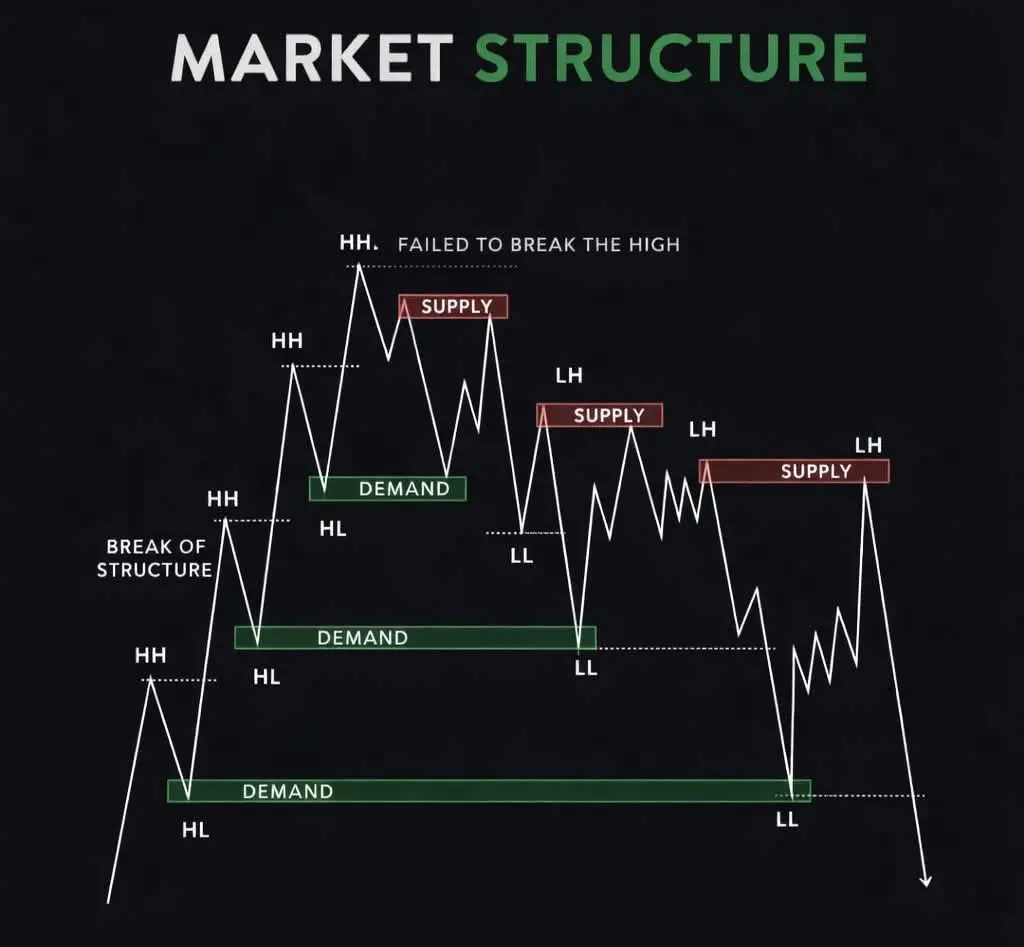
Step 1: Identify the trend
Higher Highs (HH) + Higher Lows (HL) → Uptrend
Lower Highs (LH) + Lower Lows (LL) → Downtrend
Trend is your directional bias, not an entry.
Step 2: Mark demand and supply
Demand forms after strong bullish moves (institutions buy here)
Supply forms after strong bearish moves (institutions sell here) These zones matter more than random support & resistance.
Step 3: Watch for Break of Structure (BOS)
When price breaks a previous HH or LL, it signals trend continuation or shift
No BOS = no confirmation
Step 4: Understand failed highs
When price fails to break the high, i
- Reward
- like
- Comment
- Repost
- Share
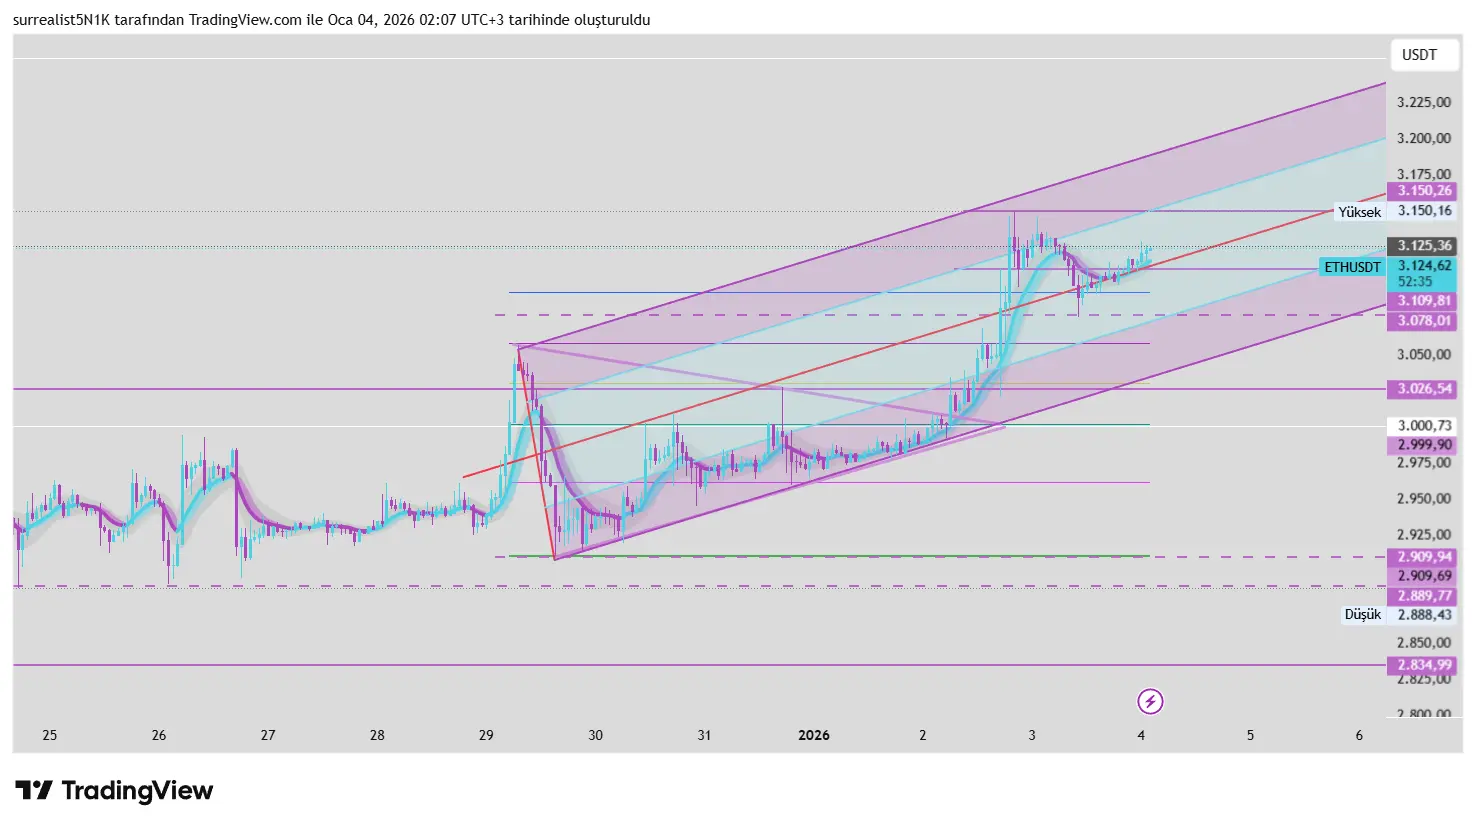
📊 ETHUSDT – Has the Structure Been Broken, or Is This a Healthy Correction?
ETH is maintaining its upward channel structure.
After the recent sharp increase, the price has pulled back to the middle band of the channel and the ascending trend line, consolidating.
📌 The technical setup is clear:
The upward channel is still active
3.10k–3.12k region is a short-term balance zone
Upper band: 3.15k – 3.20k
Lower band / trend support: 3.00k – 3.03k
🧠 What does this mean?
Such pullbacks are usually a pause within the trend.
As long as the price stays above support, the structure is not considered b
View OriginalETH is maintaining its upward channel structure.
After the recent sharp increase, the price has pulled back to the middle band of the channel and the ascending trend line, consolidating.
📌 The technical setup is clear:
The upward channel is still active
3.10k–3.12k region is a short-term balance zone
Upper band: 3.15k – 3.20k
Lower band / trend support: 3.00k – 3.03k
🧠 What does this mean?
Such pullbacks are usually a pause within the trend.
As long as the price stays above support, the structure is not considered b
- Reward
- 17
- 12
- Repost
- Share
Lock_433:
Just Go for it 💪View More
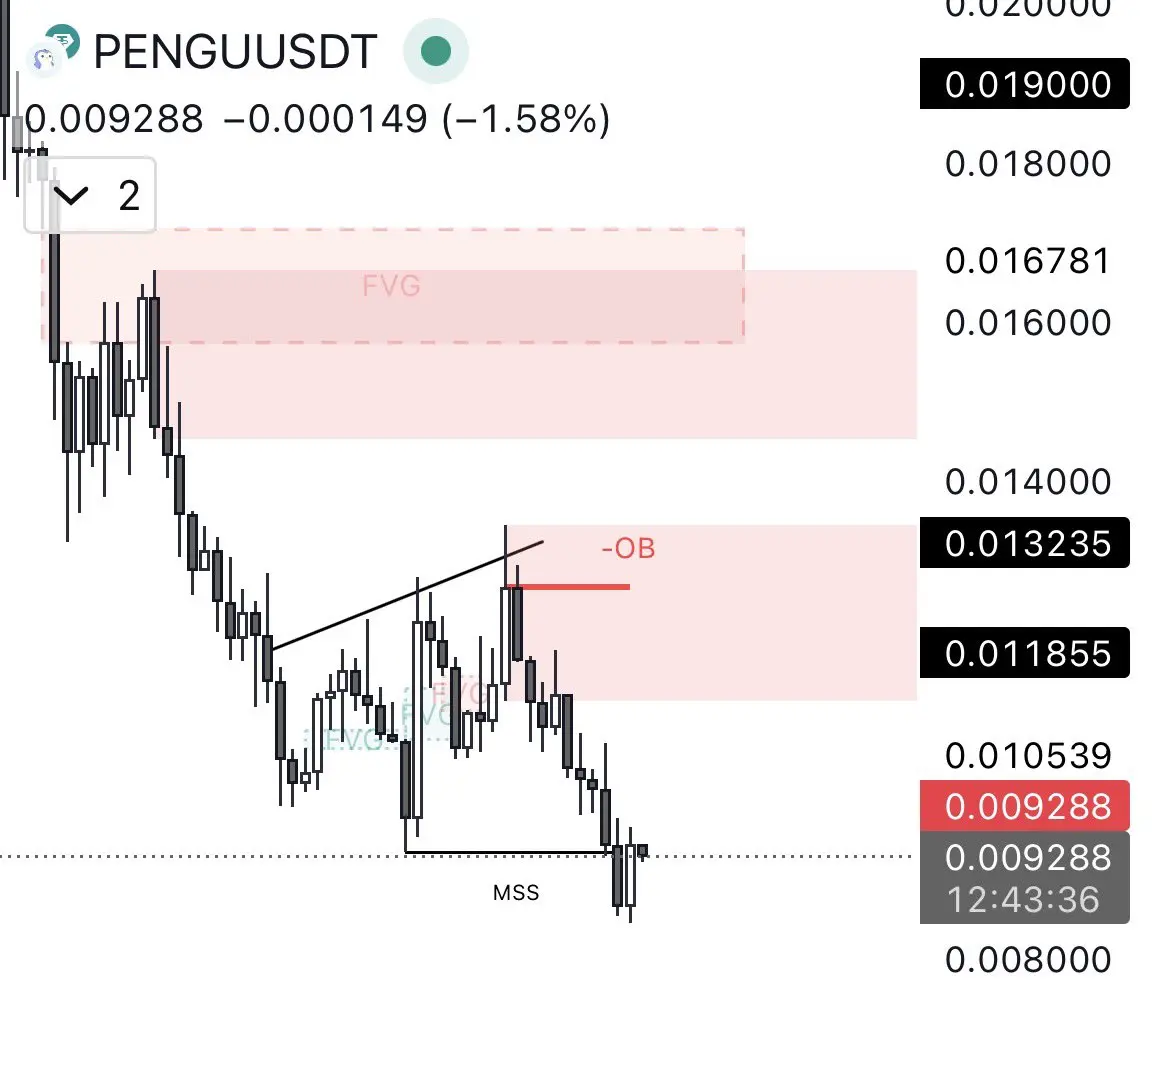
$PENGU is trading at a critical technical zone.
Price rejected cleanly from a major supply area and printed a clear market structure shift on the lower timeframe. This reaction suggests sellers are still defending the level with strength.
As long as price remains below this zone, continuation toward the downside remains the higher-probability scenario.
Bias flips only if supply fails and structure reclaims.
Patience > Prediction.
Let the level decide.
#Crypto #Altcoins #MarketStructure #PriceAction
PENGU-0,68%
- Reward
- like
- Comment
- Repost
- Share
#IstheMarketBottoming? 📉 A Forward-Looking Deep Dive into Current Market Dynamics
One of the most persistent questions investors are asking right now is whether the market is finally forming a durable bottom—or if recent strength is simply another temporary bounce within a broader corrective phase. History reminds us that true market bottoms are rarely obvious in real time. They are slow, emotionally exhausting processes that test conviction, patience, and discipline long before clarity appears.
Market bottoms are not single moments; they are phases of transition. Price stabilization often co
XRP-0,52%

- Reward
- 17
- 82
- Repost
- Share
Peacefulheart:
Happy New Year! 🤑View More
🧠 Smart Money Signal: ETH vs BTC Rotation Is Brewing
One of the most interesting signals in the market right now isn’t price — it’s positioning.
A well-known BTC OG whale has increased their ETH long exposure to ~$736M. This isn’t a random trade. It’s a rotation.
So what does this tell us?
🔁 From BTC Safety → ETH Opportunity
Historically, capital flows in stages:
1️⃣ BTC leads during fear and uncertainty
2️⃣ ETH outperforms when risk appetite returns
3️⃣ Altcoins follow once confidence spreads
When experienced capital rotates from BTC into ETH, it often signals:
BTC downside risk is stabiliz

- Reward
- 11
- 14
- Repost
- Share
MissCrypto:
Watching Closely 🔍️View More
#GateSquareCreatorNewYearIncentives 2026 Crypto Reality Check: From Speculation to Structure
The crypto market in 2026 feels very different from previous cycles.
Momentum is no longer driven by noise or hype alone — structure, liquidity, and execution are starting to matter again.
This phase rewards patience, positioning, and understanding where capital is actually moving — not where Twitter says it’s going.
🔍 Key Market Shifts I’m Tracking
Here are the three areas where smart capital seems to be concentrating early this year:
1️⃣ Core Infrastructure & Platform Networks
Projects with real usa

- Reward
- 10
- 15
- Repost
- Share
MrFlower_XingChen:
2026 GOGOGO 👊View More
#GateProofOfReservesReport 📊 Bitcoin Market Insight | Glassnode Perspective
Bitcoin is entering what Glassnode calls a low-volatility window — a phase where price action becomes quiet, ranges tighten, and emotions cool down.
Historically, these periods are not signs of weakness. They often represent market balance, where sellers step back and long-term holders stay firm. On-chain data shows declining realized volatility, stable holder supply, and no aggressive exchange inflows — all signs of compression, not distribution.
Bitcoin has a habit of storing energy during these calm phases. When vo
BTC0,18%

- Reward
- 8
- 8
- Repost
- Share
CryptoFire:
Buy To Earn 💎View More
#FedRateCutComing
Watching price charts alone only scratches the surface the real opportunity lies in structural changes.
The crypto market has been hot lately, but the rise and fall of prices is only part of the story. Smart money is now focusing on policy-level shifts, particularly the US regulatory framework, which is undergoing a significant overhaul. This could become a key catalyst for institutional inflows by 2026.
Three forces are converging:
1️⃣ The Trump administration is refining its regulatory approach. Ambiguity is giving way to clarity, which institutional investors highly valu
DEFI1,2%

- Reward
- 6
- 8
- Repost
- Share
ybaser:
2026 GOGOGO 👊View More
Load More
Join 40M users in our growing community
⚡️ Join 40M users in the crypto craze discussion
💬 Engage with your favorite top creators
👍 See what interests you
Trending Topics
51.56K Popularity
14.35K Popularity
10.48K Popularity
4.82K Popularity
4.3K Popularity
4.29K Popularity
3.65K Popularity
3.67K Popularity
69.65K Popularity
111.87K Popularity
77.94K Popularity
22.69K Popularity
45.42K Popularity
37.86K Popularity
194.02K Popularity
News
View MoreData: 511.57 BTC transferred from an anonymous address, and after routing, flowed into Cobo.com
7 m
Data: A total of 146,000 SOL transferred to anonymous addresses, worth approximately $182 million.
47 m
Data: If BTC breaks through $92,200, the total liquidation strength of mainstream CEX short positions will reach $1.523 billion.
1 h
Data: 24,646,700 TRX transferred from anonymous addresses, worth approximately $7,236,200.
1 h
Data: 36,400 SOL transferred from an anonymous address, worth approximately $4.5 million
1 h
Pin