CryptoWorldDirector
vip
Age 0.8 Yıl
Peak Tier 1
No content yet

December 5 Market Analysis: After Testing the Top, No Need to Fear Bottom Testing Next Week

This week's peak-testing task is coming to an end. The pattern here has completed, and needs to align with indicators as the retracement process begins next week. The consolidation range after this retracement will be the period when major players accumulate positions. Therefore, there’s no need to fear this decline; after another push upward, the daily BOLL will enter a narrow range platform. Once it enters, a new trend is expected to start, likely in early January.
BTC-2.07%
SOL-4.32%
ETH-1.65%
View Original
Expand All
  • Reward
  • Comment
  • Repost
  • Share
"Outlook for 2026 Market: The Final Rebound Triggers the Start of a Major Bear Market"
Today, I'm discussing the weekly chart outlook, hoping everyone can form an overall expectation for the market. On the weekly chart of $BTC , there is a converging pattern that needs to play out after 2026. This is the final rebound, forming the right shoulder pattern on the weekly level. Once completed, the market will enter a sideways phase after a drop, and then a sharp decline will begin, marking the arrival of a major bear market. The expected timeframe for this downturn to start is between Q1 and Q2. S
BTC-2.07%
View Original
post-image
  • Reward
  • Comment
  • Repost
  • Share
"Market Analysis on 12.2: Two Tests Completed, Discussion on Rebound Height This Week"
Yesterday's market successfully rebounded from the bottom at 84,000-83,000, as discussed last week. The trend here can basically confirm that the second test is complete, and this week we will begin the rebound rhythm. As for the height of the rebound, we need to discuss it one by one.
The rebound height of the big pie this week can first pay attention to the pressure levels on the 4-hour chart at 88500 and 89500. Firstly, 88500 is the position where the support and resistance levels interchange on the 4
BTC-2.07%
SOL-4.32%
ETH-1.65%
View Original
post-image
post-image
post-image
post-image
  • Reward
  • Comment
  • Repost
  • Share
"Market Analysis on December 1: Successfully Predicted the Second Dip, Where is the Bottom?"
First of all, congratulations to the fans of the section chief. Yesterday we reminded everyone that the opportunity to short has arrived. At 91900, we advised everyone to pay attention to the pin bar for opening shorts, and we directly saw 8.4-8.3w. This wave was directly opened short at the highest point, which I believe is a skill. This viewpoint has been mentioned many times.
The script we discussed repeatedly last week, fluctuated on Friday, consolidated on Saturday, and created a false breakout to
BTC-2.07%
SOL-4.32%
ETH-1.65%
View Original
post-image
post-image
post-image
post-image
  • Reward
  • 3
  • Repost
  • Share
潇白羊vip:
Awesome
View More
"Market Analysis on November 28: Completing Head Formation by Month-End, Weekend is the Time to Short"
Yesterday's fluctuations were small, with Bitcoin oscillating between 9.1 and 9.2 for the entire day. The remaining days of the month are likely to pass in this manner as well, with today seeing another day of ups and downs, Saturday being flat, and Sunday reaching the turning point. As mentioned yesterday, this second probe is necessary, so from a timing perspective, the weekend is a good time to short.
$BTC on the big pie, today's short-term pressure is at 91600. If it can hold her
BTC-2.07%
SOL-4.32%
ETH-1.65%
View Original
post-image
post-image
post-image
  • Reward
  • Comment
  • Repost
  • Share
"Market Analysis on November 27: Waiting for the Top to Emerge, Discussing the Trend of a Second Probe in December"
Last night, I reminded that after the hourly level convergence breakthrough of Bitcoin, it would go above 90800. It did come out in the evening, and in the morning, I added a short position at 91800. Fortunately, this short position is not trapped at the moment. Many people want to chase after the rise, but chasing here is likely to catch a top range, which is meaningless. To truly push the price up, the bottoming and accumulation actions must be completed here, so the market'
BTC-2.07%
SOL-4.32%
ETH-1.65%
View Original
post-image
post-image
post-image
post-image
  • Reward
  • Comment
  • Repost
  • Share
"Market Analysis on November 26: A Double Bottom Must Be Completed Before Testing the Top"
The market volatility in the past couple of days has been relatively small, making the overall market quite dull. On the daily chart, the price of the coin is still consolidating below the EMA15, and the overall trading volume has not replenished much, indicating that there is no direct upward movement here. Additionally, the CCI stabilizing below the zero line tells us that it is necessary to complete a second bottom test here. Only after establishing an effective bottom can the market proceed to test t
BTC-2.07%
SOL-4.32%
ETH-1.65%
View Original
post-image
post-image
post-image
post-image
  • Reward
  • Comment
  • Repost
  • Share
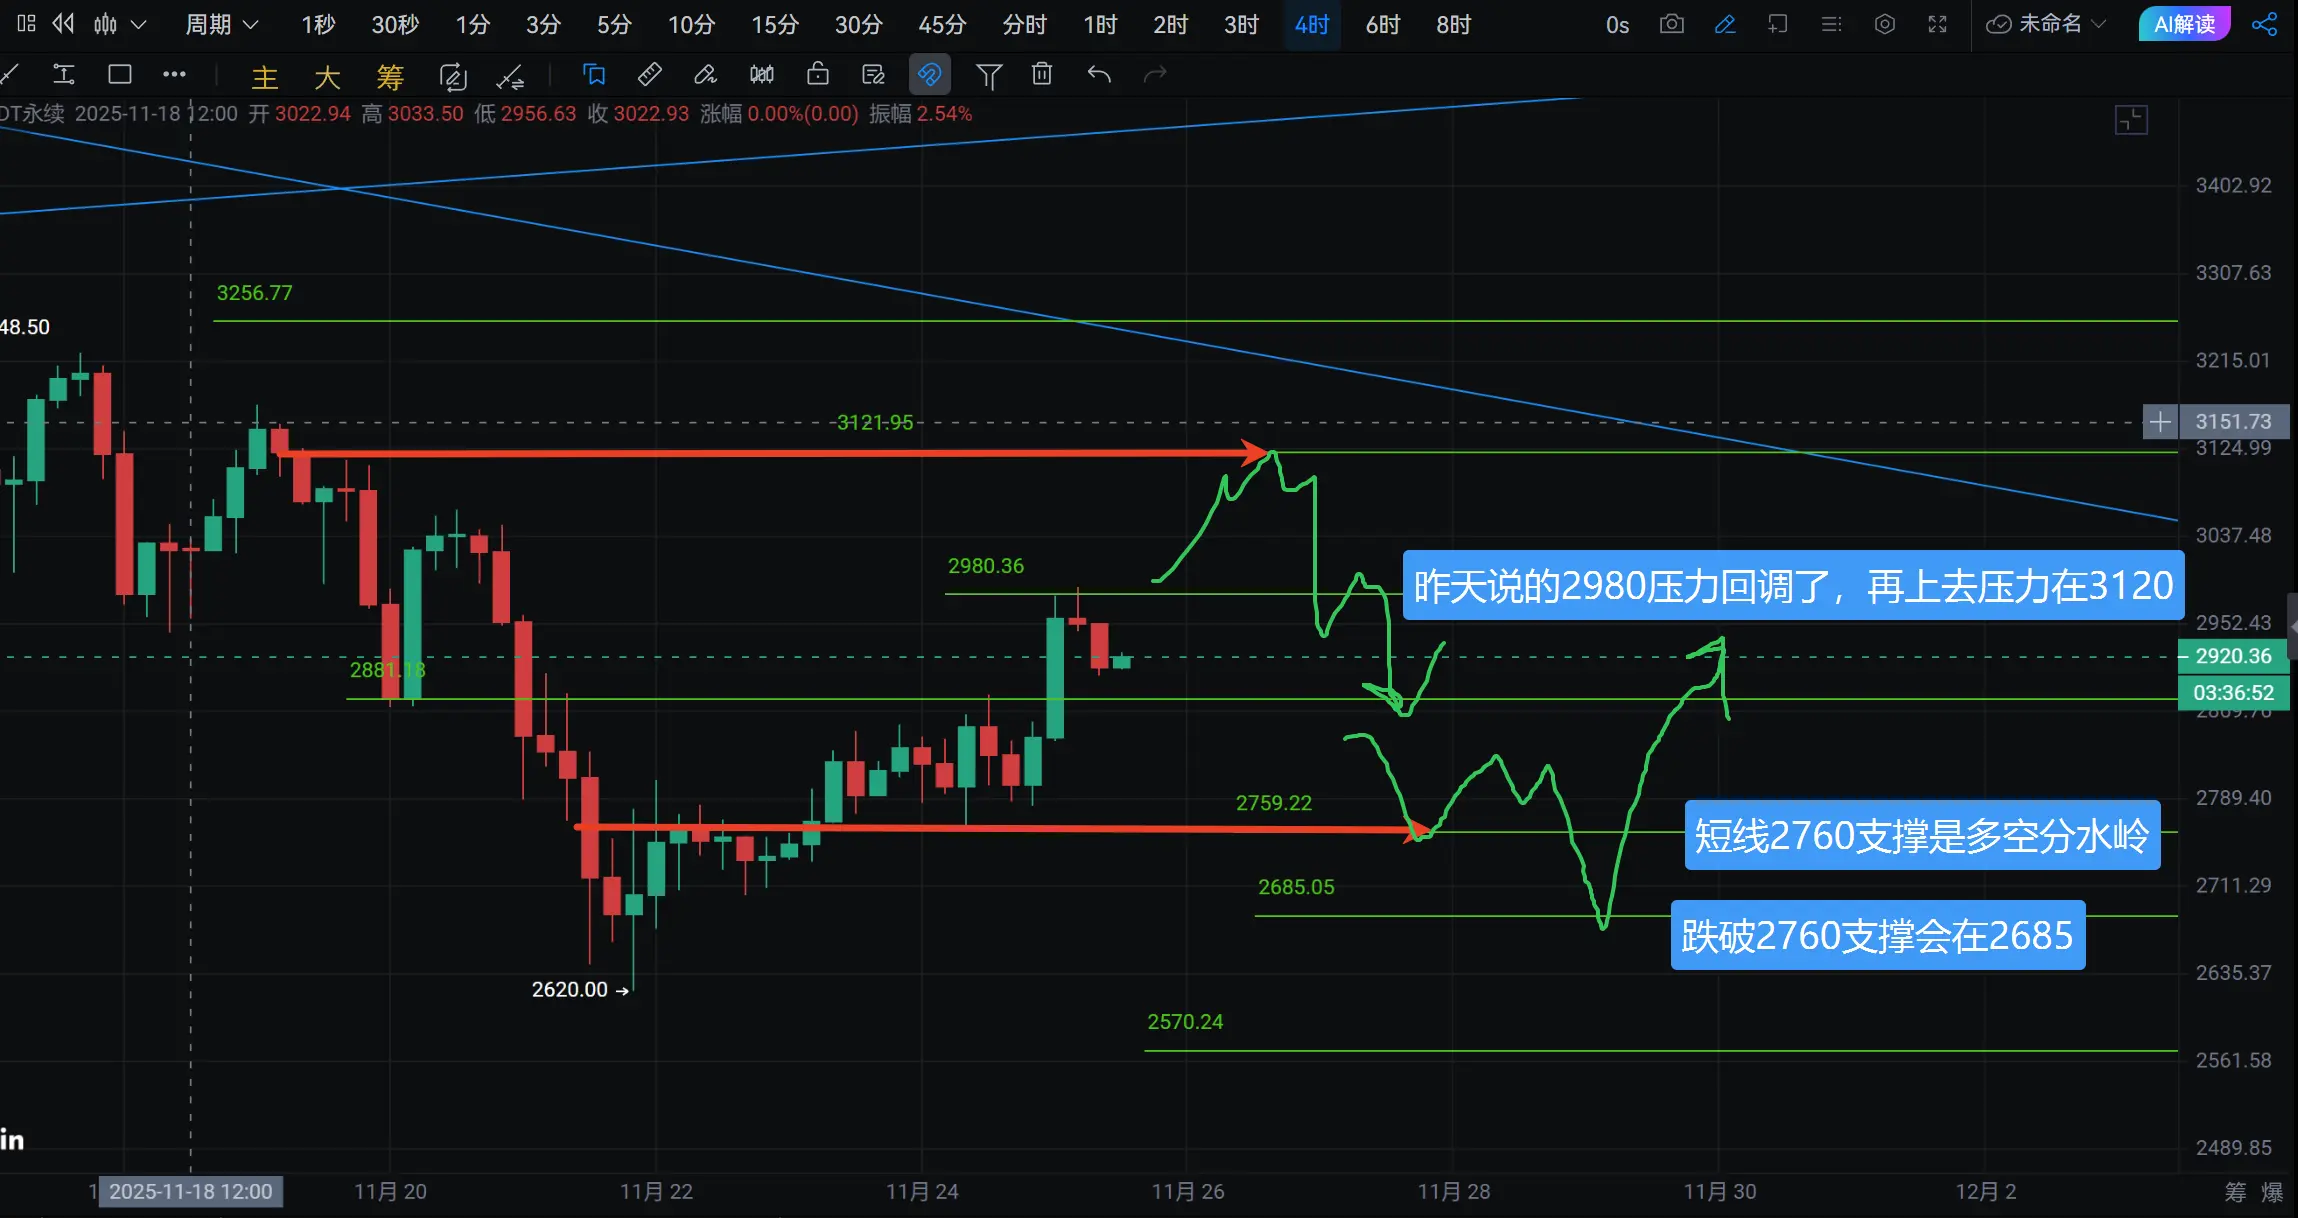
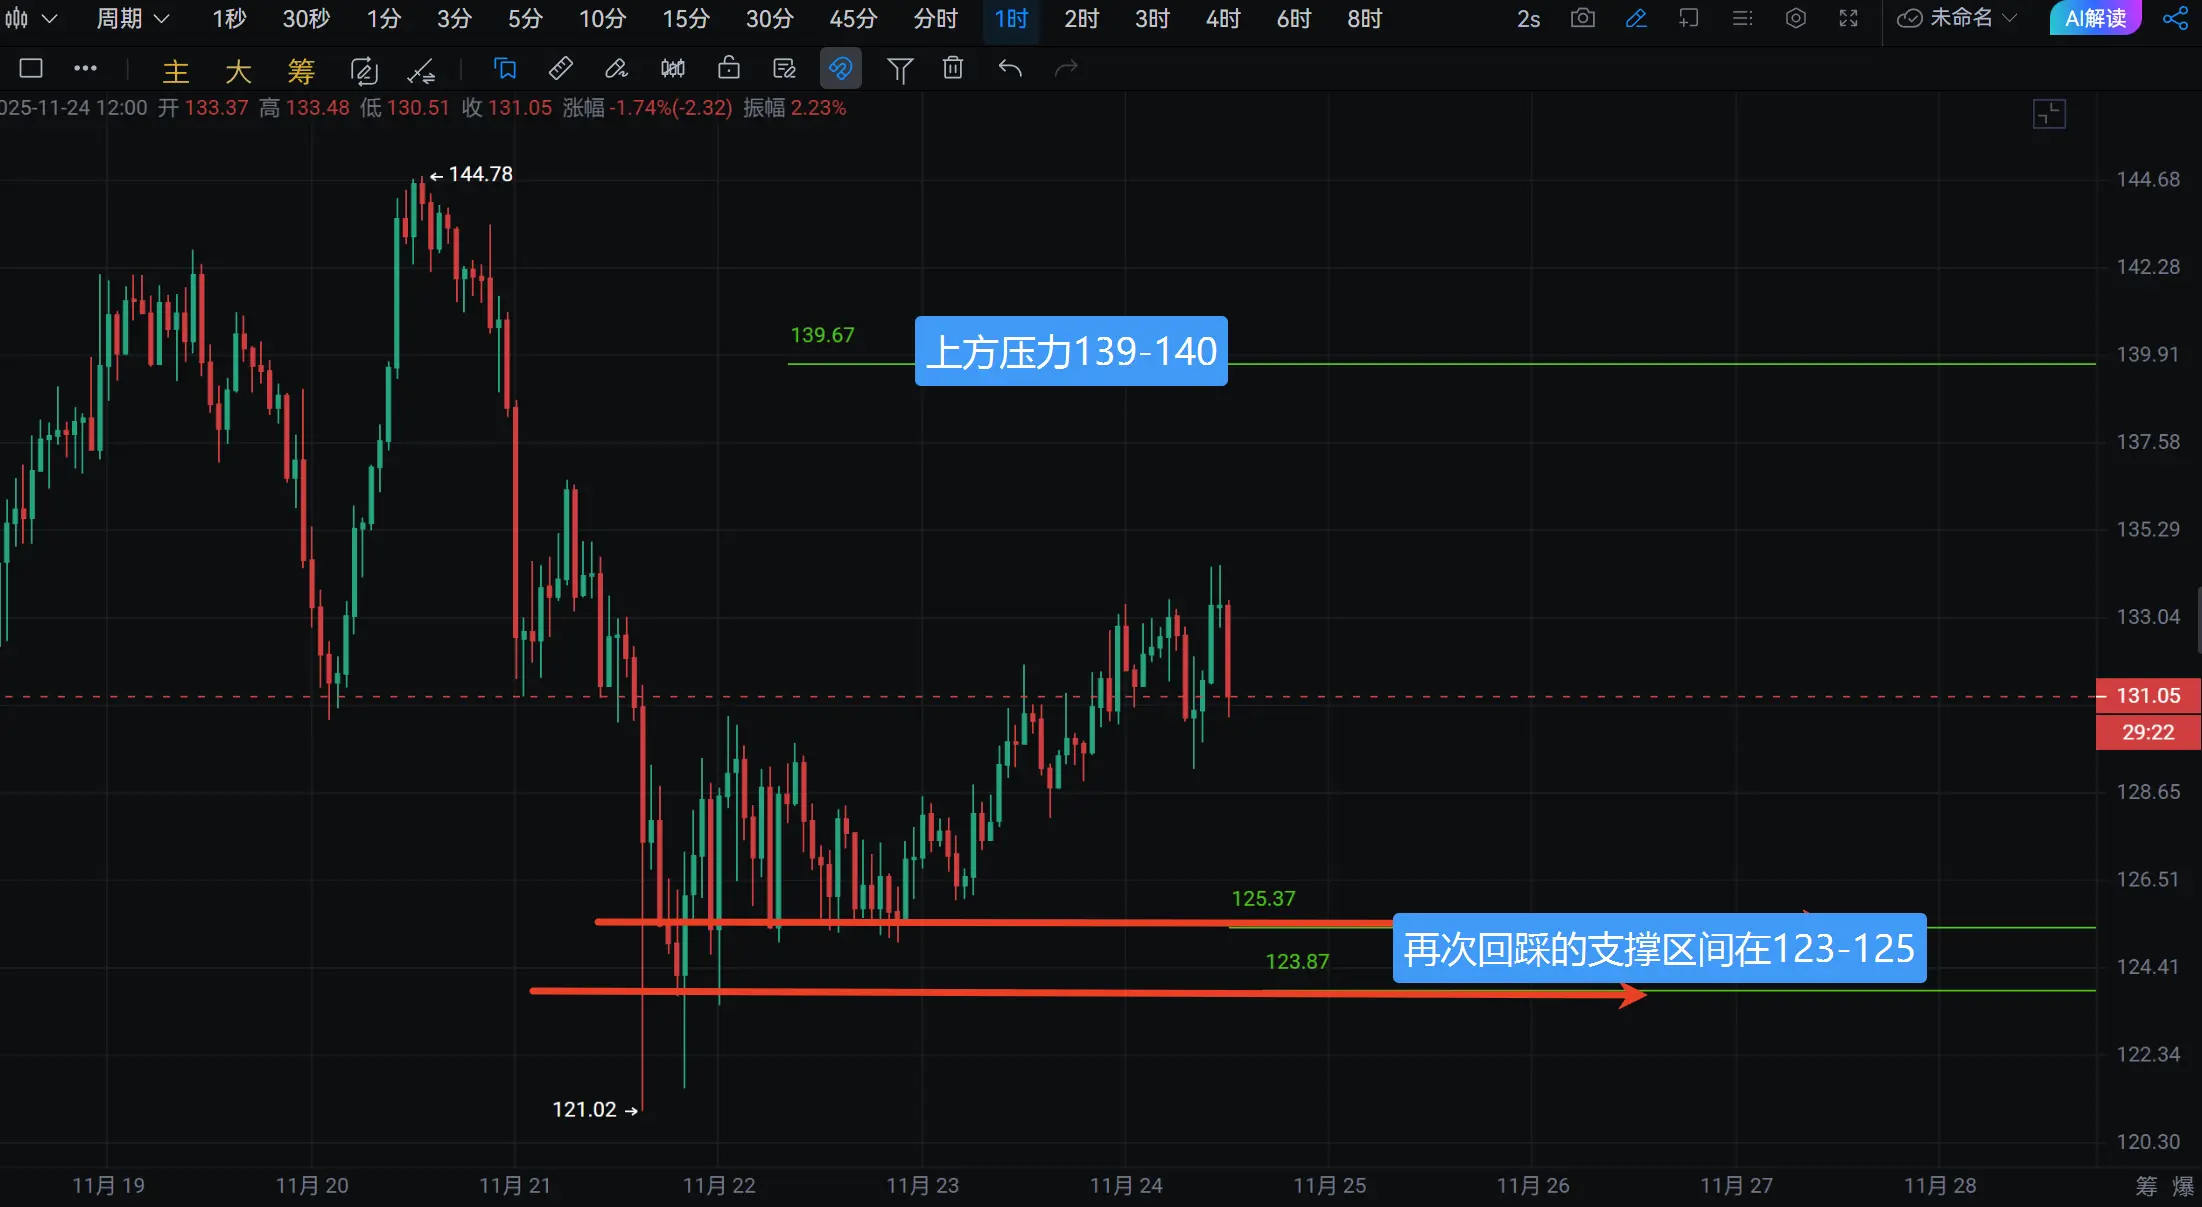
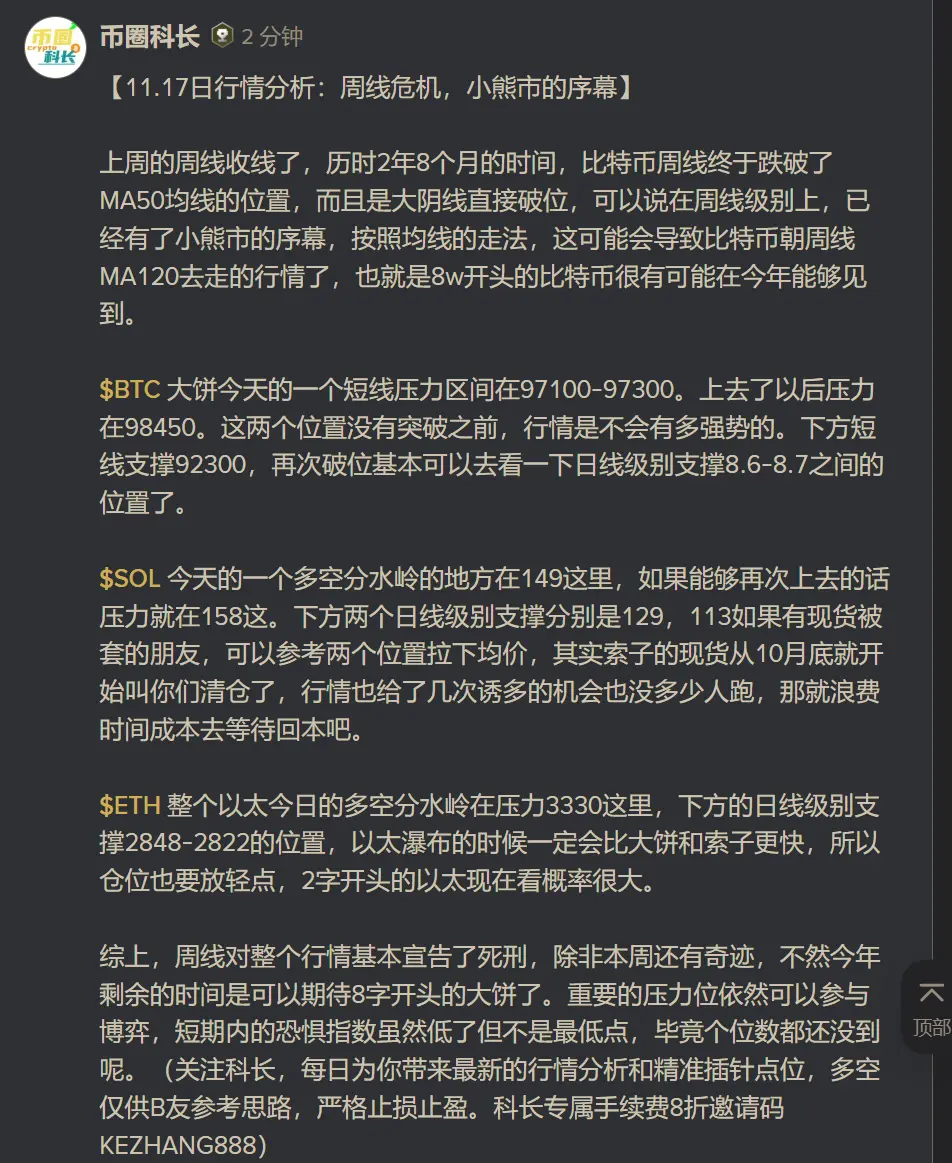
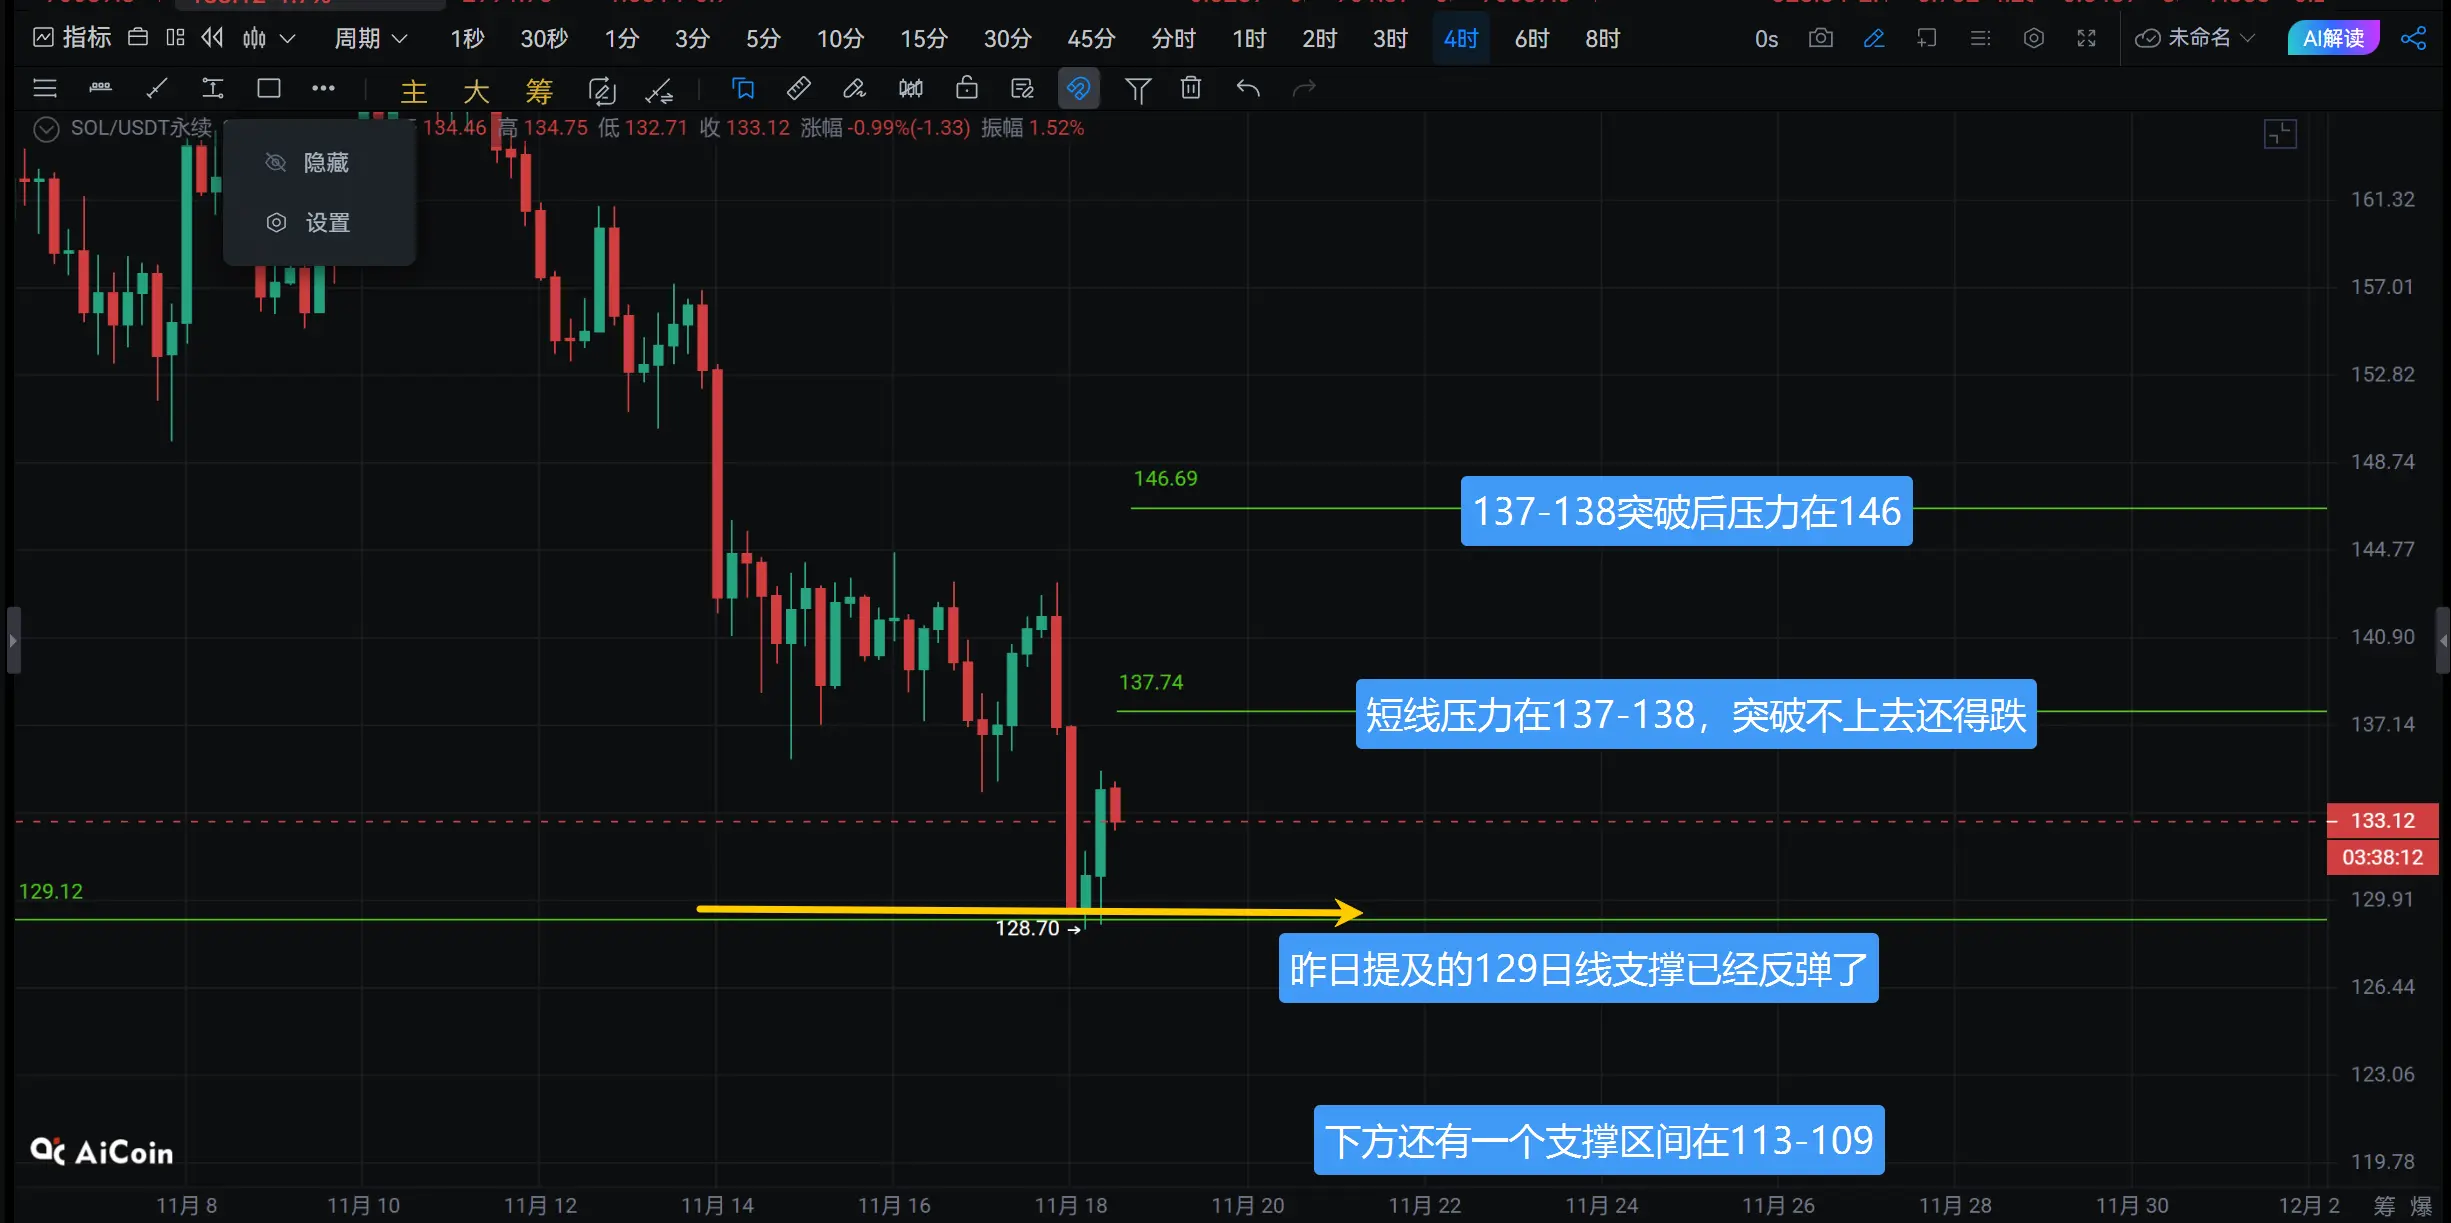
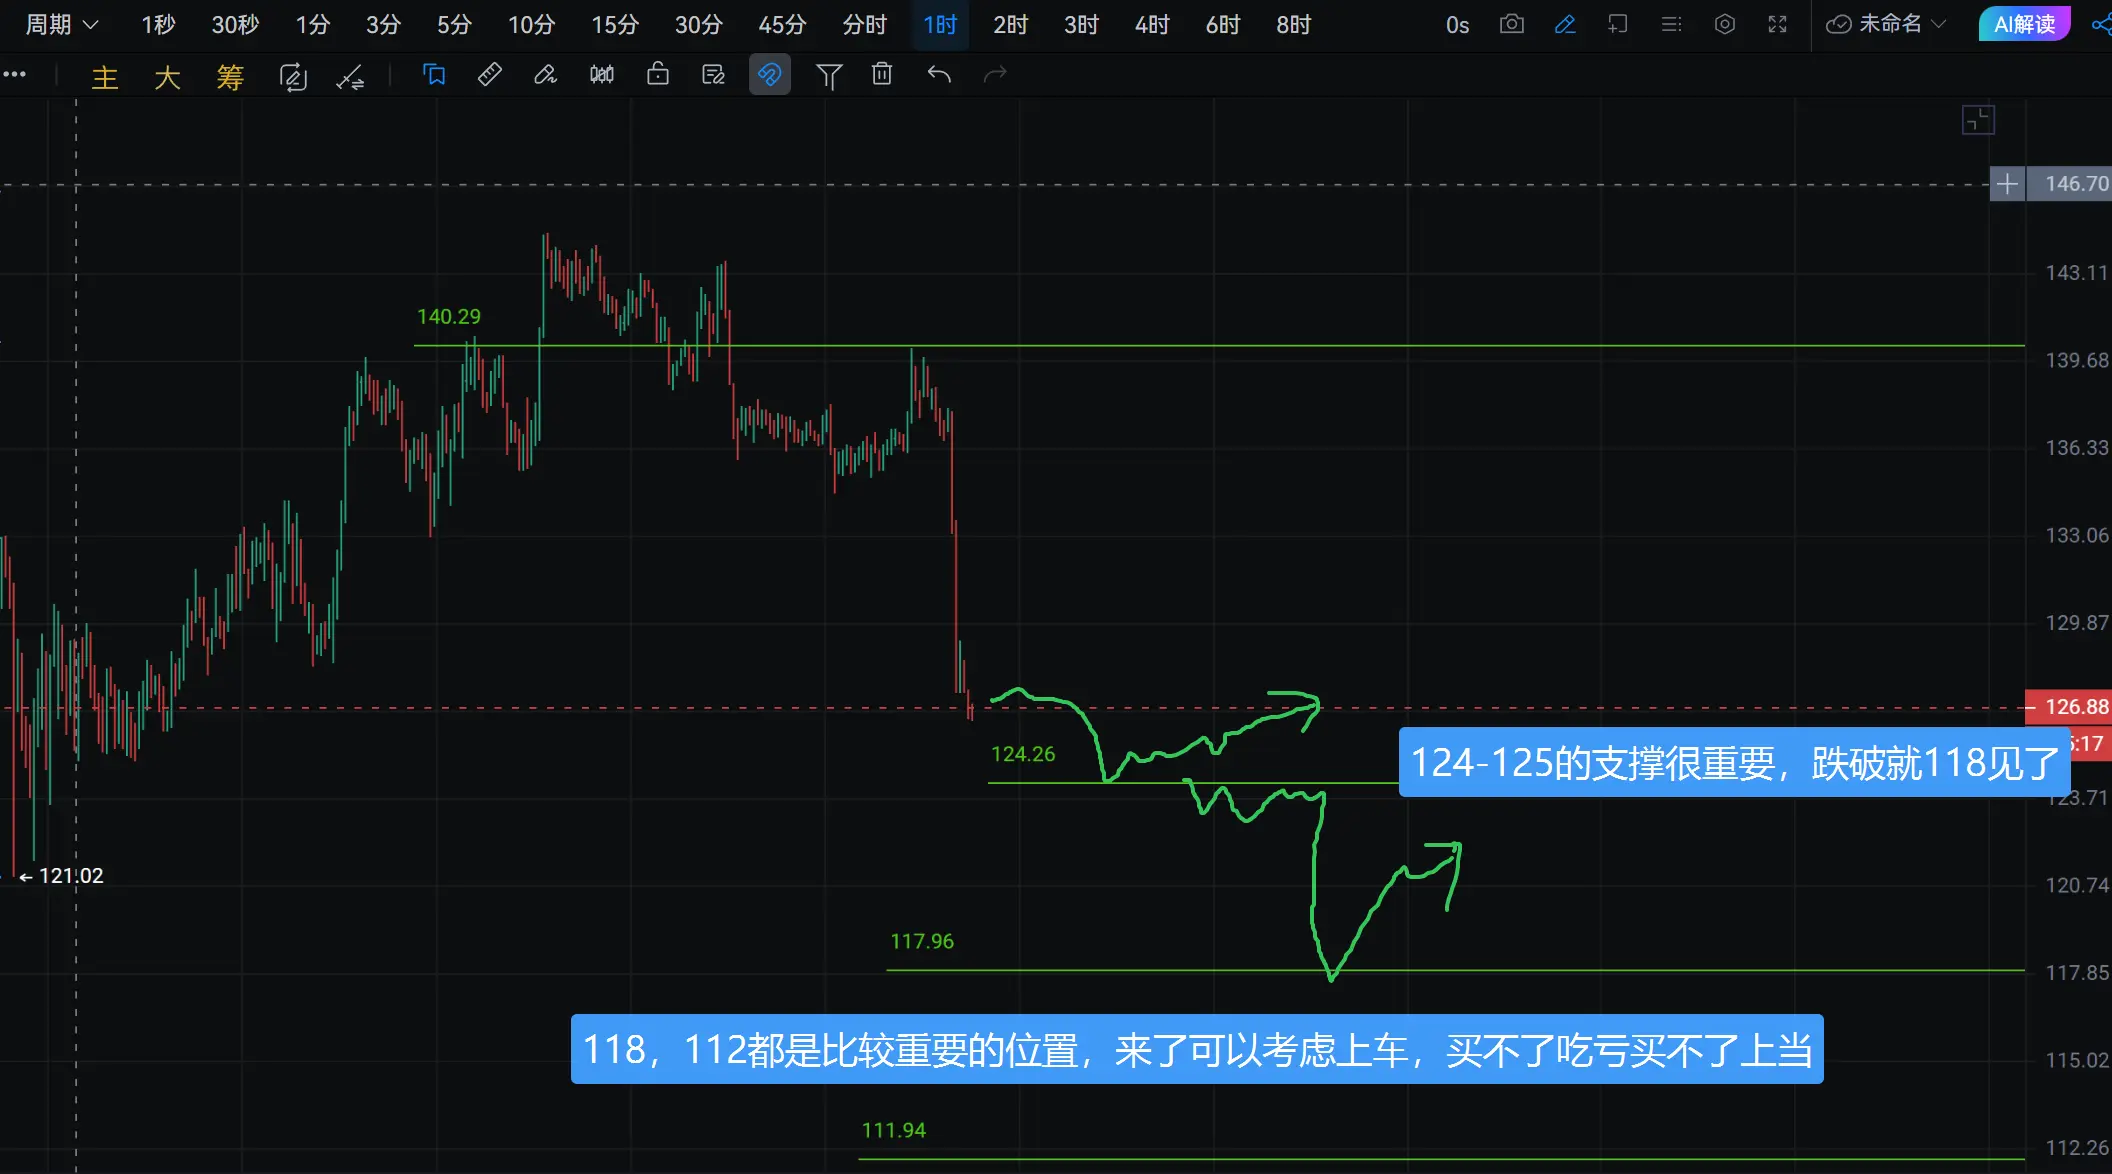
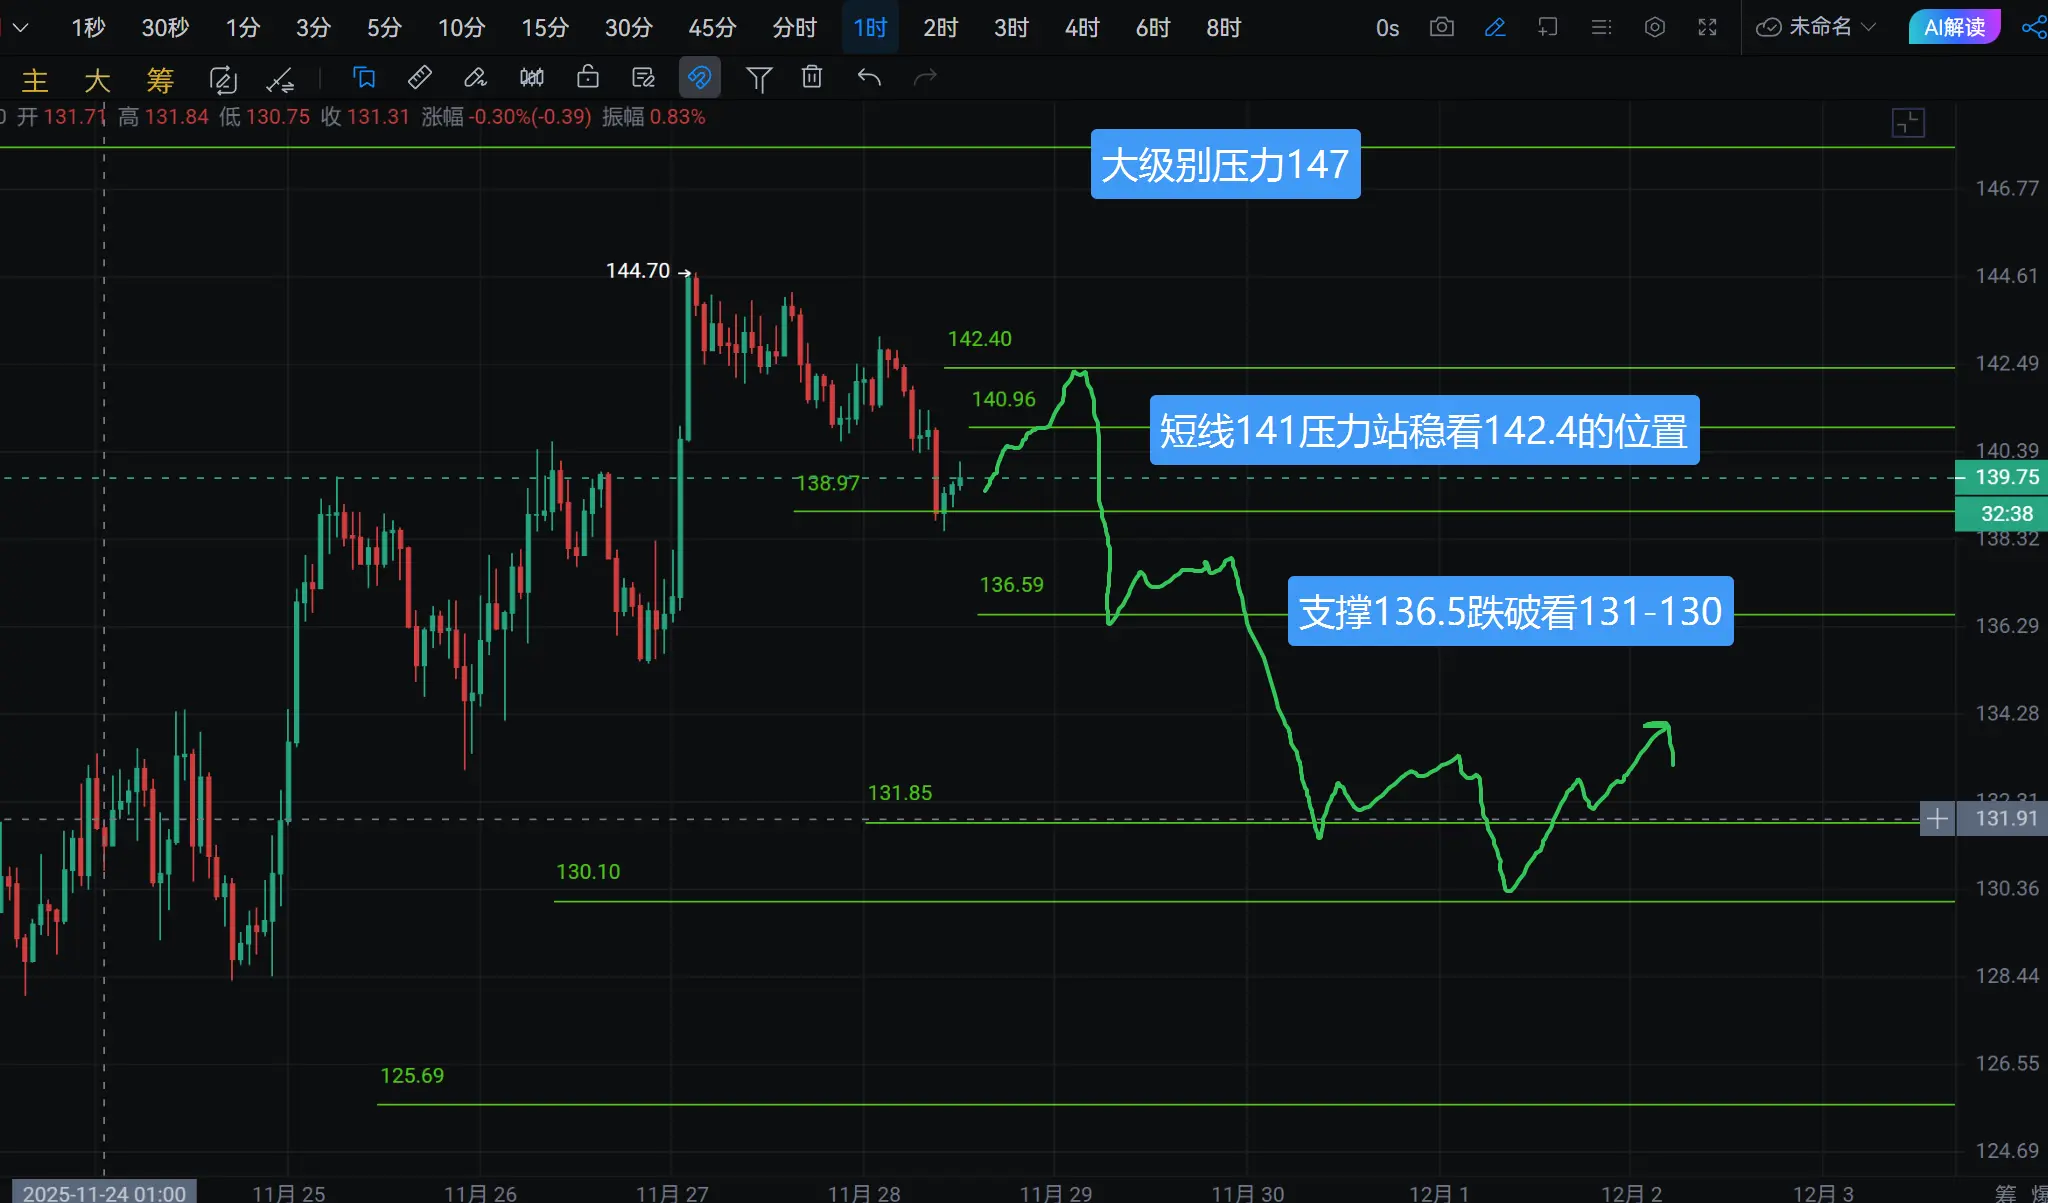
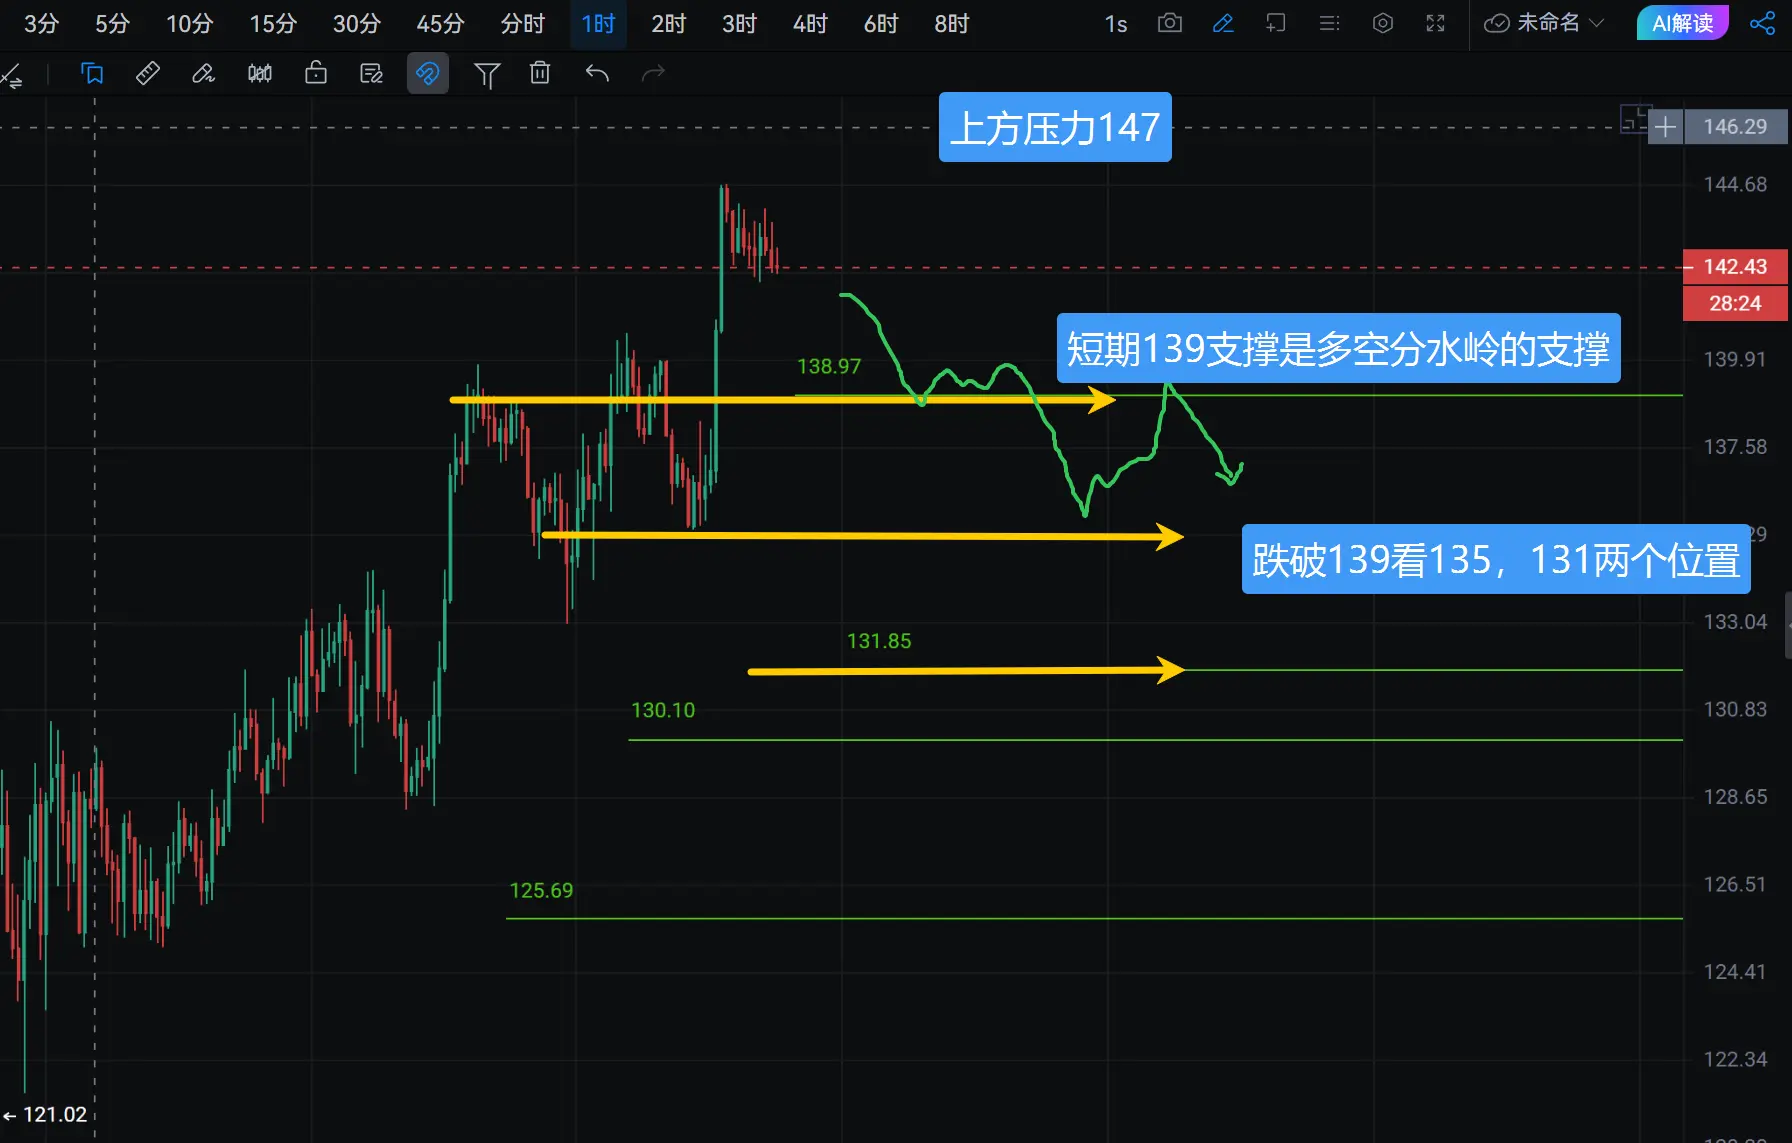
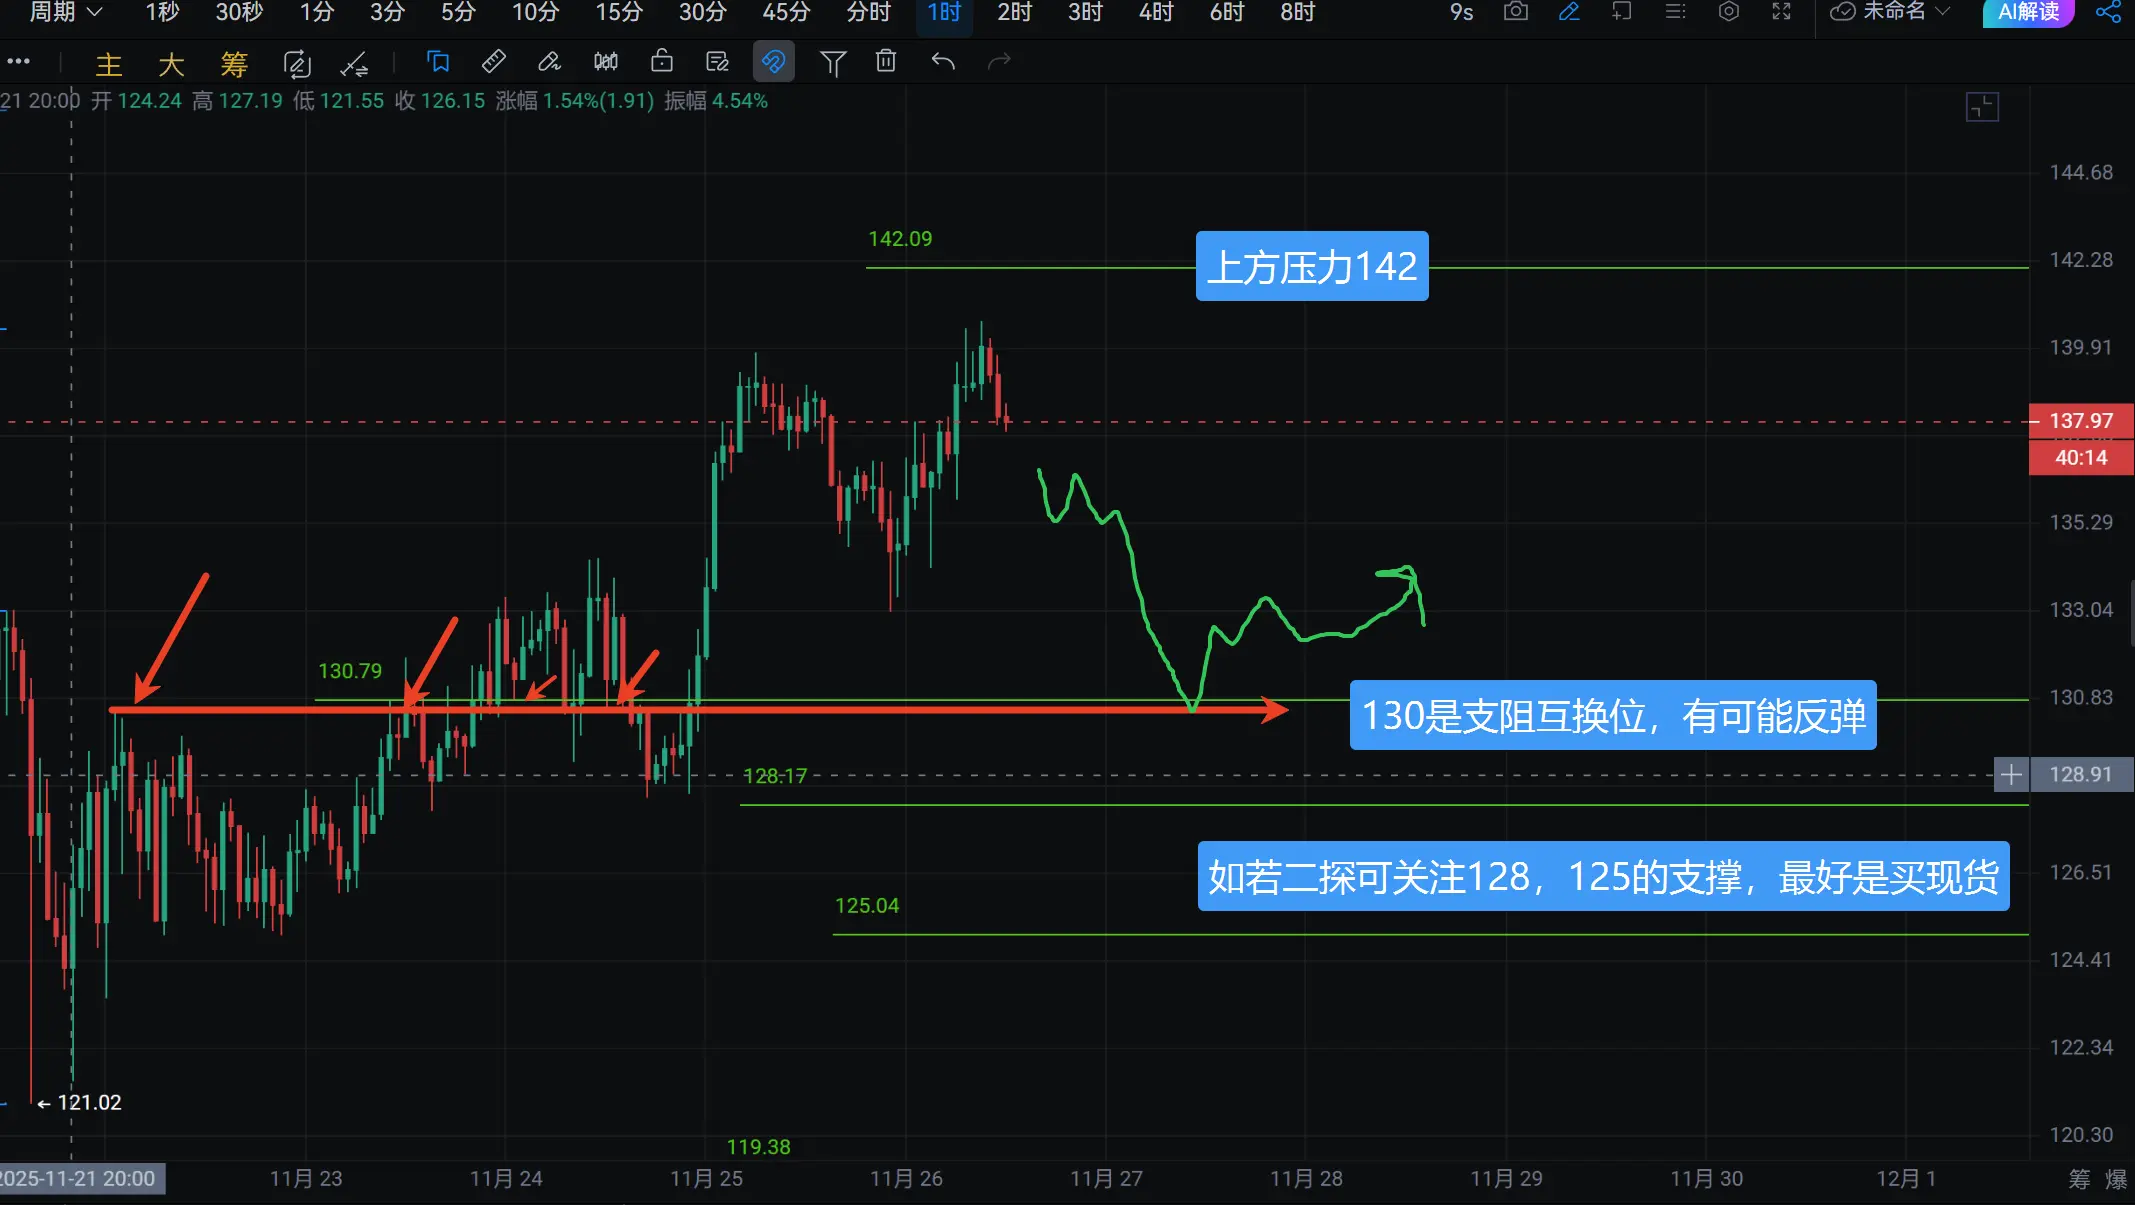
Here it comes, late-night benefits, laying out the plot for this Tuesday's exploration. $SOL Spot recommendation to buy in batches at 130-128-125, with this setup, your spot won't be trapped for long. Take profit can be looked at long-term at 146-152. For contracts, the extreme support is at 125, enter the position at 123, and set the stop loss at a closing below 121 on the hourly level. This is where you can find a suitable stop loss position; if the market moves unkindly, it might long wick candle down to 118 and quickly rebound. So prepare for several scenarios! Meeting adjourned!
SOL-4.32%
View Original
  • Reward
  • Comment
  • Repost
  • Share
"November 25 Market Analysis: Ending the Downtrend, the Three-Day Closing Line is Crucial"
The resistance of the hourly downtrend line for Bitcoin that was mentioned yesterday was completely breached in the early hours of yesterday, and the entire coin price has reached around 89000. From the extreme position of 80700 given last week to the current 8.9w, Bitcoin has finally shown some strength.
However, only here on the three-day line, if the closing price is above 89000-90000, the three-day line can be considered to have completed the bottom model. As for the signal logic of the three-day lin
BTC-2.07%
SOL-4.32%
ETH-1.65%
View Original
post-image
post-image
post-image
post-image
  • Reward
  • Comment
  • Repost
  • Share
[Continuing from the previous article, where is $SOL suitable for going long and buying the dip?]
The previous analysis indicates that Bitcoin still has a chance to continue to dip. The most optimistic scenario for Ethereum is to make a second dip to the range of 125-123. If it falls to this level and effectively rebounds, then this second dip would be considered valid.
It is also possible to discuss the likelihood of a bottoming out. If the situation worsens and there is no rebound at the 125-123 level, then we will be heading for new lows. A better scenario would be if the 119 level can spi
SOL-4.32%
BTC-2.07%
View Original
post-image
  • Reward
  • Comment
  • Repost
  • Share
Where is the bottom, and when will the market stop falling? A single analysis is enough to understand the future market.
After a slight increase, many want to buy at the bottom. Just one day without opening a position feels like a loss of 200 million, which reflects the true psychology of most retail investors. However, given today's market conditions, a straight upward movement is still too difficult. Firstly, the OBV time cycle on the 4-hour chart is insufficient, and the moving averages have yet to level out. Additionally, in terms of daily volume, the period for building a base here is
View Original
post-image
  • Reward
  • Comment
  • Repost
  • Share
"Market Analysis on November 24: How the Daily Line Attacks, Let's See the Trend Line Selection"
The market finally ushered in a wave of volatility on Sunday. First, the Bollinger Bands at the 1-hour level opened up, leading to an upward channel. In the morning, the market approached around 88000. It is important to note that this is near the downtrend line at the 1-hour level. For Bitcoin to go up first, we need to see whether the trend line is broken. If it goes down, several key support levels will still determine whether the market can stop falling!
If the hourly trend line on Bitcoin
BTC-2.07%
SOL-4.32%
ETH-1.65%
View Original
post-image
post-image
  • Reward
  • 1
  • Repost
  • Share
XiaomoWantsToTurnOvevip:
The section chief is ready to da moon!!
Go to bed early; this is not the place to bottom-fish. As a retail investor, it's very difficult to catch the absolute bottom from the big players. At the very least, you need to see a daily timeframe bottom pattern, or a 3-day candle bottom pattern, before you can determine that the downtrend has stopped. Only after the downtrend is confirmed to have ended should you consider bottom-fishing. Otherwise, a few more sharp drops and you won't be able to handle it—78,700, 77,600? Who knows—it's very hard to guess the bottom. The risk of bottom-fishing here is still very high. I advise everyone to
View Original
post-image
  • Reward
  • Comment
  • Repost
  • Share
Why do we say that you need to refer to the section chief's point? By comparing the trends of Figure 2 and Figure 3, you will find that $SOL is following the path I drew.
First, there was a bounce at the support level of 137, and when it broke down for the second time, it directly fell to 131 before bouncing back up. This is the application of key points; if you don't understand technical analysis, you can't draw such precise charts.
You have seen my analysis, at least you have an idea in your mind, you won't go short where you shouldn't, and you won't go long where yo
SOL-4.32%
View Original
post-image
post-image
post-image
  • Reward
  • Comment
  • Repost
  • Share
"November 19 Market Analysis: Endless Bottoms to Buy, but U Can Be Completely Lost"
Last night, it was good to remind that there is no V reversal and no bottom. I opened a short position at the highest point of 93700, and this morning, the profit has exceeded 2000 points. On the daily volume, there is still no possibility of a direct reversal here, and I have repeatedly reminded on the 4-hour chart that when the EMA15 hasn't gone up, how can there be a bottom? Therefore, our short position at 93700 is very accurate, basically opening short at the highest point. As long as a few support lev
BTC-2.07%
SOL-4.32%
ETH-1.65%
View Original
post-image
  • Reward
  • Comment
  • Repost
  • Share
"Market Analysis on November 18: The Decline Must Continue, Where Could the Bottom Be?"
In yesterday's analysis, we mentioned that the large coin starting with 8 had a great chance, and surprisingly, we saw it within less than a day. SOL has also reached the support level of 129 that we talked about and has rebounded. As for the upcoming market, where exactly we can see it, and where are the opportunities for left-side positioning. It should be stated that any left-side positioning here is at potential rebound points, but no one can accurately predict how much it will rebound. So it can be
BTC-2.07%
SOL-4.32%
ETH-1.65%
View Original
post-image
post-image
post-image
  • Reward
  • Comment
  • Repost
  • Share
The biggest point of divergence in the market right now is whether this is the bottom and whether it can reverse from the current 9w3. Those who follow the department head know that I only provide you with affirmative answers. It’s not yet time for a reversal, and this is not the bottom of the market. First, the time at the bottom is not enough; second, the weekly trend has just started and will not easily end. The price has just broken below the MA50, and without testing the MA120, there's no time to form a bottom, so how can there be a reversal? $SOL You can understand it as: did it jus
SOL-4.32%
BTC-2.07%
View Original
  • Reward
  • Comment
  • Repost
  • Share
[Market Analysis on November 17: Weekly Crisis, the Prelude to a Mini Bear Market]
Last week's weekly line has closed. After 2 years and 8 months, the Bitcoin weekly line has finally broken below the MA50 moving average, and it was a large bearish candle that broke through. It can be said that at the weekly level, the curtain of a small bear market has already begun. According to the movement of the moving averages, this could lead Bitcoin towards the weekly MA120, which means that Bitcoin starting with 80,000 is very likely to be seen this year.
$BTC The short-term pressure range for Bit
BTC-2.07%
SOL-4.32%
ETH-1.65%
View Original
post-image
post-image
  • Reward
  • 1
  • Repost
  • Share
OnceRaw,TwiceCookedvip:
Hold on tight, we're taking off to da moon 🛫
"Market Analysis on November 14: Beware of Another Plunge, Fear Index in Single Digits"
Yesterday's analysis indicated that there is a risk of a sharp decline on both the daily and 4-hour charts, with several resistance levels being reached. The entire drop hit the second support level provided yesterday, and this wave of decline was very rapid. The target of 94,000 is getting closer, and someone mentioned this morning that the fear index is at 16; is it the bottom? Clearly, when it drops to 93,000-94,000, the single digits will signal the bottom.
$BTC The Bitcoin is currently showing a p
BTC-2.07%
SOL-4.32%
ETH-1.65%
View Original
post-image
post-image
post-image
  • Reward
  • Comment
  • Repost
  • Share
  • Trending TopicsView More
  • Pin
Trade Crypto Anywhere Anytime
qrCode
Scan to download Gate App
Community
  • 简体中文
  • English
  • Tiếng Việt
  • 繁體中文
  • Español
  • Русский
  • Français (Afrique)
  • Português (Portugal)
  • Bahasa Indonesia
  • 日本語
  • بالعربية
  • Українська
  • Português (Brasil)