Scan to Download Gate App
qrCode
More Download Options
Don't remind me again today
蒋浩
vip
DeFi Analyst
Market Analyst
Quant Trader
No content yet
$ETH 12.01ETH, the big dump at the opening of the Asian market is mainly due to the domestic crackdown involving 13 departments again. Additionally, the incident regarding Powell's resignation letter led to a halt at the Asian market opening, triggering the support for market makers around the 3000 level, resulting in a downward trend! Currently, it has reached the support near 2790, with the focus for the day on the resistance around 2897, which is one of the previous points of market maker intervention. The technical pattern showed multiple evening star formations yesterday, and after th
ETH7.97%
View Original
post-image
  • Reward
  • Comment
  • Repost
  • Share
$BTC 1.26, BTC formed a trend of rising and falling yesterday, reaching a peak of 88400 during the session, followed by a pullback and oscillation trend, with a low of 86000 stabilizing! During the session, I also mentioned that without the involvement of market makers, the lower side is in a vacuum state, and subsequently, there was back-and-forth consolidation in the 88000-86000 range. The technical indicators have gradually been repaired, and to raise the price further, the market makers must cooperate with retail investors to pump. Today, close to Thanksgiving, the volume during the sessi
BTC6.85%
View Original
post-image
  • Reward
  • Comment
  • Repost
  • Share
$ETH 1.26ETH saw the first emergence of bullish energy bars on the daily chart yesterday, with RSI already above 30. The panic sentiment in the market has returned to normal levels, benefiting from a relatively large amount of buy the dip pressure accumulated below. After a wave of escape from the market makers yesterday, the amount of intervention has not changed much. Currently, there is a dense area built up in this region. Throughout the day, we still pay attention to the lower edge of the dense area, which is around the 2897 position. If the hourly chart's candlestick breaks below, th
ETH7.97%
View Original
post-image
  • Reward
  • 1
  • Repost
  • Share
Freegat1425vip:
once again raised the bar in the smartphone market with the launch of its latest flagship, the Infinix Note 60 Pro+. This device comes packed with cutting-edge specifications that appeal to tech enthusiasts and heavy users alike. From massive RAM and storage options to an camera setup and an enormous battery, the Note 60 Pro+ is
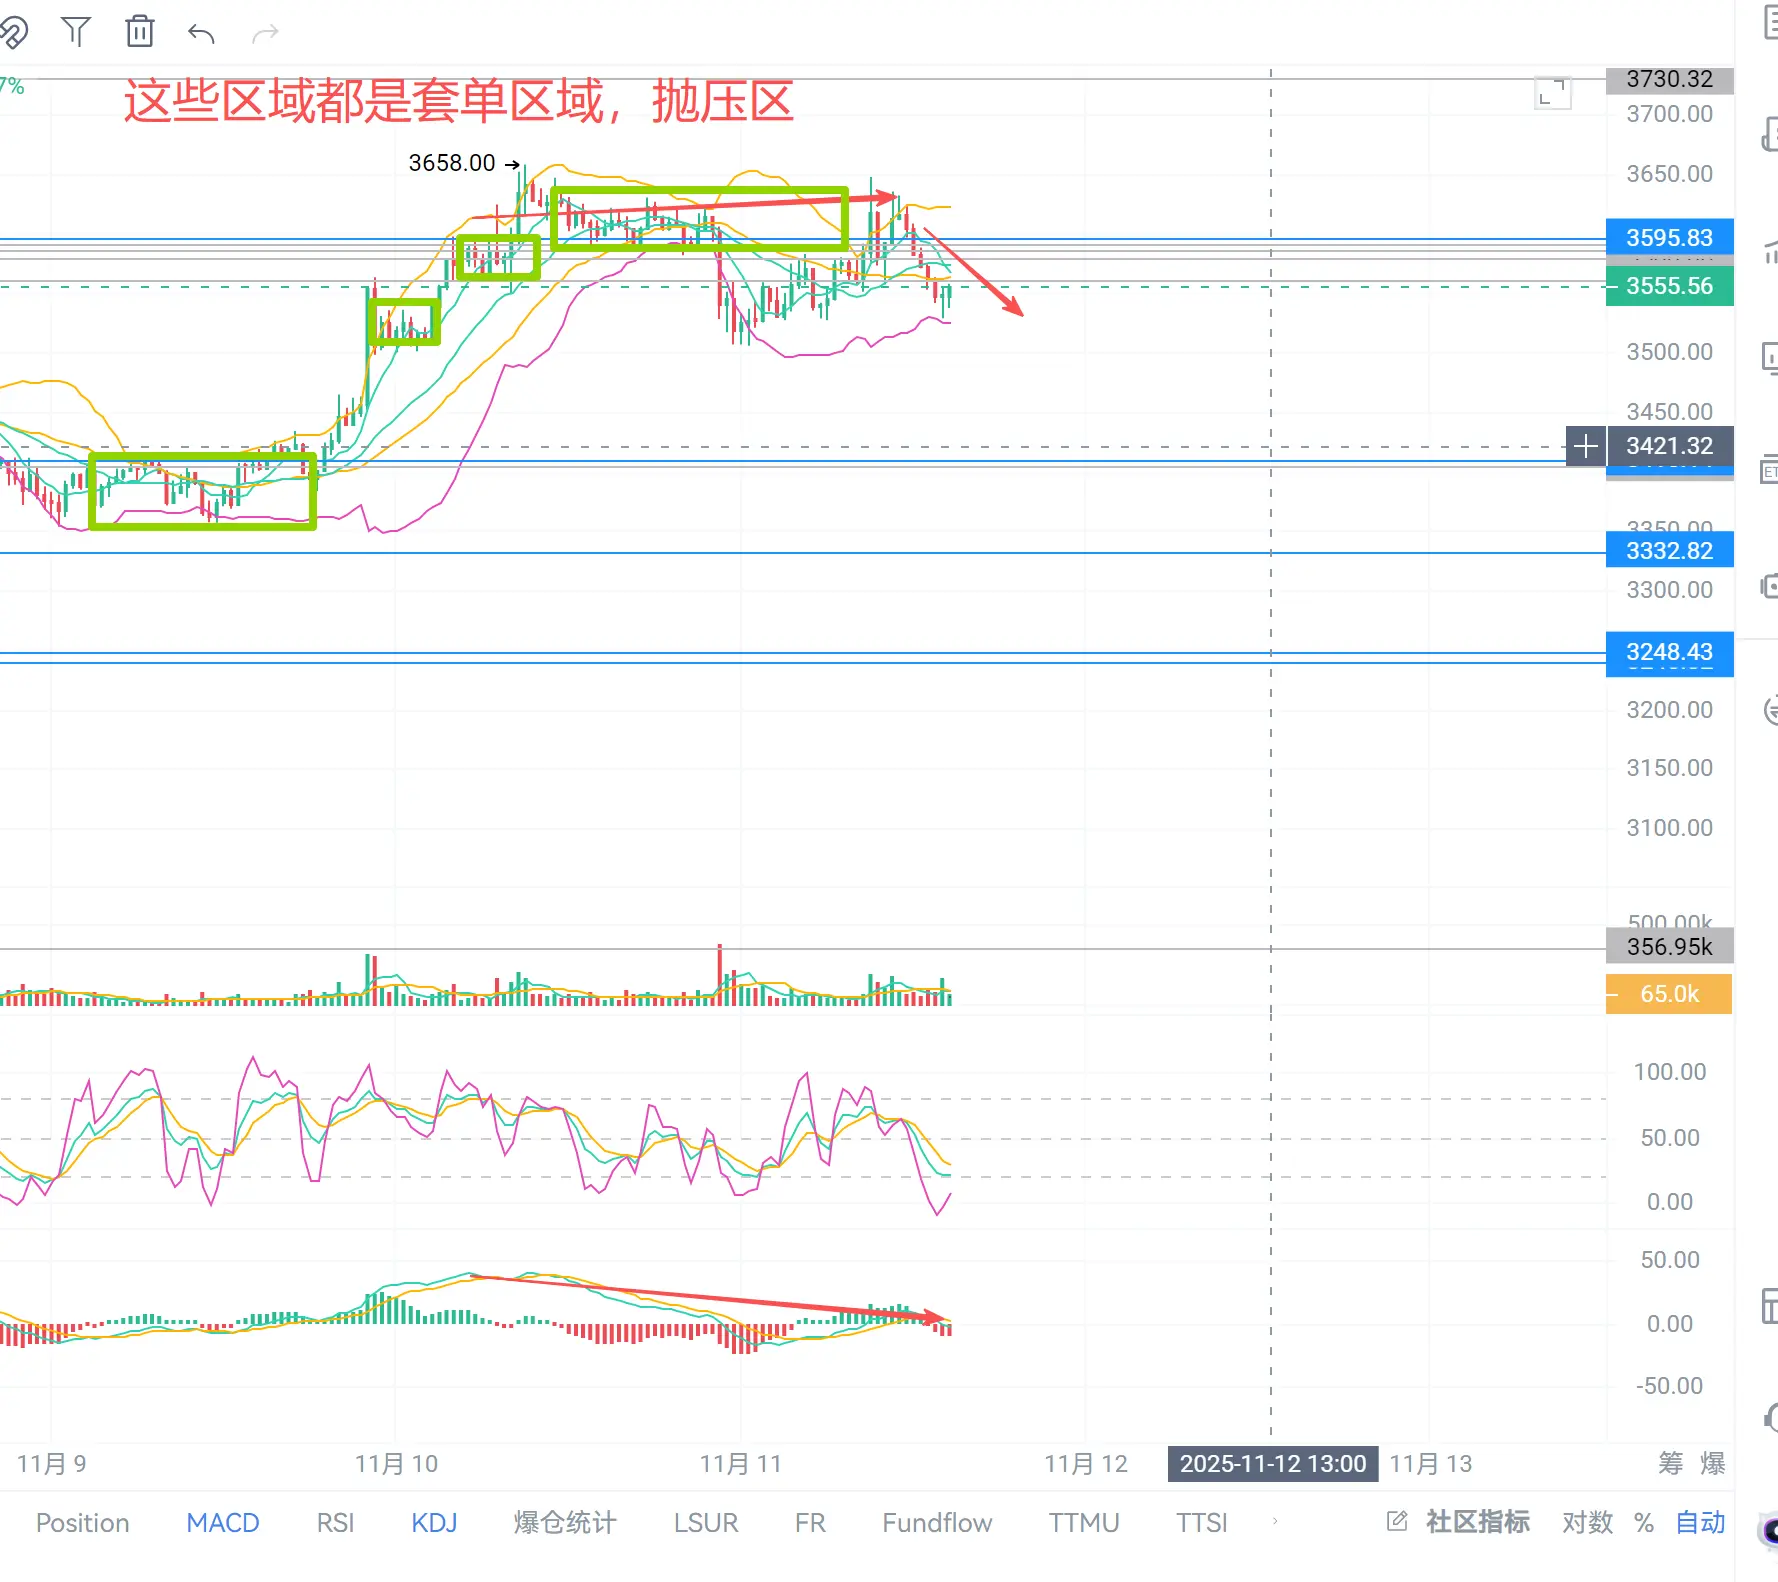
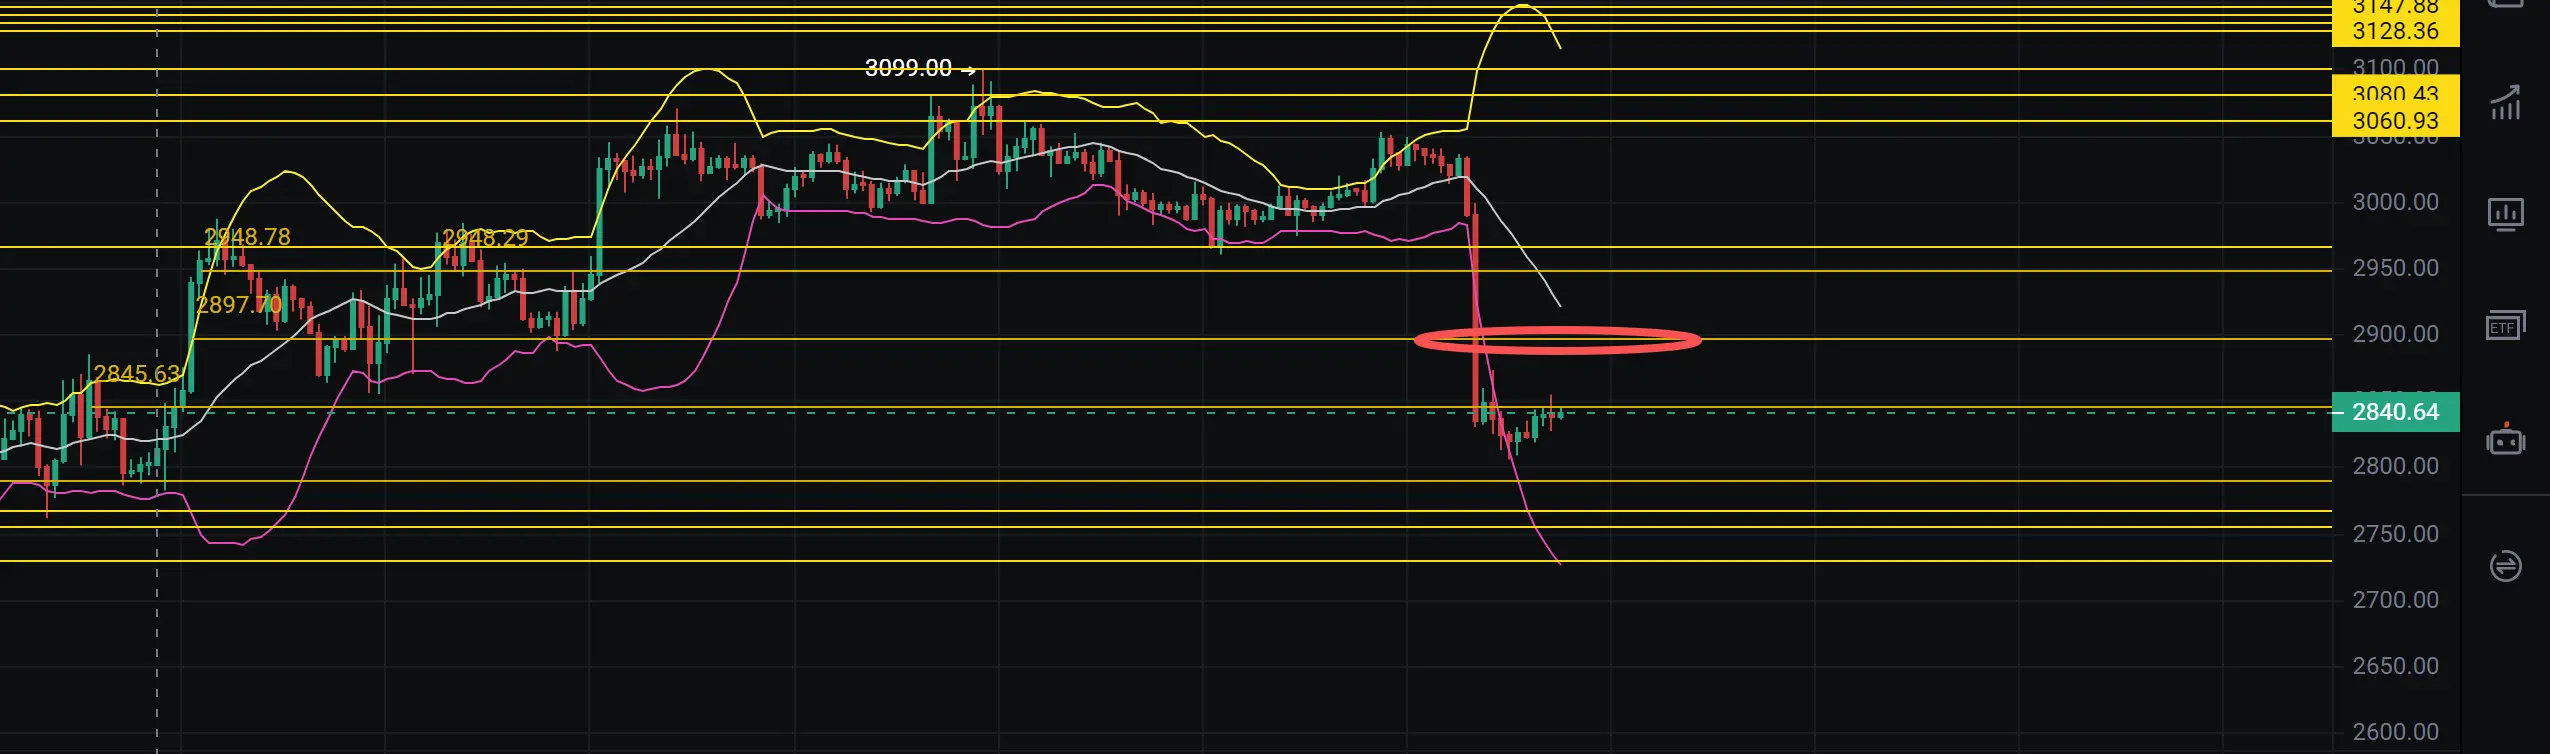
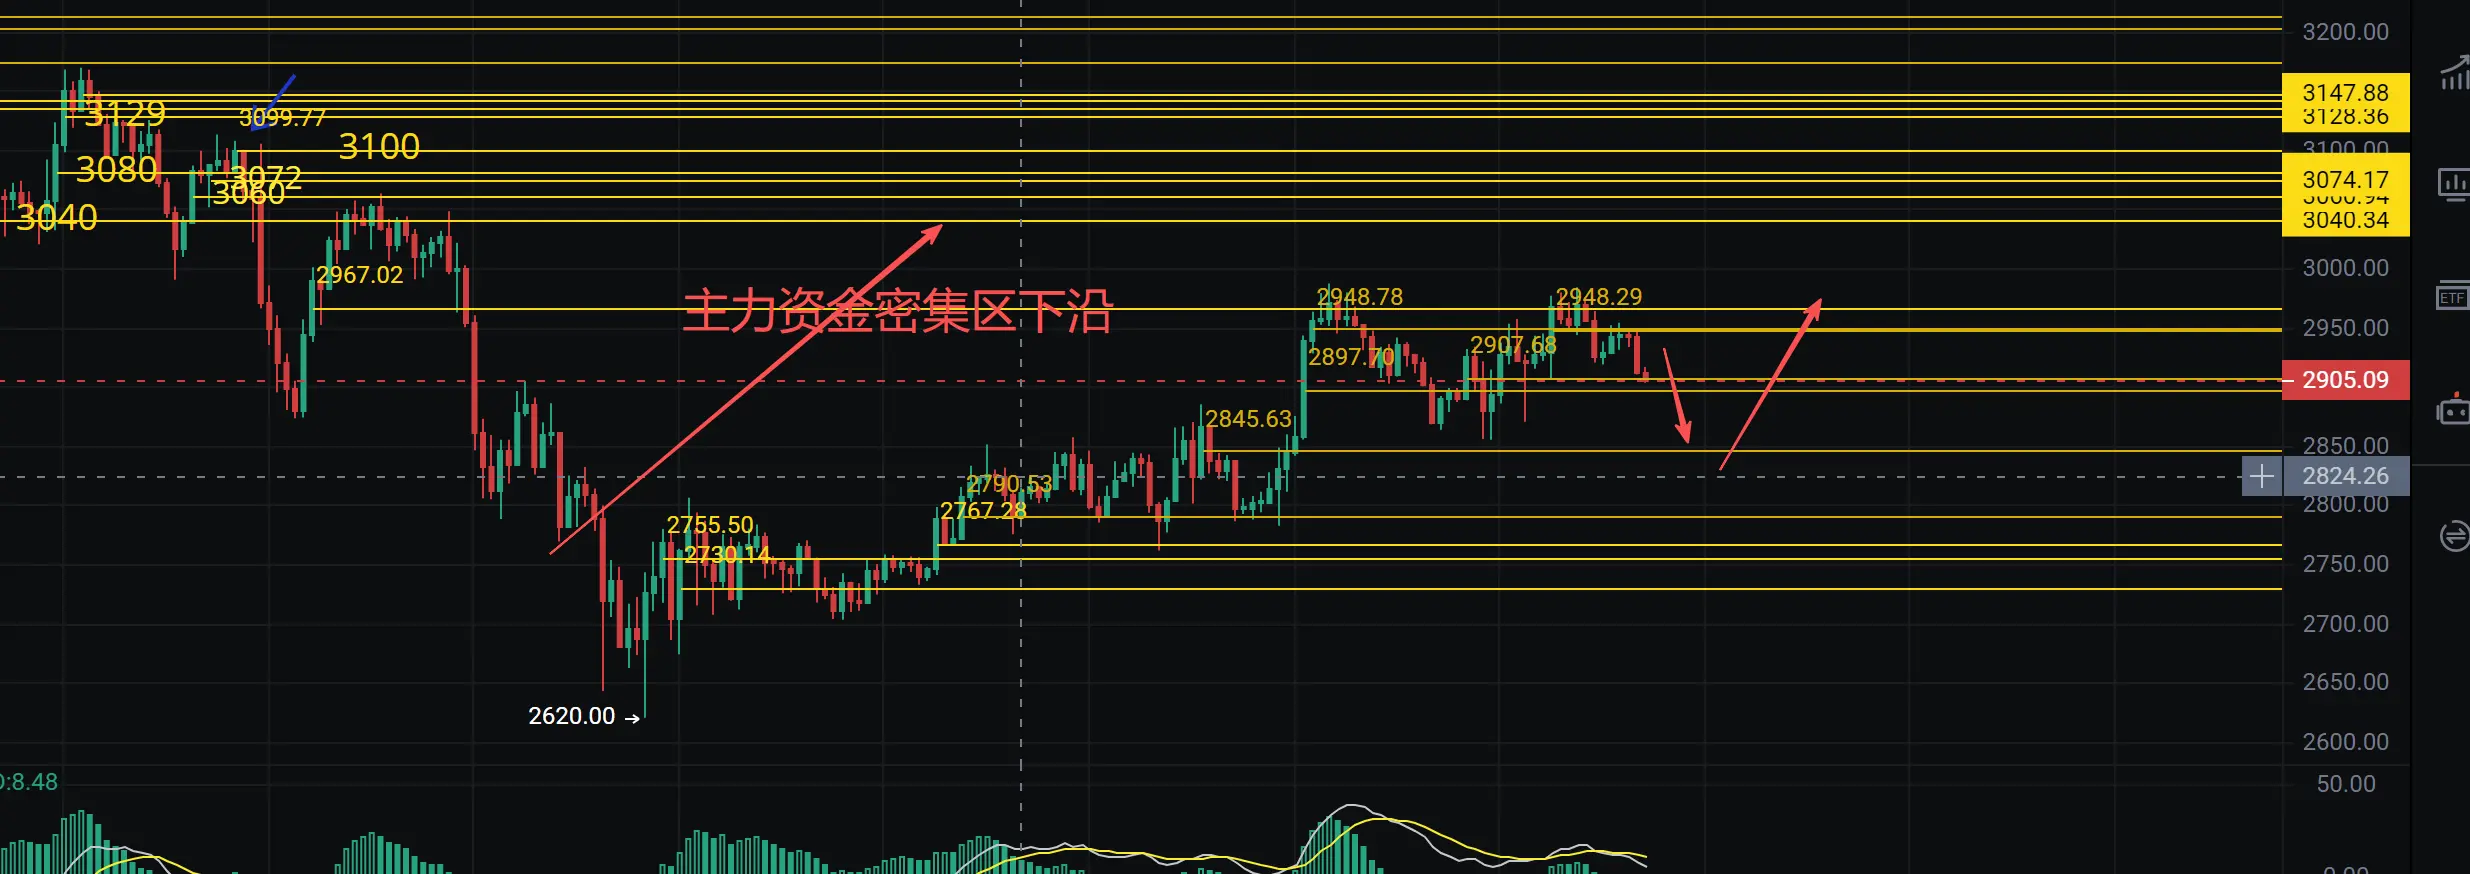
The morning video on 11.25ETH also mentioned whether it can truly break below around 2897 during the day. If it breaks below, then there is already a vacuum period with higher trade volumes down to around 2800. Currently, the main FOMO sentiment in the market is quite heavy, and market makers' funds have been staying inside without escaping. Once they escape, the price will fall back like point shaving to around 2800 and even lower to 2730. Last night, it was also emphasized that the upper area is a dense zone for market makers' funds!
Operation suggestion: Short at 2910, look for 2800
ETH7.97%
View Original
  • Reward
  • Comment
  • Repost
  • Share
The morning video on 11.25BTC mentioned that the daily chart is in a state of repairing indicators, with previous distortions. In the morning video, it was mentioned that there has been a movement of market maker funds and the current pullback has ended, with a vacuum area below. It was also emphasized in the chart that the hourly chart has already broken through the 87700 level! The operations before the European and American markets are relatively simple, just need to consolidate, and there is at least 1600 points of space below.
Operation suggestion: Short at 87700, looking for 85300.
Sell
BTC6.85%
View Original
post-image
  • Reward
  • Comment
  • Repost
  • Share
$ETH 11.24 Ether's thoughts: Yesterday, the ratio of net inflows to net outflows in the market did not change much, which means the main focus of the market is on BTC. I have also mentioned multiple times that there is certain resistance around 2880. Looking at the daily chart, it has formed a Morning Star pattern, so the price during the day has shown some upward fluctuations, which is better for repairing indicators! The price here is likely to form periodic oscillations for repair. The hourly chart shows an upward oscillation, and the high-level divergence on the small cycle has been re
ETH7.97%
View Original
post-image
  • Reward
  • Comment
  • Repost
  • Share
$BTC 11.13btc had a roller coaster yesterday, essentially characterized as market makers pumping and dumping. The intraday support level is around 1009, and it is consolidating within the upper range of 1025. This morning, BTC showed unusual movement again, indicating the suspicion of another pump and dump today! Do not blindly chase the market trends; if it holds above the 1025 level, then attention should be paid to the trap zone near 1035! Try to focus on short positions primarily and long positions secondarily; there is already a bottom divergence in the short cycle! It was also mentioned
BTC6.85%
View Original
post-image
  • Reward
  • Comment
  • Repost
  • Share
$ETH 11.13 The price of eth is basically forming an inverted hammer line on the daily chart after a fall. Looking at the intraday, there are still low points as the hourly and 4-hour charts are slowly building a bottom. We will see if the bottom divergence in the short cycles of 15 minutes and 5 minutes can produce a low point before proceeding with low position longs. The focus area below is at 3330-3360, and on the upside, we need to pay attention to 3510 (which may be the point where the market maker pumps and dumps), with minor resistance at 3480-3460. The back-and-forth amplitude is relat
ETH7.97%
View Original
  • Reward
  • Comment
  • Repost
  • Share
After the sideways movement of 11.11ETH yesterday, the price faced resistance at 3630 and pulled back to rebound at 3510. This morning, it surged again to the 3640 area. As mentioned yesterday, the selling pressure zone is at the 3650-3620 position! This position is where retail investors are concentrated in their trap orders. If it cannot effectively hold above, it will likely move to the next area, which is 3510-3540. Throughout the day, we will focus on the support in this area. If it cannot effectively support, the price may see the 3360-3400 area again. For upward movement, we will pay at
XRP7.75%
View Original
post-image
  • Reward
  • Comment
  • Repost
  • Share
11.11BTC experienced a situation of first falling and then rising during the Sideways period of the US market yesterday, with the lowest point touching 104600 before rebounding, and the US market and early morning period rebounding to a maximum of 107500! A Bullish line was formed on the daily chart! Overall, there are signs of a trend reversal! As the protocol signing on the 12th approaches, there has been back-and-forth movement in the market with not many clear signals! Currently, the hourly chart shows a recovery of yesterday's rise after three consecutive bearish candles following a p
BTC6.85%
View Original
post-image
  • Reward
  • Comment
  • Repost
  • Share
$ETH ETH daily chart received a bullish line, breaking the previous alternating pattern of rise and fall. The current price hovers around 3600, while the sell pressure zone is at 3650-3620. Both the 4-hour chart and the hourly chart have already shifted momentum. The lower support levels are at 3550-3490-3380. The divergence on the 15-minute attack line has almost been fully repaired! Currently waiting for the price to challenge the 3650-3620 area. If it holds above again, we can expect continued higher trade volumes to 3700 (sell pressure zone) and 3820! The operational suggestion is to focu
ETH7.97%
View Original
post-image
  • Reward
  • Comment
  • Repost
  • Share
$BTC Under the influence of the U.S. shutdown, BTC and ETH experienced a wave of pump, and market sentiment is gradually being digested. Currently, the panic sentiment has still not improved, and the market's liquidity is extremely poor, with a prevailing wait-and-see attitude due to the approaching signing date of the trade ceasefire agreement. Trump also spoke yesterday about the impact of tariffs! Be cautious of key fluctuations tonight and tomorrow!
BTC formed an alternating yin-yang pattern with a solid bullish candlestick yesterday, gradually showing signs of a reversal! The 4-hour
BTC6.85%
View Original
post-image
  • Reward
  • Comment
  • Repost
  • Share
$ETH There have been no updates in the past few days. Currently, Ether is pulling back slightly. This evening, the situation will be down first and then up! Just observe the support level at the positions between 3340 and 3350! Depending on the situation in this area, make your move! #美国ADP数据超预期 #加密市场观察
ETH7.97%
View Original
post-image
  • Reward
  • Comment
  • Repost
  • Share
$BTC BTC closed as a Bullish line yesterday, recovering from the previous fall without a lower wick. In the evening, it was also mentioned that there was no close above 111000. The daily chart is still in a downtrend, with strong support at 106 in the short term. The trend remains skewed to the downside before the 12th. The hourly chart shows a somewhat irregular inverse head and shoulders pattern, with an upward movement needing to focus on completing the pattern at 113100! On the offensive line, it is still in a northward fluctuation, and relatively safe is around 108800 lying in ambush, wit
BTC6.85%
View Original
post-image
  • Reward
  • Comment
  • Repost
  • Share
$ETH Yesterday, the closing was a Hammer Bullish line. Combined with the previous continuous bearish trend, the price has not stabilized above the resistance level of 3900. During the session, the resistance levels of 3880-3900 were also mentioned multiple times. The overall trend is still relatively weak, and I have previously emphasized the need to observe the market sentiment before the 12th, as the favorable information in the market has essentially been digested! At 6 AM this morning, it was detected that ETH's market maker funds seemed to be fleeing! As you can see, last night the pr
ETH7.97%
View Original
  • Reward
  • Comment
  • Repost
  • Share
$ETH 10.31, the triangle consolidation before the ETH daily chart has turned into a small trading range, and the continuous downward movement has driven the price towards the rising trend. The price has repeatedly touched the lower 3700-3730 area, forming strong support multiple times. If this area is tested again, the price will inevitably plummet during the session, impacting down to 3500-3400. In the short term, there are no significant reversal signs seen. The 4-hour chart, after breaking the trend downwards, is currently still in the rebound and repair stage. The points to watch during t
ETH7.97%
View Original
  • Reward
  • 1
  • Repost
  • Share
$BTC 10.31, BTC market analysis, today is the end of the monthly line, and there are relatively large variables! The daily chart has continuously closed with 4 consecutive bearish bars, and the Bollinger Bands have contracted from previously bullish to neutral. Yesterday, I also emphasized to adopt a neutral mindset as much as possible before the 12th. The price on the 4-hour chart has dropped from 116300 all the way down to 106200, and during the early trading session, a large-scale Rebound appeared for the first time. Based on this recovery point, the area around 111300 looks relatively safe
BTC6.85%
View Original
post-image
  • Reward
  • Comment
  • Repost
  • Share
  • Trending TopicsView More
  • Pin
Trade Crypto Anywhere Anytime
qrCode
Scan to download Gate App
Community
  • 简体中文
  • English
  • Tiếng Việt
  • 繁體中文
  • Español
  • Русский
  • Français (Afrique)
  • Português (Portugal)
  • Bahasa Indonesia
  • 日本語
  • بالعربية
  • Українська
  • Português (Brasil)