Trade
Basic
Futures
Futures
Hundreds of contracts settled in USDT or BTC
TradFi
Gold
Trade global traditional assets with USDT in one place
Options
Hot
Trade European-style vanilla options
Unified Account
Maximize your capital efficiency
Demo Trading
Futures Kickoff
Get prepared for your futures trading
Futures Events
Participate in events to win generous rewards
Demo Trading
Use virtual funds to experience risk-free trading
Earn
Launch
CandyDrop
Collect candies to earn airdrops
Launchpool
Quick staking, earn potential new tokens
HODLer Airdrop
Hold GT and get massive airdrops for free
Launchpad
Be early to the next big token project
Alpha Points
Trade on-chain assets and enjoy airdrop rewards!
Futures Points
Earn futures points and claim airdrop rewards
Investment
Simple Earn
Earn interests with idle tokens
Auto-Invest
Auto-invest on a regular basis
Dual Investment
Buy low and sell high to take profits from price fluctuations
Soft Staking
Earn rewards with flexible staking
Crypto Loan
0 Fees
Pledge one crypto to borrow another
Lending Center
One-stop lending hub
VIP Wealth Hub
Customized wealth management empowers your assets growth
Private Wealth Management
Customized asset management to grow your digital assets
Quant Fund
Top asset management team helps you profit without hassle
Staking
Stake cryptos to earn in PoS products
Smart Leverage
New
No forced liquidation before maturity, worry-free leveraged gains
GUSD Minting
Use USDT/USDC to mint GUSD for treasury-level yields
More
ERIIKANOVA
No content yet
ERIIKANOVA
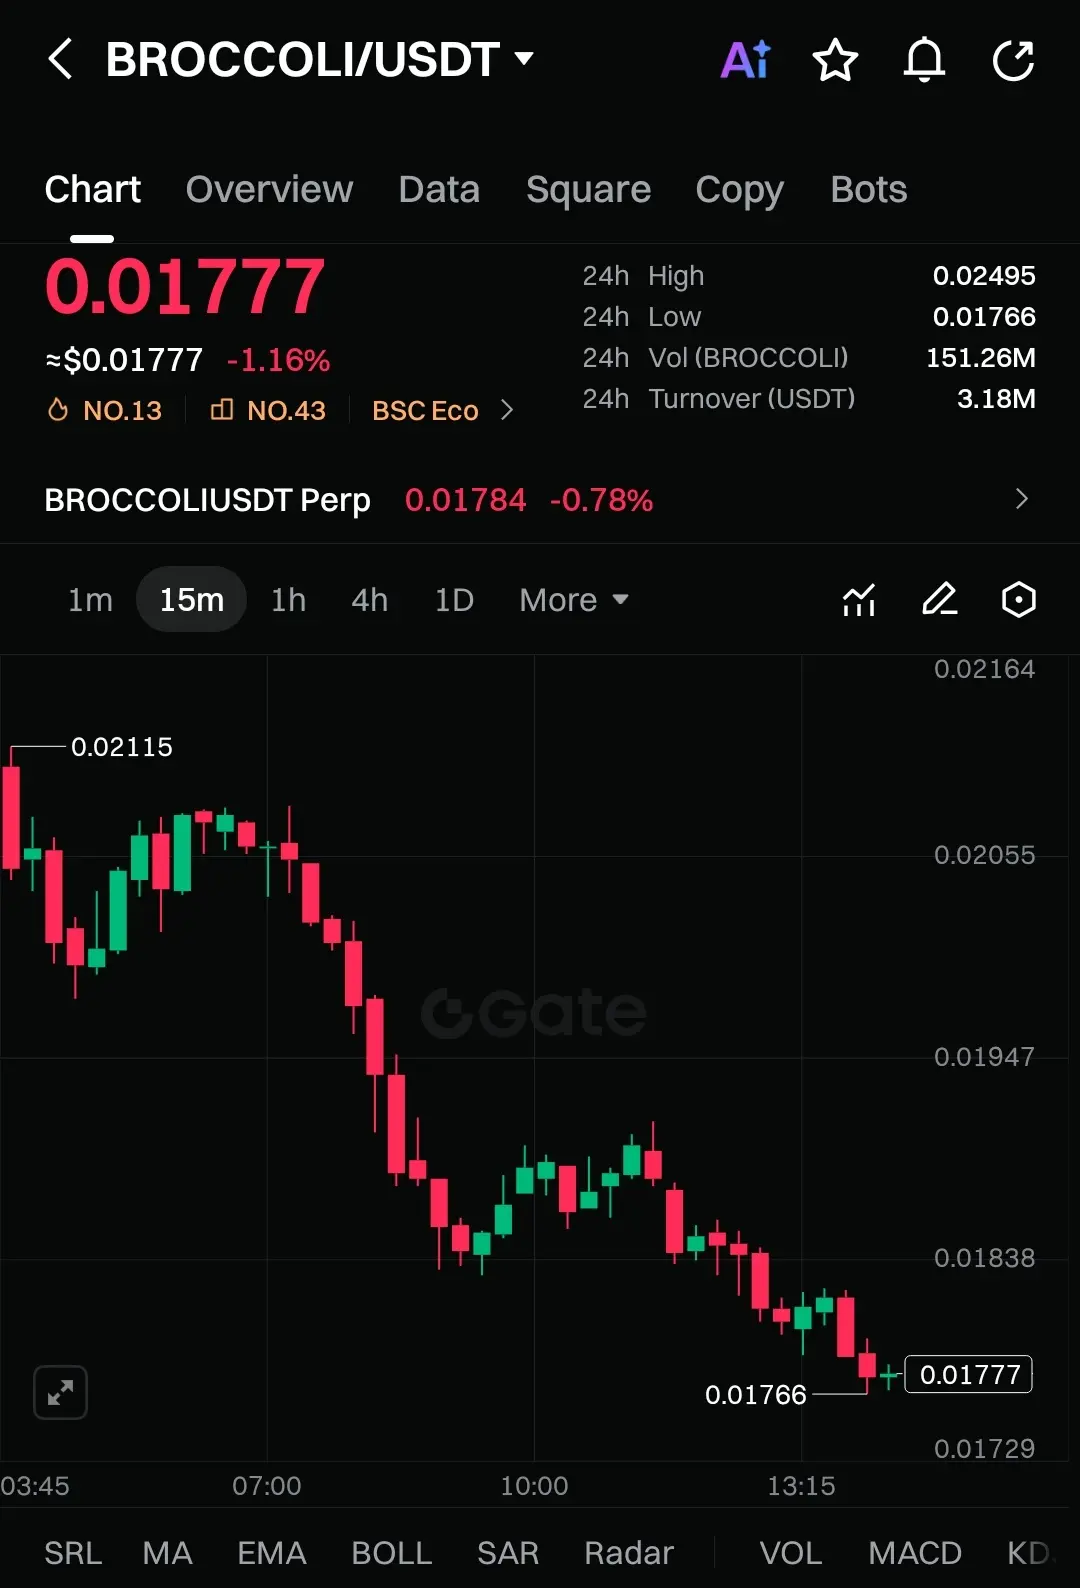
$BROCCOLI /USDT
Current Price: ~$0.01777
24H Change: −1.16%
Market Structure: Lower highs + lower lows
Recent Action: Strong crash followed by weak consolidation
BROCCOLI has been in a clear downtrend after rejecting from the $0.021–0.022 zone. The recent sideways move around $0.018 is acting as a bearish consolidation, not a reversal.
On the 1H timeframe, bearish candles dominate, with buyers failing to reclaim key resistance levels — a classic continuation pattern to the downside.
Trade Setup (Short Bias)
• Entry Zone: $0.0179 – $0.0183 (pullback / rejection area)
• Target 1 🎯: $0.0170
•
BROCCOLI10,67%
- Reward
- like
- Comment
- Repost
- Share
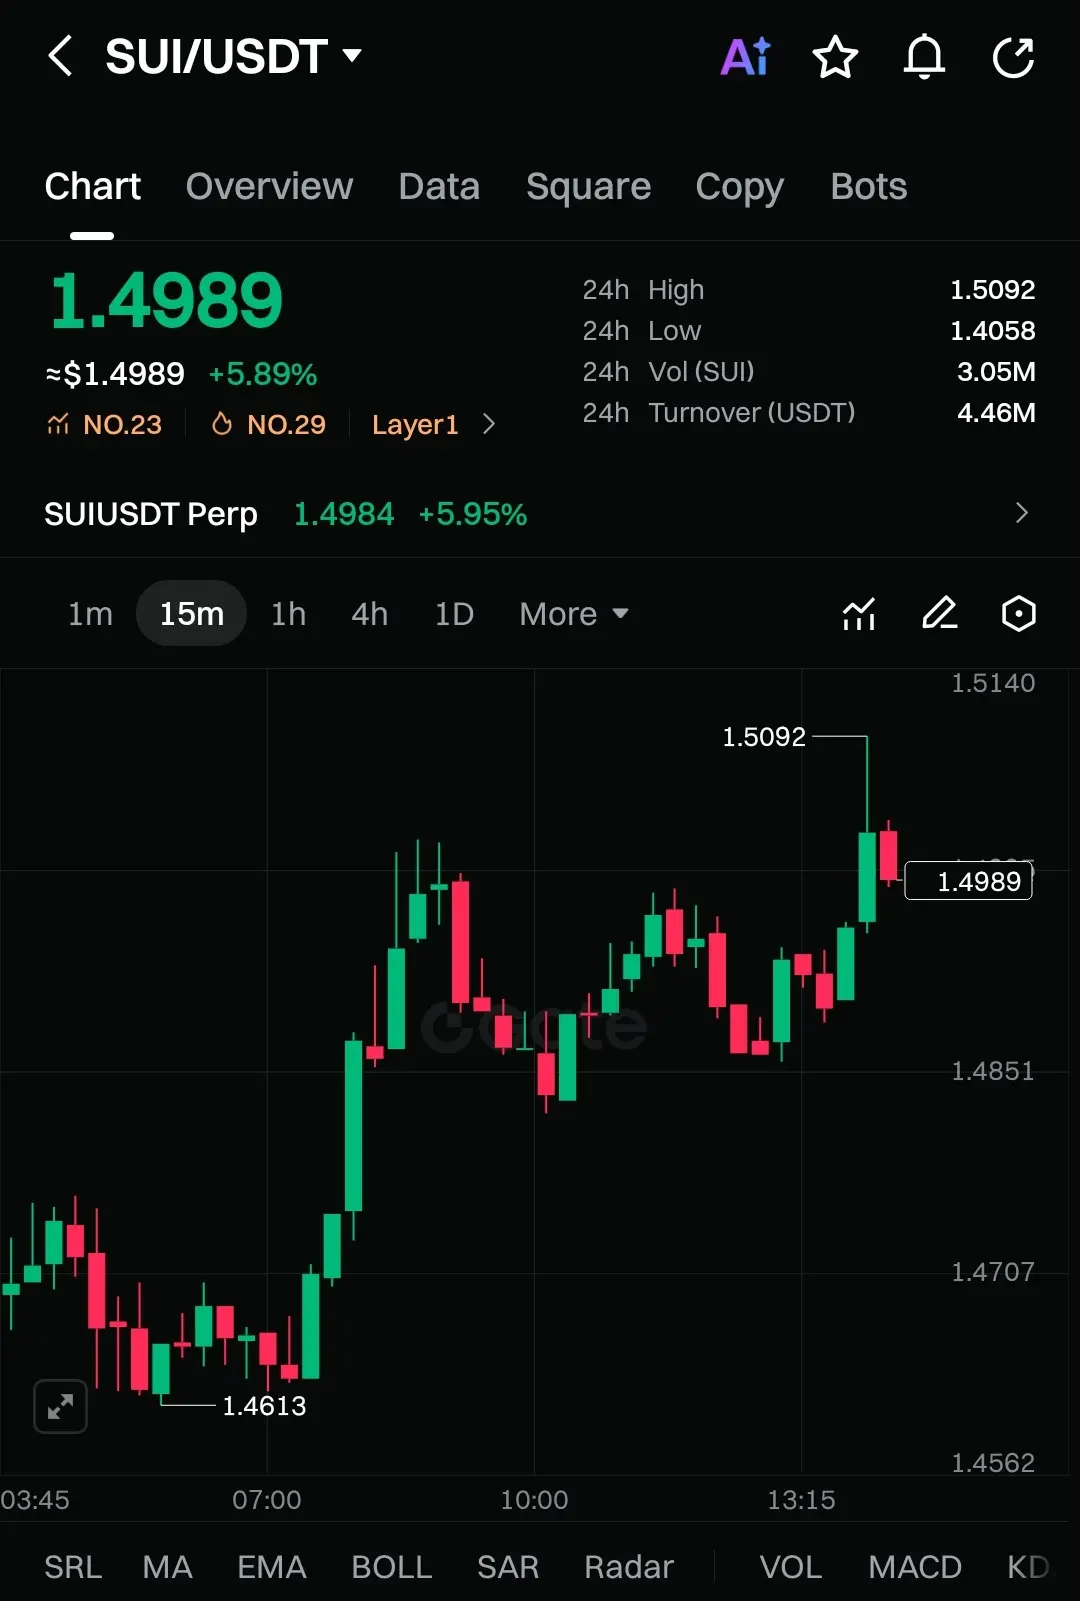
$SUI /USDT
Current Price: ~$1.499
24H Change: +5.8%
Market Structure: Higher highs + higher lows
Recent Action: Strong breakout after consolidation
After holding the $1.46 demand zone, SUI pushed aggressively higher and broke above the intraday resistance near $1.49–1.50. The move is impulsive, not corrective — a strong sign of real buying interest.
On the 1H timeframe, bullish candles are stacking with shallow pullbacks, indicating momentum is building, not exhausting.
Trade Setup (Long Bias)
• Entry Zone: $1.485 – $1.495 (pullback / retest buy)
• Target 1 🎯: $1.52
• Target 2 🎯: $1.55
• T
SUI9,73%
- Reward
- like
- 1
- Repost
- Share
GateUser-8699b427:
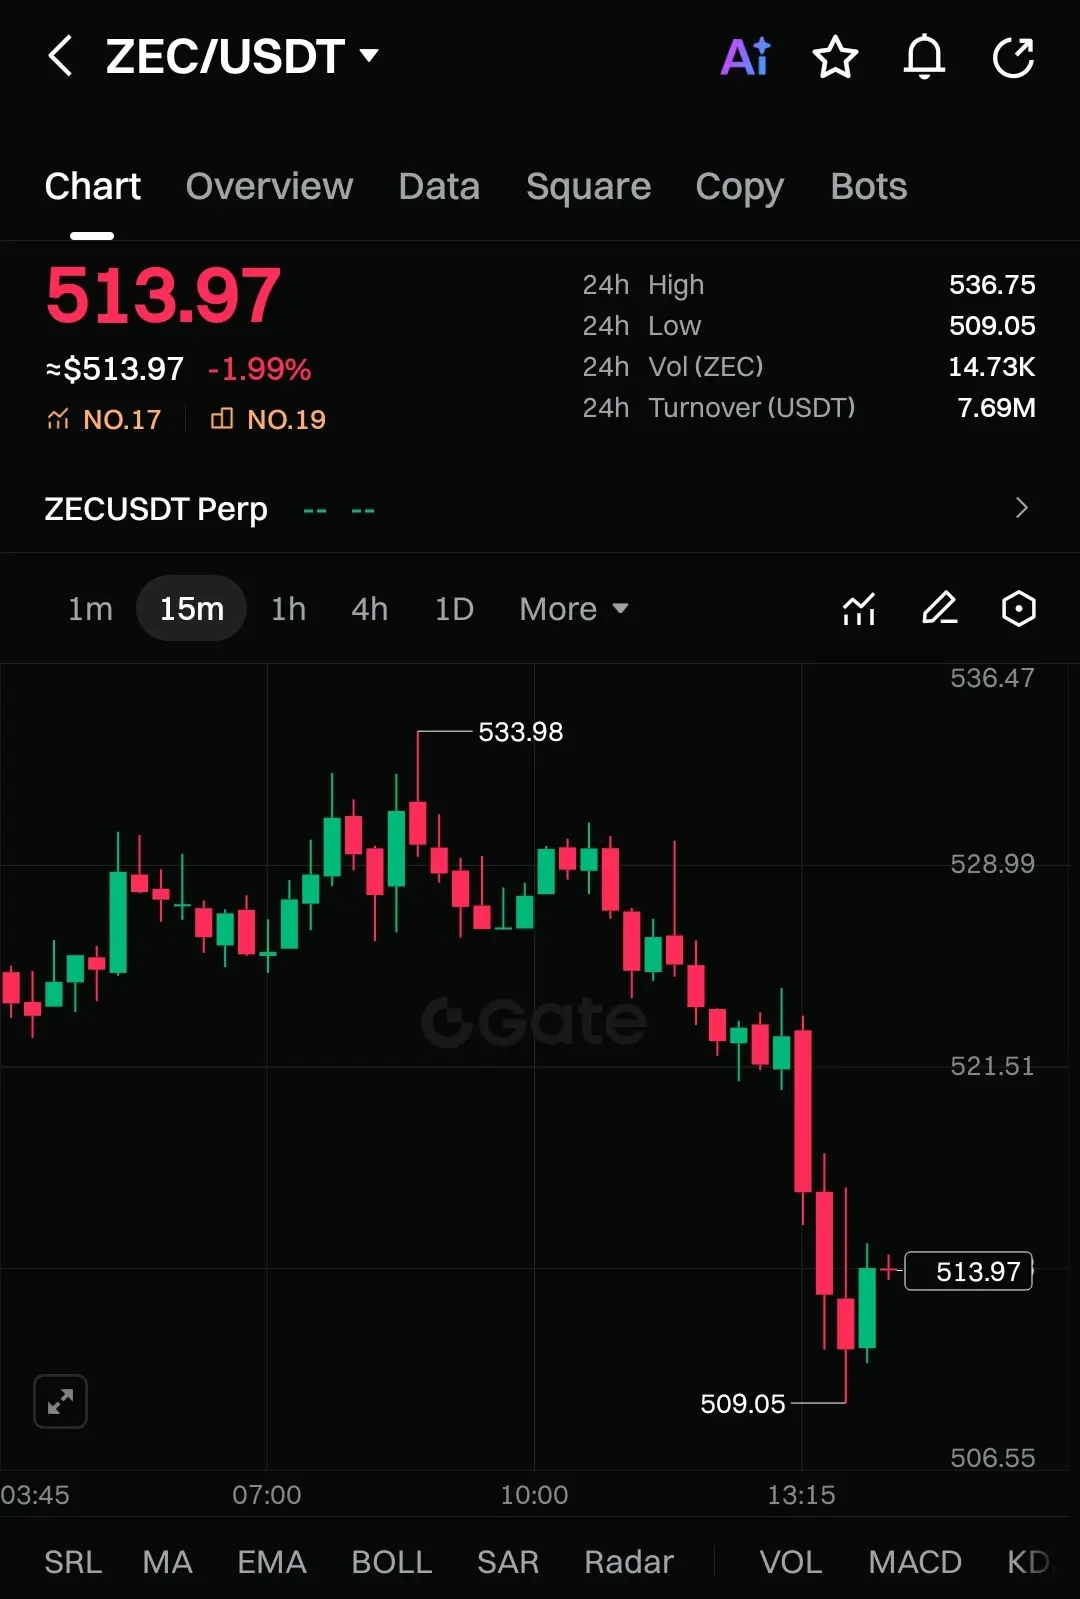
Happy New Year! 🤑$ZEC /USDT
Current Price: ~$513.9
24H Change: −1.99%
Market Structure: Lower highs + sharp breakdown
Recent Action: Strong bearish crash from resistance
After failing near the $533–536 zone, ZEC saw a violent sell-off, breaking multiple intraday supports. The bounce from $509 looks corrective rather than impulsive.
On the 1H timeframe, sellers are clearly dominant. Long red candles and weak recovery attempts suggest bearish momentum is still active.
Trade Setup (Short Bias)
• Entry Zone: $518 – $522 (pullback / rejection zone)
• Target 1 🎯: $509
• Target 2 🎯: $502
• Target 3 🎯: $490
• Sto
ZEC9,28%
- Reward
- 1
- 1
- Repost
- Share
GateUser-8699b427:
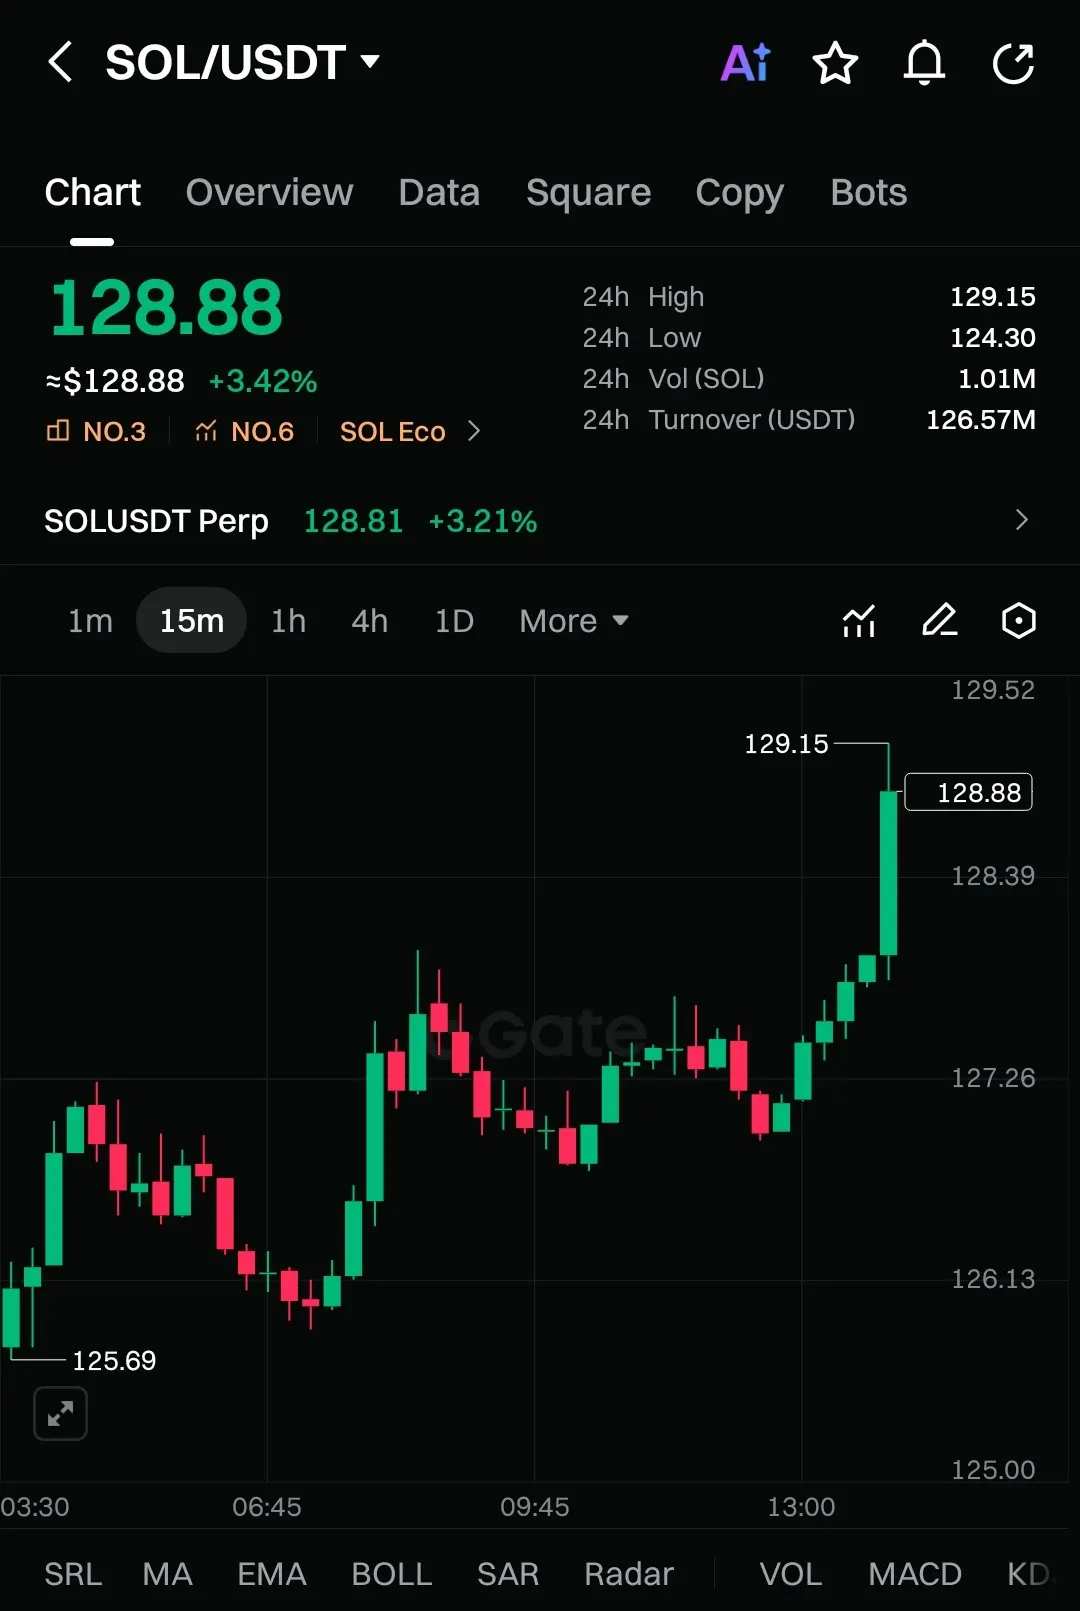
Happy New Year! 🤑$SOL /USDT
Current Price: ~$128.8
24H Change: +3.4%
Market Structure: Higher highs + higher lows
Recent Action: Bullish breakout from consolidation
After a healthy pullback and base formation around $126–127, SOL has pushed strongly above intraday resistance. The latest candles show impulsive bullish momentum, suggesting continuation if volume holds.
On the 1H timeframe, buyers are clearly in control, and price is expanding after compression — a classic continuation setup.
Trade Setup (Long Bias)
• Entry Zone: $127.8 – $128.4 (pullback buy / retest zone)
• Target 1 🎯: $130.2
• Target 2 🎯:
SOL12,14%
- Reward
- 1
- 1
- Repost
- Share
GateUser-8699b427:
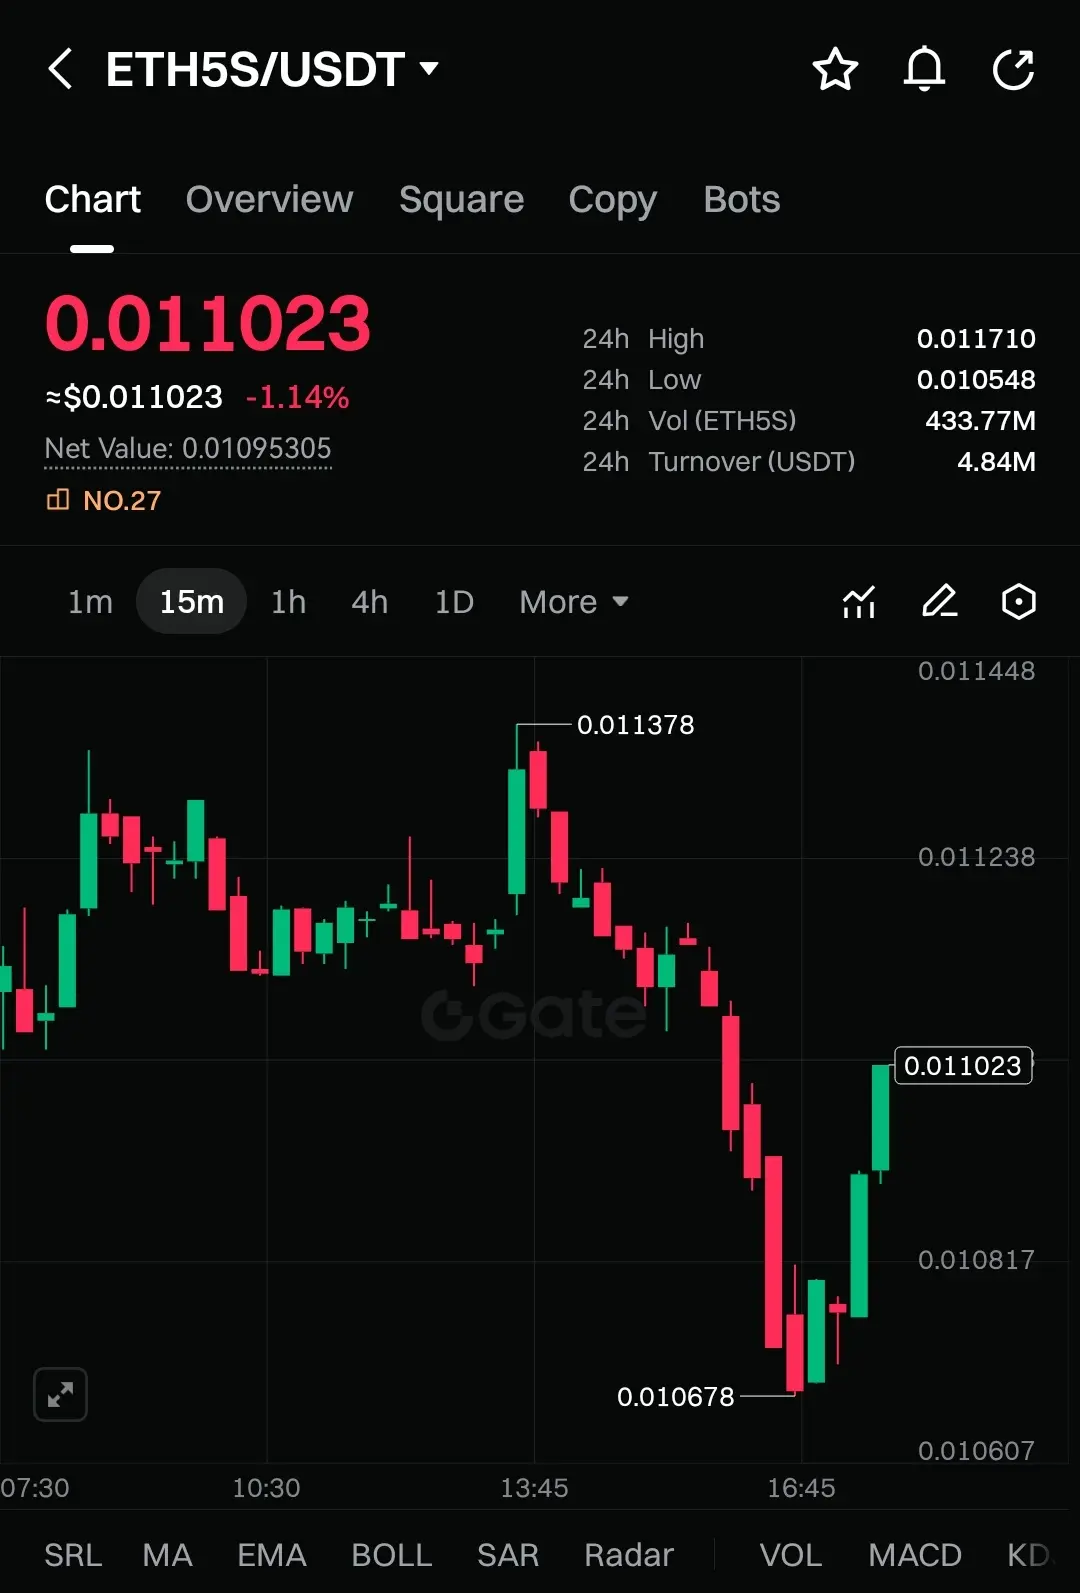
Happy New Year! 🤑$ETH5S /USDT
$ETH5S is trading around 0.01102, down -1.1% in the last 24 hours, after a sharp sell-off and a short-lived rebound. Following the failed push near 0.01138, price rolled over and printed a lower low around 0.01068, confirming downside pressure before a weak corrective bounce.
On the 1H timeframe, the structure remains bearish:
Clear rejection from local resistance
Strong impulsive sell candles dominating the move
Rebound looks corrective, not impulsive
Price still below key resistance zones
This action points to bearish continuation after a breakdown, not accumulation.
Trade Set
ETH5S-34,77%
- Reward
- 1
- Comment
- Repost
- Share
$LIGHT /USDT
$LIGHT is trading around 1.1648, up +157% in the last 24 hours, reflecting extreme momentum after a powerful vertical breakout. Price exploded from the 0.31 base, printed a peak near 1.40, and is now consolidating above key reclaimed levels, which is constructive rather than bearish.
On the 1H timeframe, the structure remains bullish despite volatility:
Strong impulsive move followed by a tight consolidation
Higher lows holding above the 1.05–1.10 zone
Sellers unable to force a deep pullback
Price acceptance above the breakout base
This looks like post-breakout consolidation, no
LIGHT6,19%

- Reward
- 1
- Comment
- Repost
- Share
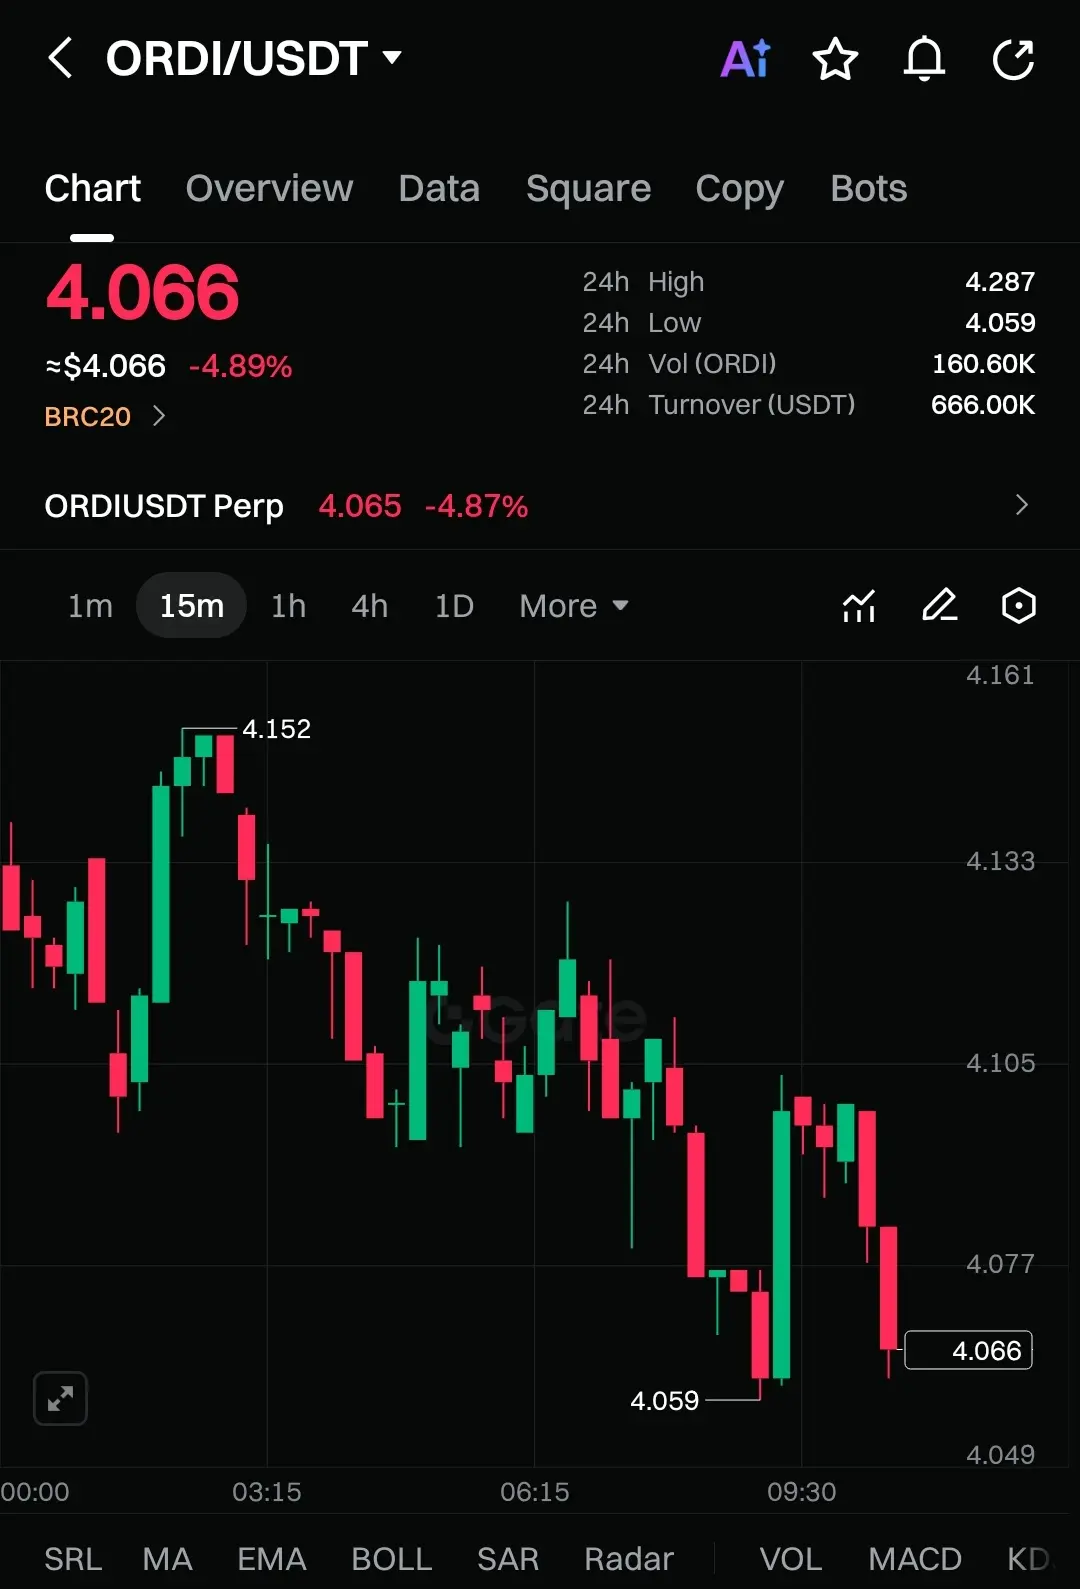
$ORDI /USDY
Current price is showing strong bearish pressure, with ~-4.9% change in the last 24 hours. After a failed recovery attempt near 4.15, price rolled over hard and is now printing lower highs and lower lows, a classic sign of trend weakness.
On the 1H timeframe, we can clearly see consecutive bearish candles, shallow pullbacks, and rejection wicks — all pointing to momentum building on the downside rather than a healthy consolidation.
Market Structure & Momentum
Breakdown from 4.15 resistance
Bearish continuation structure intact
Buyers failing to reclaim prior support
Price hoveri
ORDI9,68%
- Reward
- like
- 2
- Repost
- Share
PlayAroundAndGetRich :
:
Coins that can't even drop completely are still bearish all day???View More
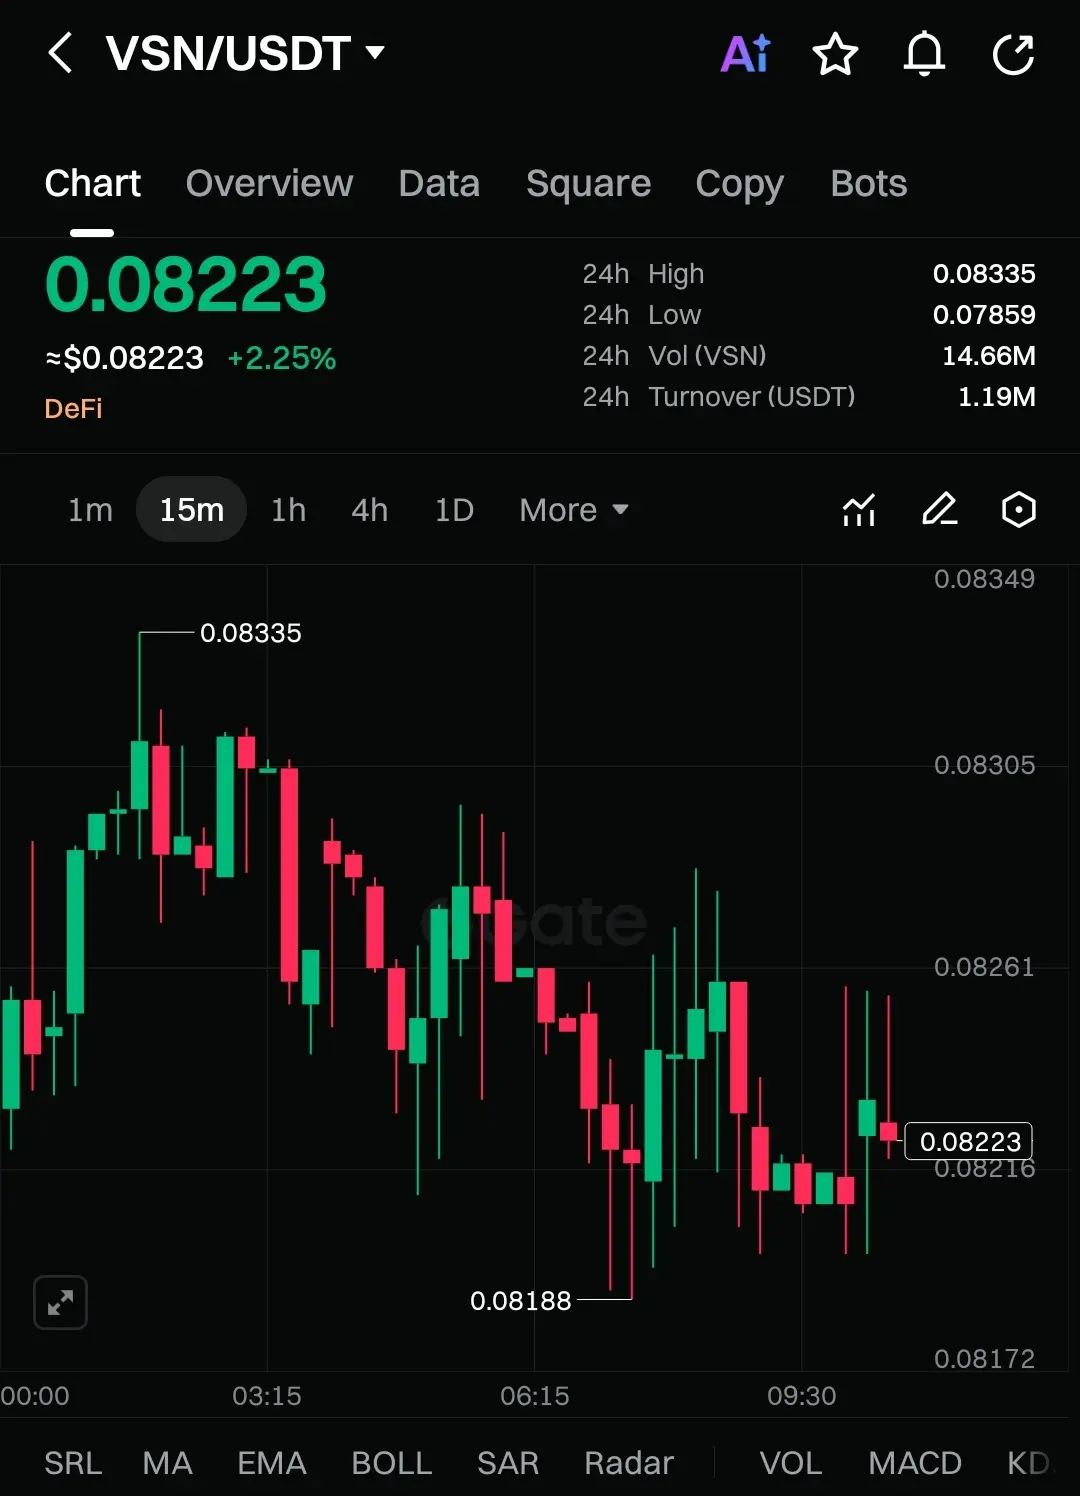
$VSN /USDT
Current price is showing healthy upside activity, with ~+2.25% change in the last 24 hours. After a clean bounce from the 0.0818 support zone, price is now consolidating above support, suggesting accumulation rather than distribution.
On the 1H timeframe, we can see higher lows forming and bullish reaction candles, which hints that momentum is slowly building for a potential upside continuation.
Market Structure & Momentum
Strong defense around 0.0818–0.0820
Price holding above intraday support = buyers in control
Consolidation below resistance often precedes expansion
Bias remai
VSN-1,21%
- Reward
- like
- Comment
- Repost
- Share
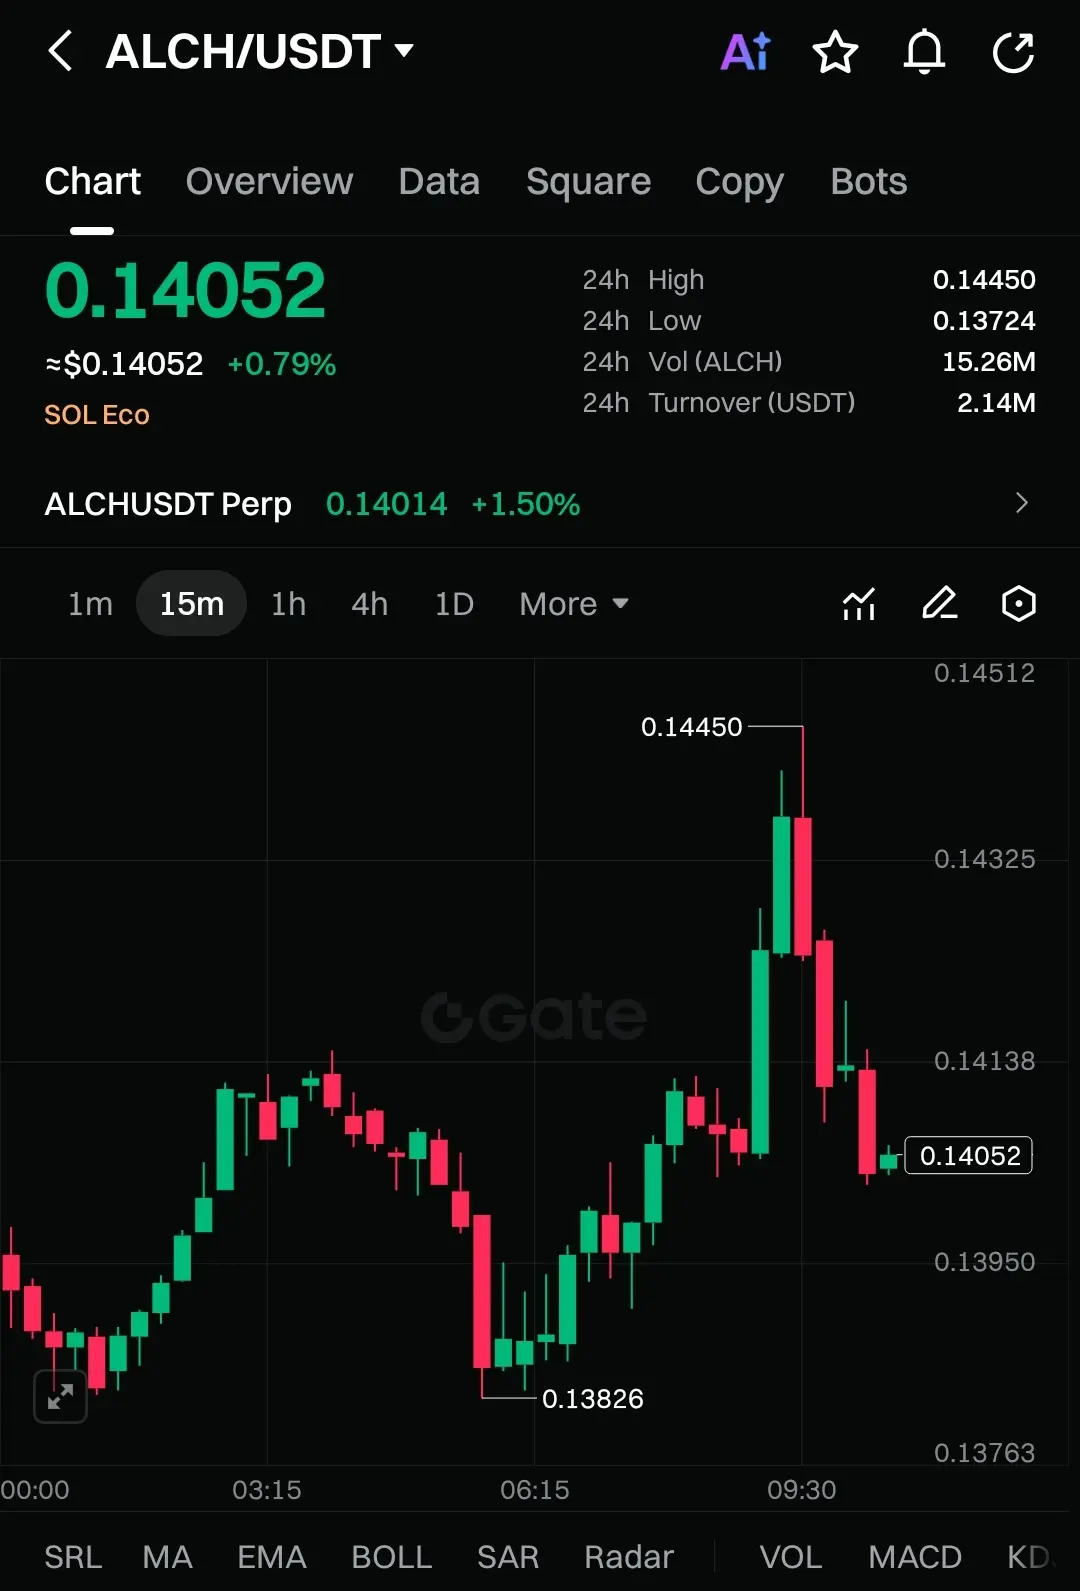
$ALCH /USDT
Current price is showing moderate strength, with ~+0.8% change in the last 24 hours. After a sharp breakout attempt toward 0.1445, price faced rejection and is now pulling back toward the 0.140 area. This looks less like a crash and more like a post-impulse cooldown.
On the 1H timeframe, we can clearly see bearish candles forming after the rejection, suggesting short-term selling pressure and momentum shifting neutral-to-bearish.
Market Structure & Momentum
Strong impulse from 0.1383 → 0.1445
Rejection wick at resistance = buyers losing control short-term
Pullback is holding abo
ALCH5,93%
- Reward
- like
- 1
- Repost
- Share
AnnaLinaTrader:
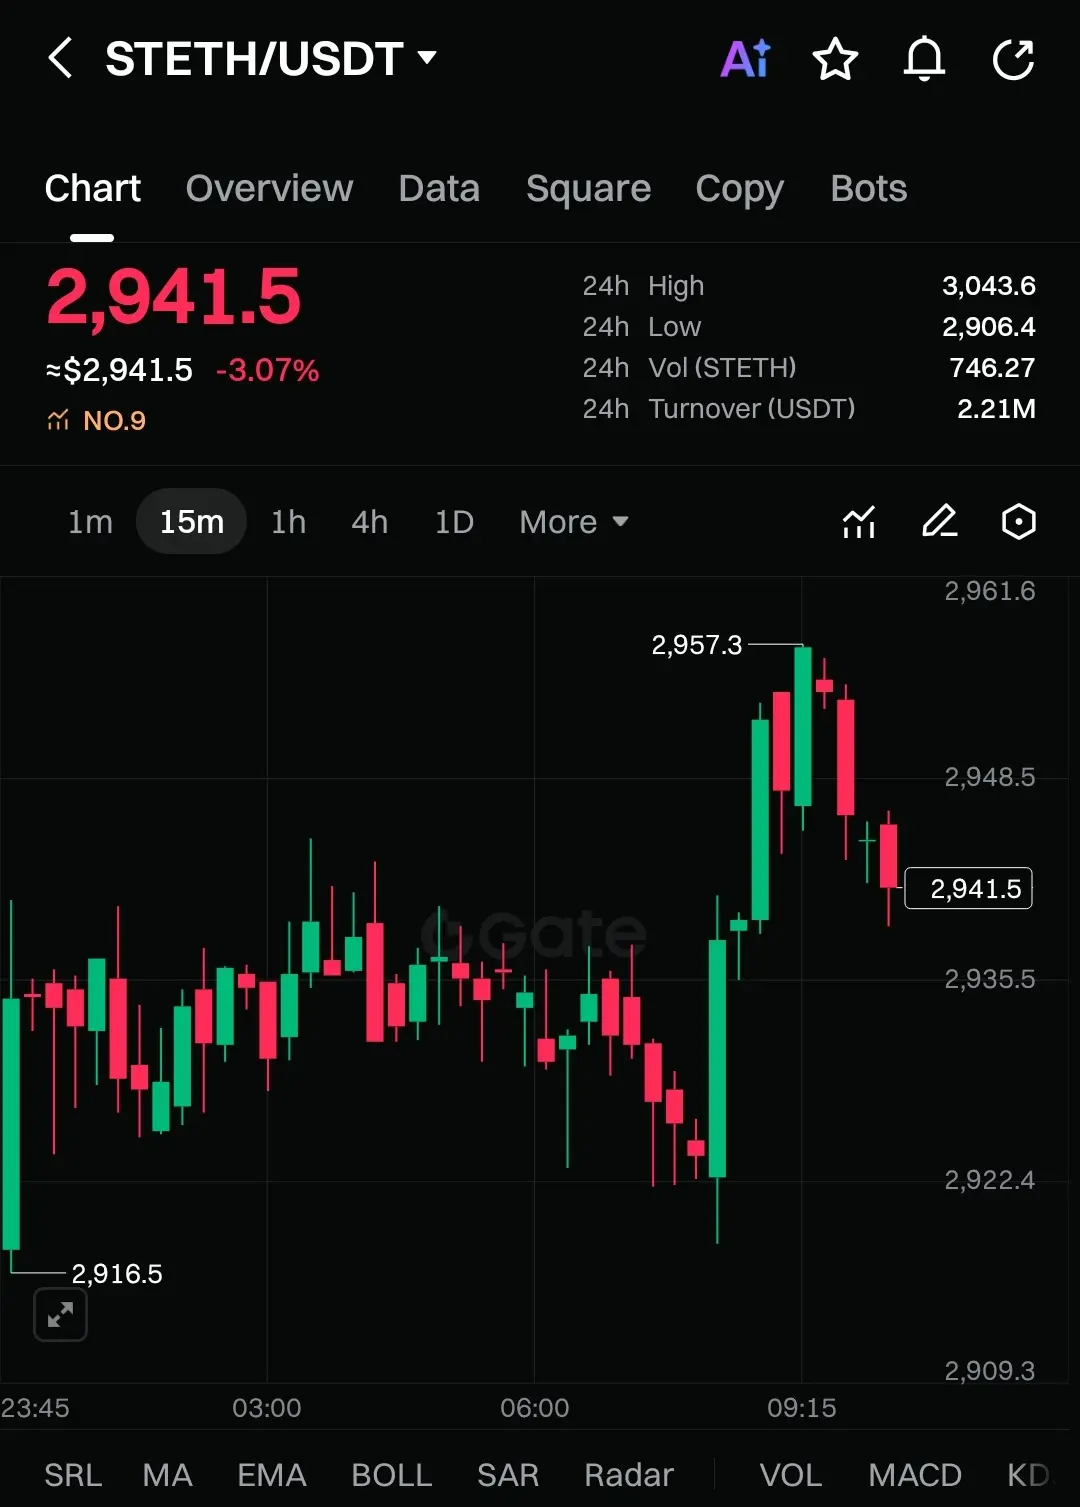
Christmas to the Moon! 🌕$STETH /USDT
Current price is showing strong volatility, with a ~-3.0% move in the last 24 hours. After a sharp breakout impulse from the 2920 area toward 2957, price failed to sustain higher levels and is now pulling back with consecutive bearish candles.
On the 1H timeframe, the structure suggests a classic impulse → rejection → retracement pattern, indicating short-term exhaustion rather than immediate continuation.
Market Structure & Momentum
Strong bullish push was rejected near 2957 resistance
Bearish candles forming right after the high = profit-taking
Momentum is cooling, hinting at
STETH8,63%
- Reward
- like
- Comment
- Repost
- Share
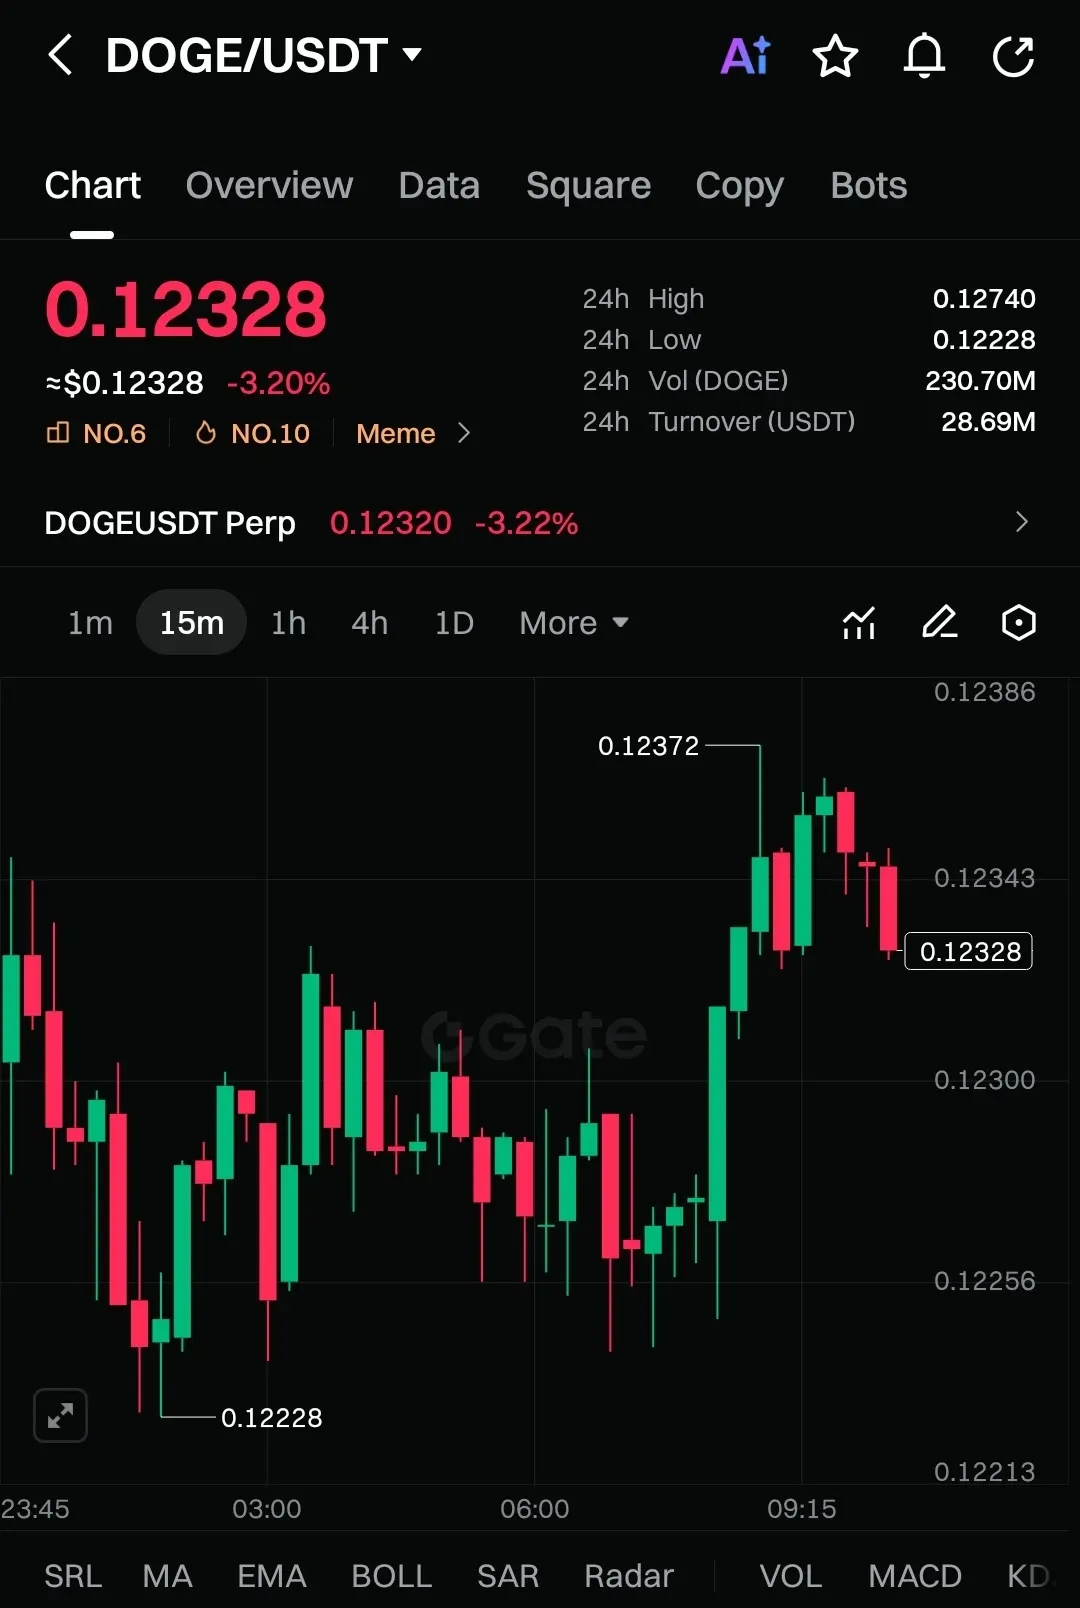
$DOGE /USDT
Current price is showing strong volatility, with ~-3.2% change in the last 24 hours. After a short-term breakout attempt toward 0.1237, price faced rejection and immediate sell pressure, pushing it back toward the 0.123 area.
On the 1H timeframe, we can clearly see bearish candles forming after the spike, which usually signals exhaustion of buyers and short-term momentum shifting bearish. Volume also cooled after the impulse move — a classic sign of a fake breakout / liquidity grab.
Market Structure Insight
Price failed to hold above 0.1237 resistance
Bearish candles + upper wic
DOGE7,35%
- Reward
- 7
- 4
- Repost
- Share
PTDpro28 :
:
UPDATE: 🇺🇸 US Spot Crypto ETF Flows (December 22) 📉 Bitcoin: -$142M
📈 Ethereum: +$84M
📈 XRP: +$44M
📈 Solana: +$7.5M
View More
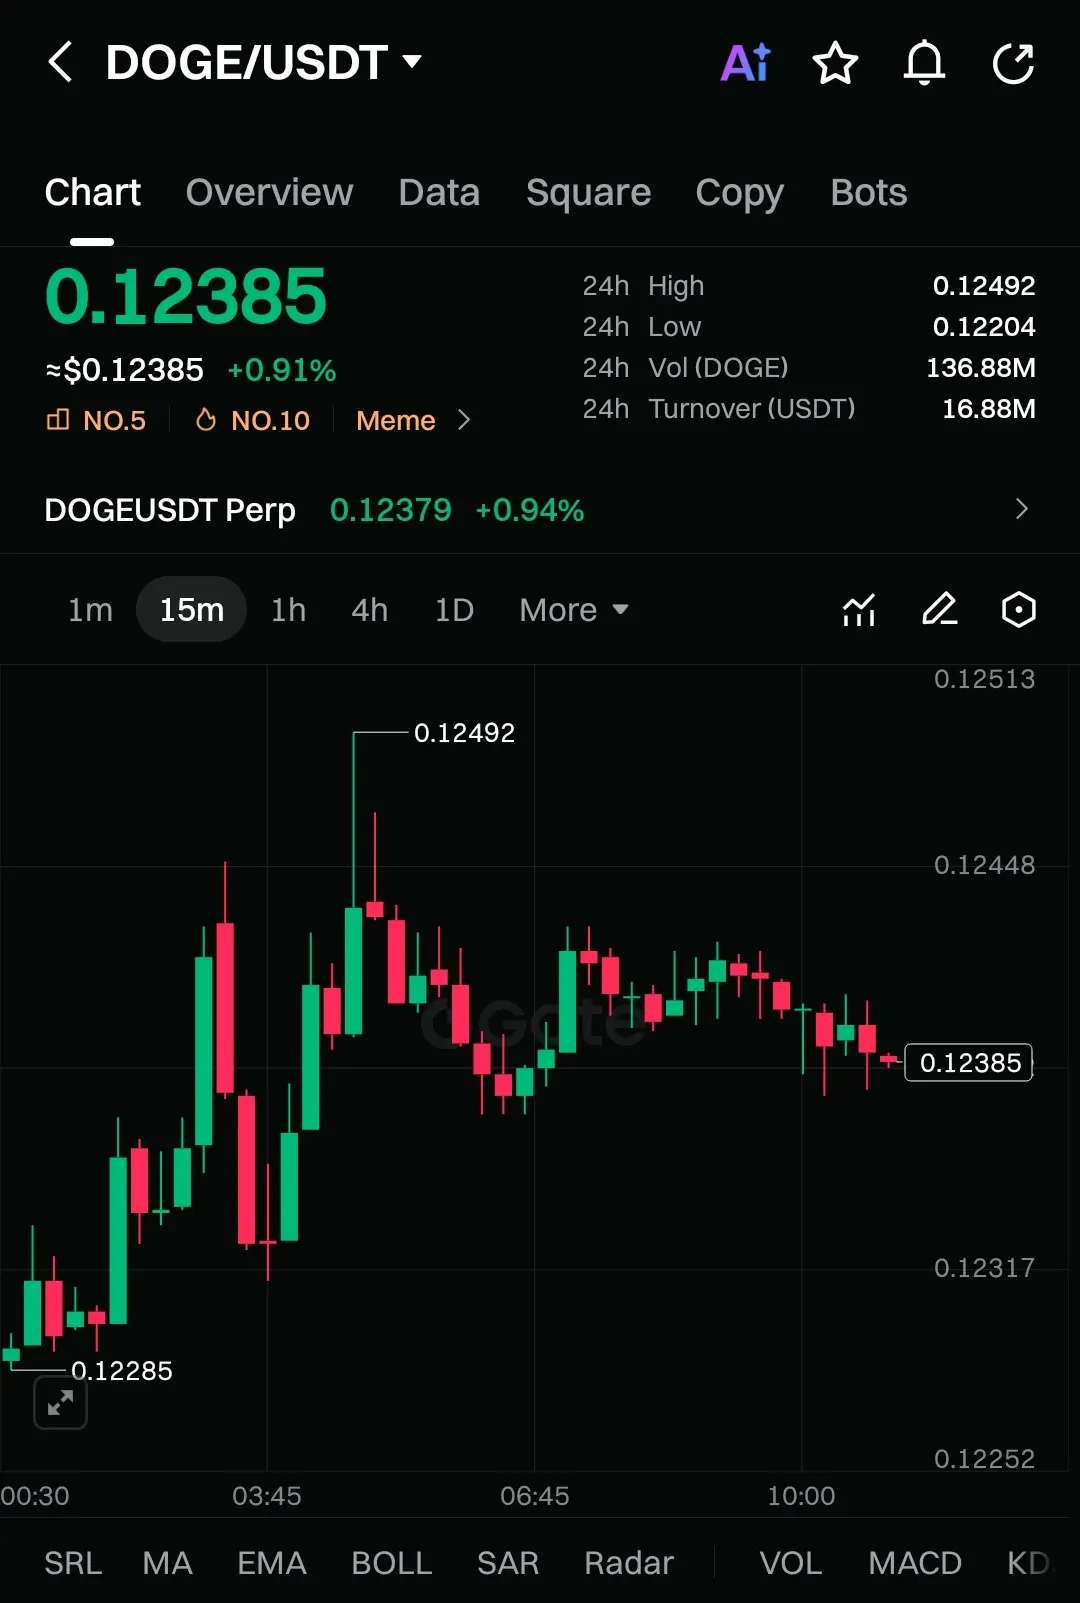
$DOGE /USDT
$DOGE is currently trading around 0.1238, showing steady bullish strength with price holding above the intraday support. After a clean bounce from ~0.1228, the market has shifted into tight consolidation, which often precedes an expansion move.
On the 1H timeframe, candles are stabilizing above key demand, suggesting buyers are quietly stepping in. Momentum is building — patience here can pay.
Trade Setup (Long Bias)
• Entry Zone: 0.1230 – 0.1240
• Target 1 🎯: 0.1255
• Target 2 🎯: 0.1280
• Target 3 🎯: 0.1320
• Stop Loss: 0.1215
Market Insight
Price is respecting higher lows
Vo
DOGE7,35%
- Reward
- like
- Comment
- Repost
- Share
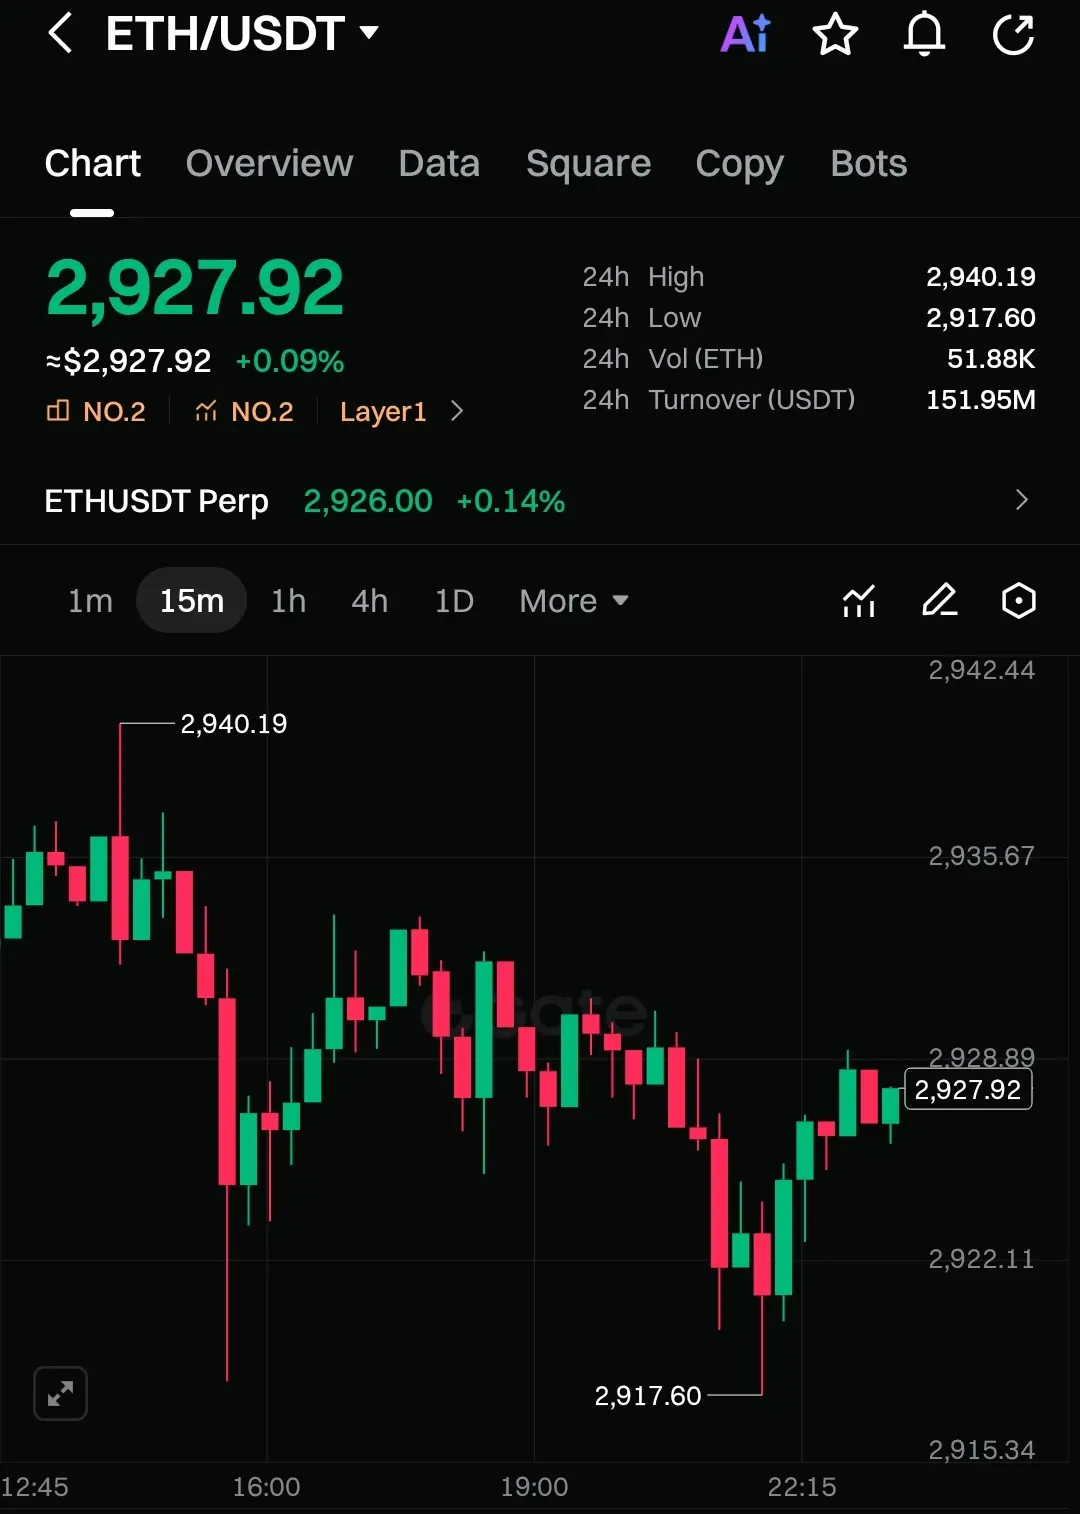
$ETH
Current price is showing steady strength around 2,927 USDT, with mild positive change over the last 24 hours. After a sharp dip to ~2,917 followed by a clean bounce, price is now consolidating — a classic base-building phase before the next impulse.
On the 1H timeframe, we can see higher lows forming after the bounce, indicating buyers are stepping in. Momentum is slowly shifting bullish, but confirmation comes only on a clean breakout with volume.
---
📊 Market Structure Insight
Key Support Zone: 2,915 – 2,920
Immediate Resistance: 2,940 – 2,950
Price is compressing → volatility expan
ETH8,55%
- Reward
- like
- Comment
- Repost
- Share
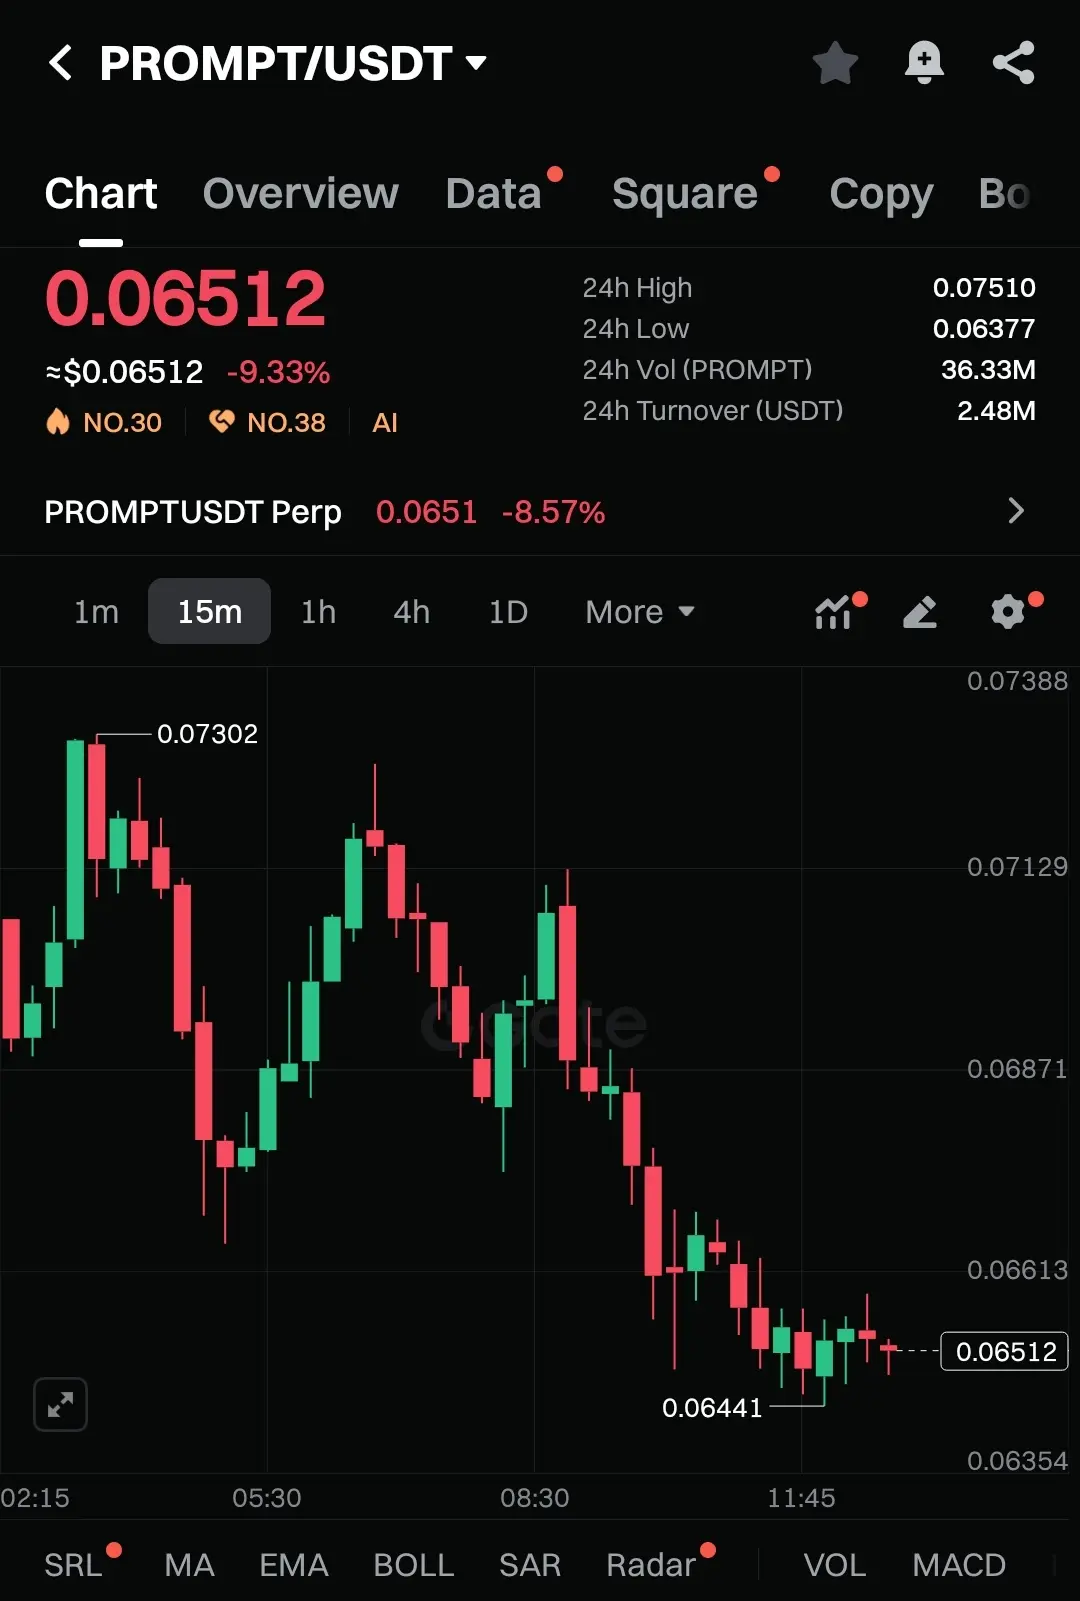
$PROMPT /USDT
Based on the chart you shared, PROMPT is clearly under distribution, not accumulation.
Market Context
Current Price: ~0.0651
24H Change: ~-9%
Price is making lower highs & lower lows
Weak bounces → sellers defending every push
Structure shifted bearish after rejection near 0.071–0.073
The recent move looks like a bear flag / dead-cat bounce
On the 15M–1H timeframe, bearish candles dominate, momentum is still pointing down, and volume doesn’t support a strong reversal yet.
Bearish Trade Setup (Short Bias)
Entry Zone (Short)
0.0658 – 0.0665
(Into minor pullback / liquidity grab
PROMPT4,86%
- Reward
- like
- Comment
- Repost
- Share
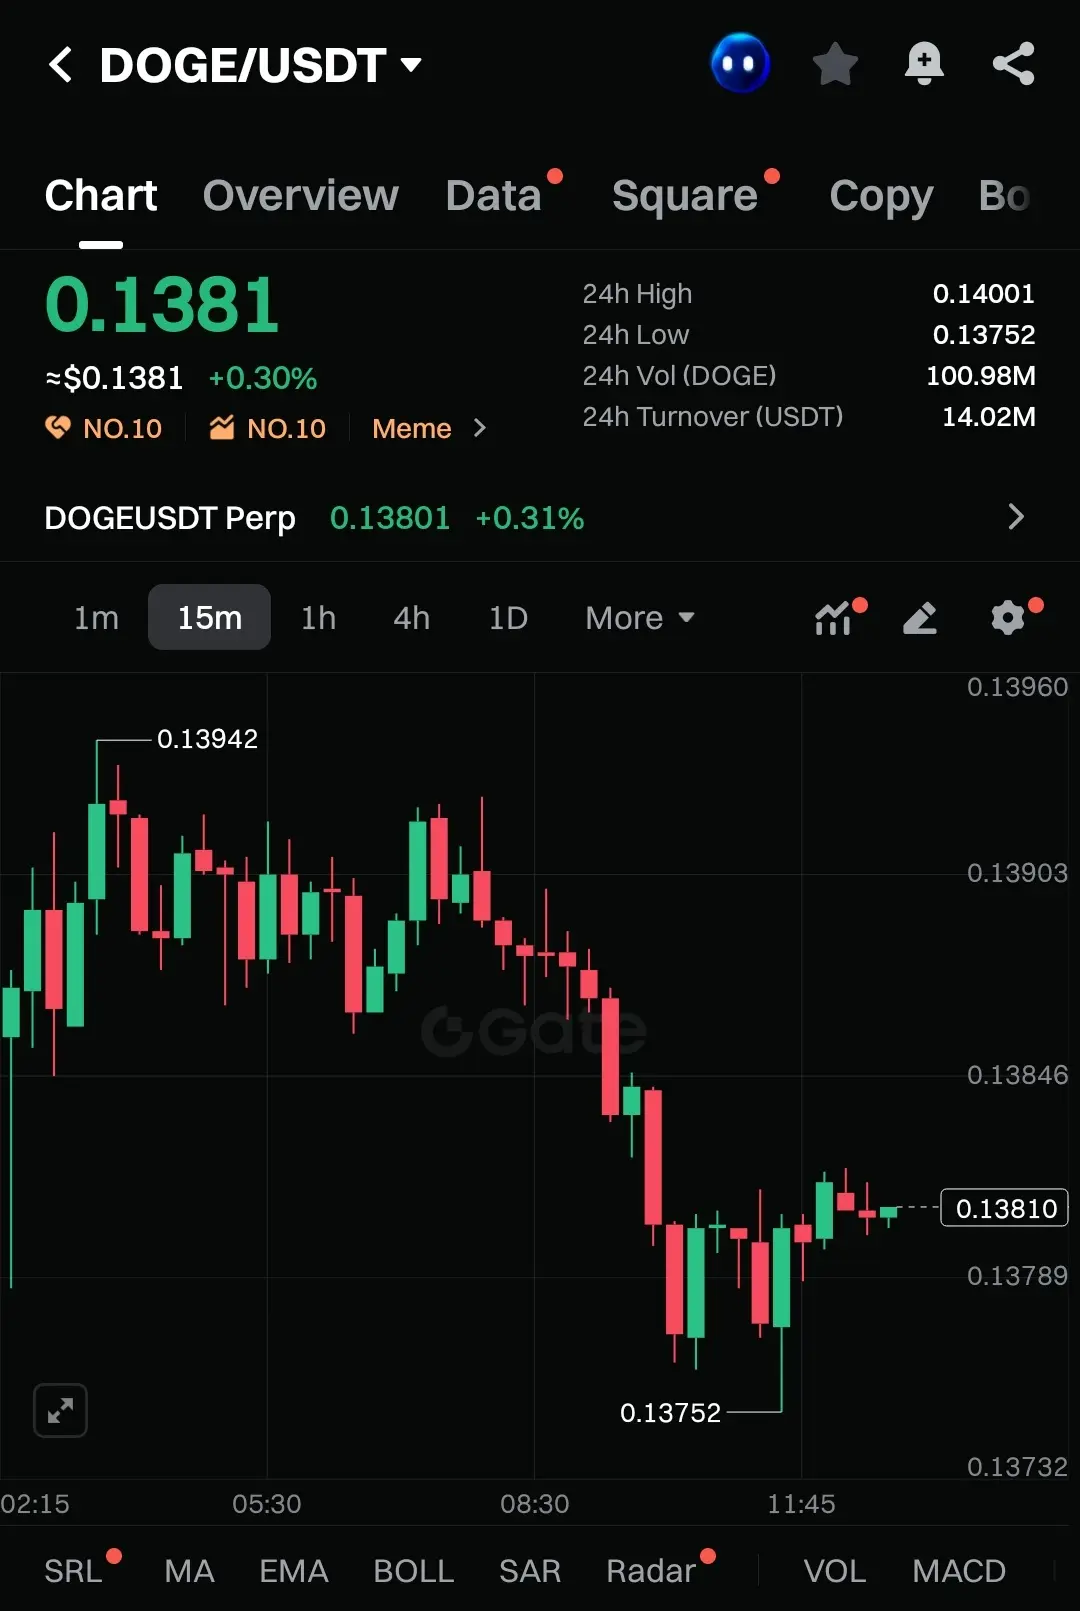
$DOGE /USDT
Based on the chart you shared:
Token: DOGE/USDT
Current Price: ~0.1381
24H Change: ~+0.30%
Structure: Short-term dip → strong support bounce → consolidation
Market Read
Price dipped into the 0.1375 zone and reacted cleanly (clear demand).
Selling pressure slowed down, and candles are getting tighter → compression before move.
This looks like a base-building phase, not a breakdown.
As long as 0.1375 holds, bulls remain in control.
🎯 Trade Setup (Scalp → Intraday)
Entry Zone:
0.1378 – 0.1382
Targets:
Target 1 🎯: 0.1395
Target 2 🎯: 0.1410
Target 3 🎯: 0.1430
Stop Loss:
0.1368
DOGE7,35%
- Reward
- like
- Comment
- Repost
- Share
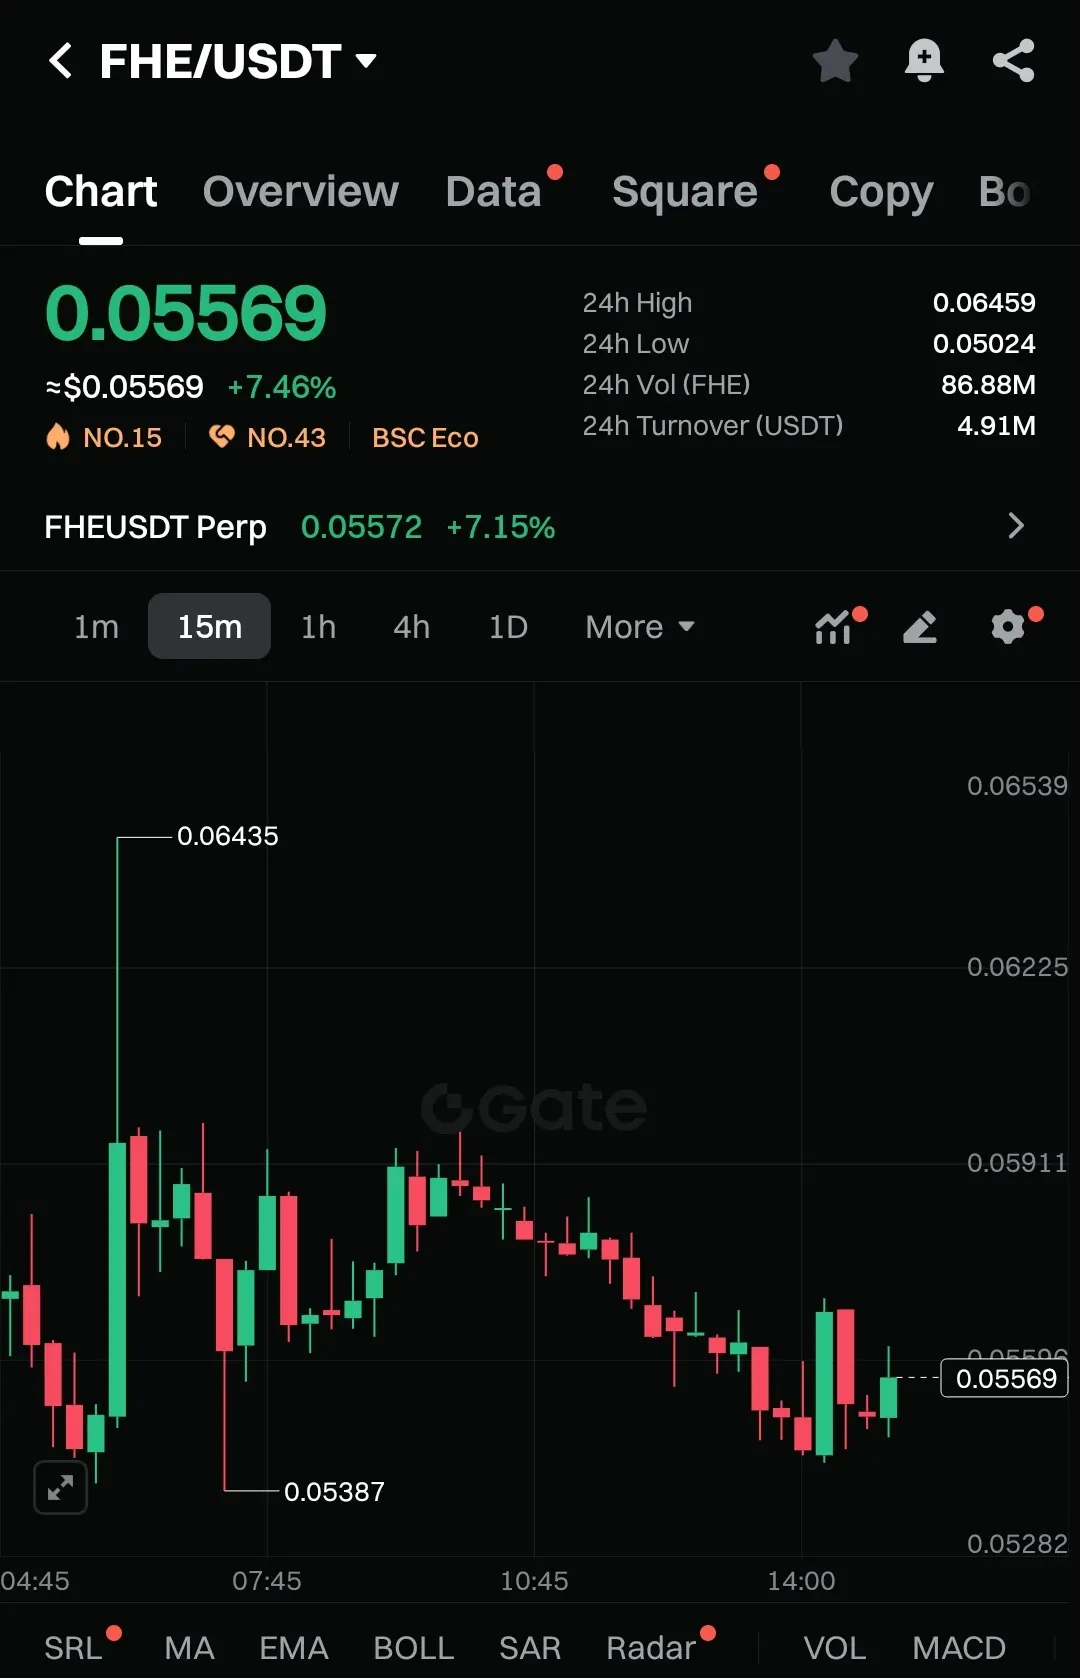
$FHE /USDT
$FHE is currently trading around $0.05569, showing solid volatility with a +7.46% change in the last 24 hours. After the recent pullback from the $0.06459 high, the chart is now showing mixed signals — momentum slowing down but with sudden bullish pushes trying to reclaim levels.
On the 15m and 1H timeframes, bearish candles previously dominated, but we’re now seeing small signs of buyers stepping back in. If momentum strengthens, the structure can flip bullish quickly — otherwise, another dip may be on the way.
Trade Setup (Short-Term Idea)
Entry Zone: $0.05450 – $0.05600
Targets
FHE0,92%
- Reward
- like
- Comment
- Repost
- Share
$DOGE /USDT
Current price is $0.14153, showing visible volatility after a recent mini-rally from $0.13942 to $0.14242. Price is now cooling off near the resistance, which could trigger either a pullback or a renewed breakout depending on volume.
On the 15m–1H timeframes, candles are getting heavier, and momentum is slowing down, which hints at a possible short-term correction unless strong buyers step in.
Trade Setup (Short-Term)
Entry Zone: $0.14050 – $0.14120
Target 1 🎯: $0.14220
Target 2 🎯: $0.14310
Target 3 🎯: $0.14500
Stop Loss: $0.13950
Bullish Scenario
If DOGE breaks above $0.142
DOGE7,35%
- Reward
- like
- Comment
- Repost
- Share
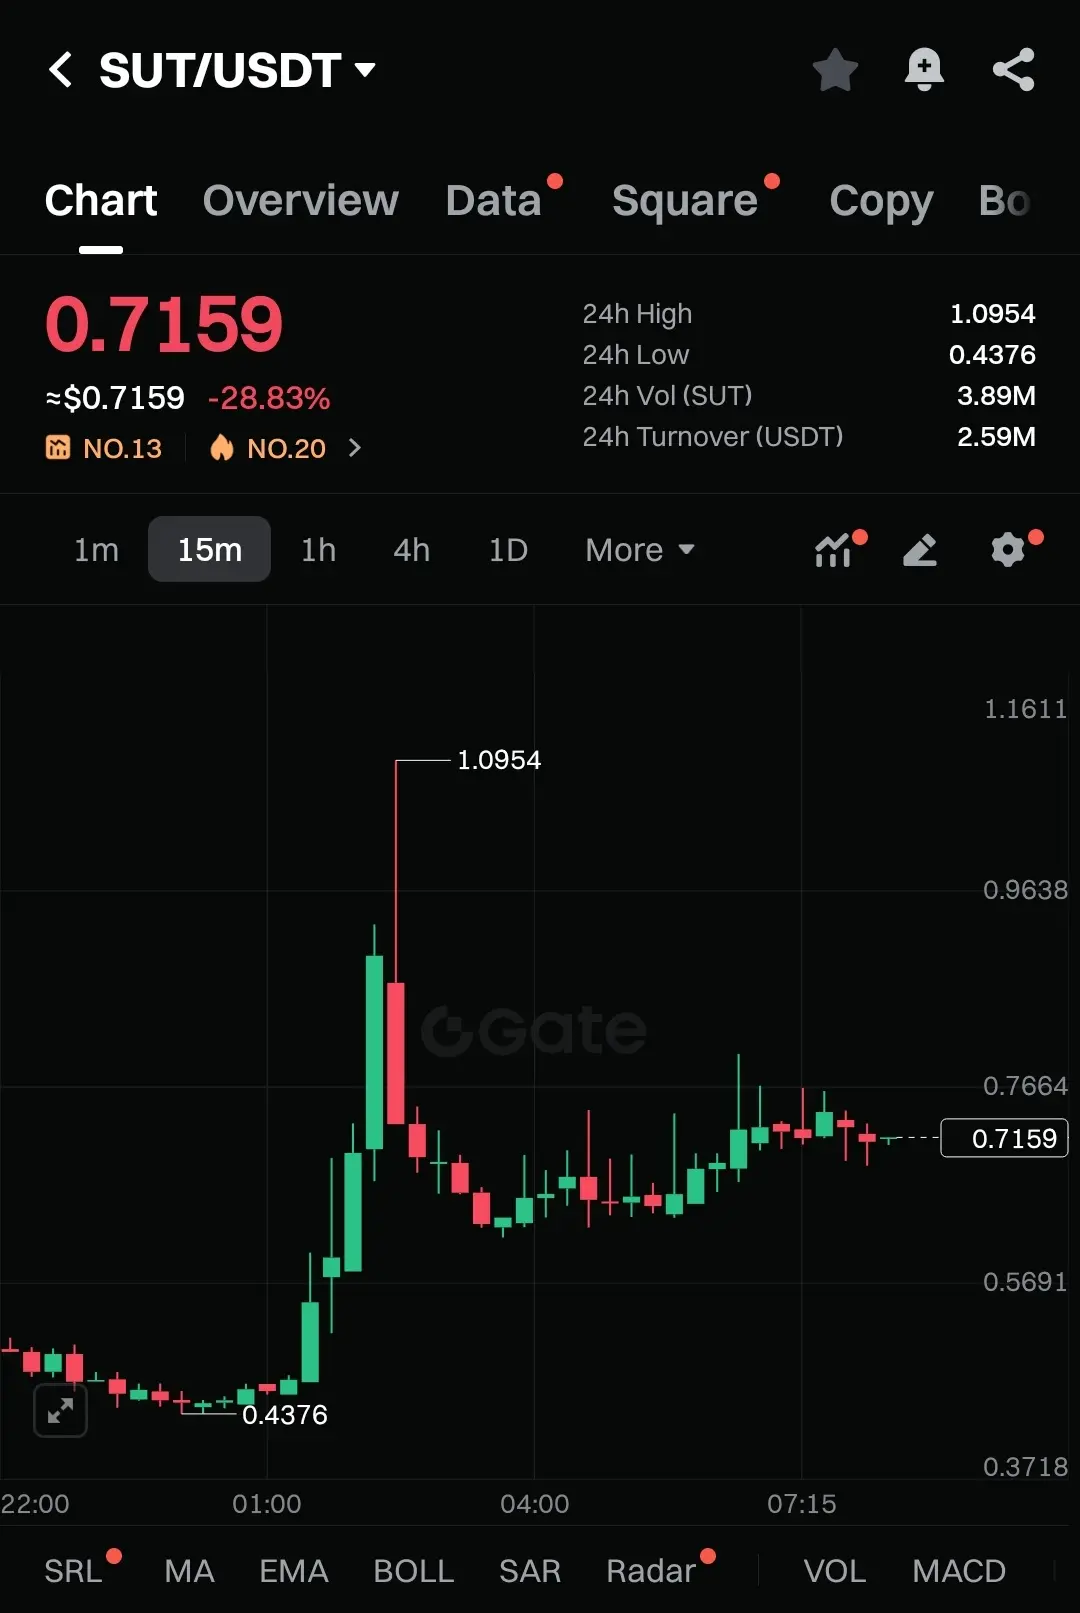
$SUT /USDT
The current price sits around $0.7159, down ~28.8% in the last 24 hours. After a violent spike to $1.0954 and a rapid sell-off, the chart is showing short-term bearish exhaustion but not yet a confirmed reversal.
On the 15m to 1H timeframes, price action is struggling to reclaim $0.7664, and candles show tightening volatility. This usually comes before either:
A continuation of the downtrend, or
A relief bounce off support
We’re currently closer to support than resistance, meaning risk-to-reward favors cautious entries, not chasing breakouts.
Trade Setup (Short-Term)
Potential Ent
SUT11,16%
- Reward
- like
- Comment
- Repost
- Share
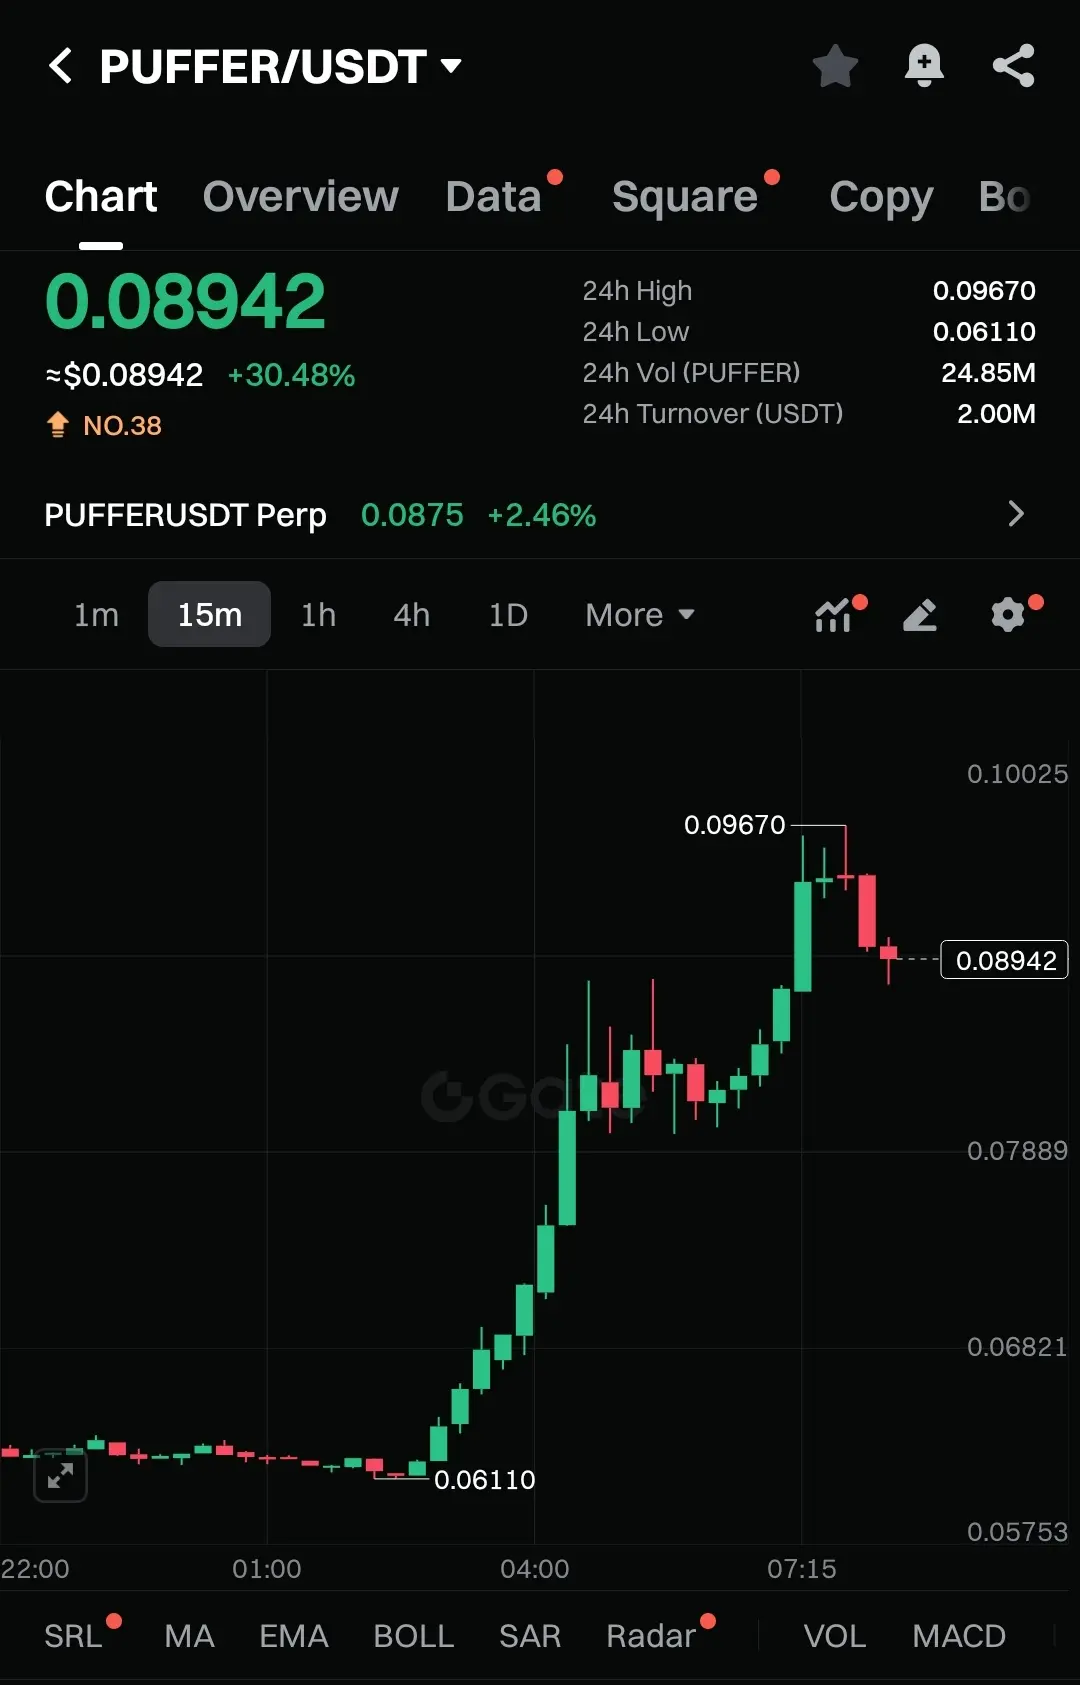
$PUFFER /USDT
Current price is ≈ $0.08942 (+30.48%) in the last 24 hours. After a strong bounce from $0.06110, the structure is shifting bullish with higher lows and expanding volume. On the 1H timeframe, bullish candles are forming, showing momentum building up and buyers stepping in with confidence.
Trade Setup (Short-Term Momentum)
• Entry Zone: $0.08650 – $0.08900
A healthy dip region where buyers may reload.
• Target 1 🎯: $0.09500
• Target 2 🎯: $0.09980 – $0.10000
• Target 3 🎯: $0.10600 – $0.10800
• Stop Loss: $0.08150 – $0.08200
(Below previous breakout support zone.)
How the Struct
PUFFER6,93%
- Reward
- like
- Comment
- Repost
- Share
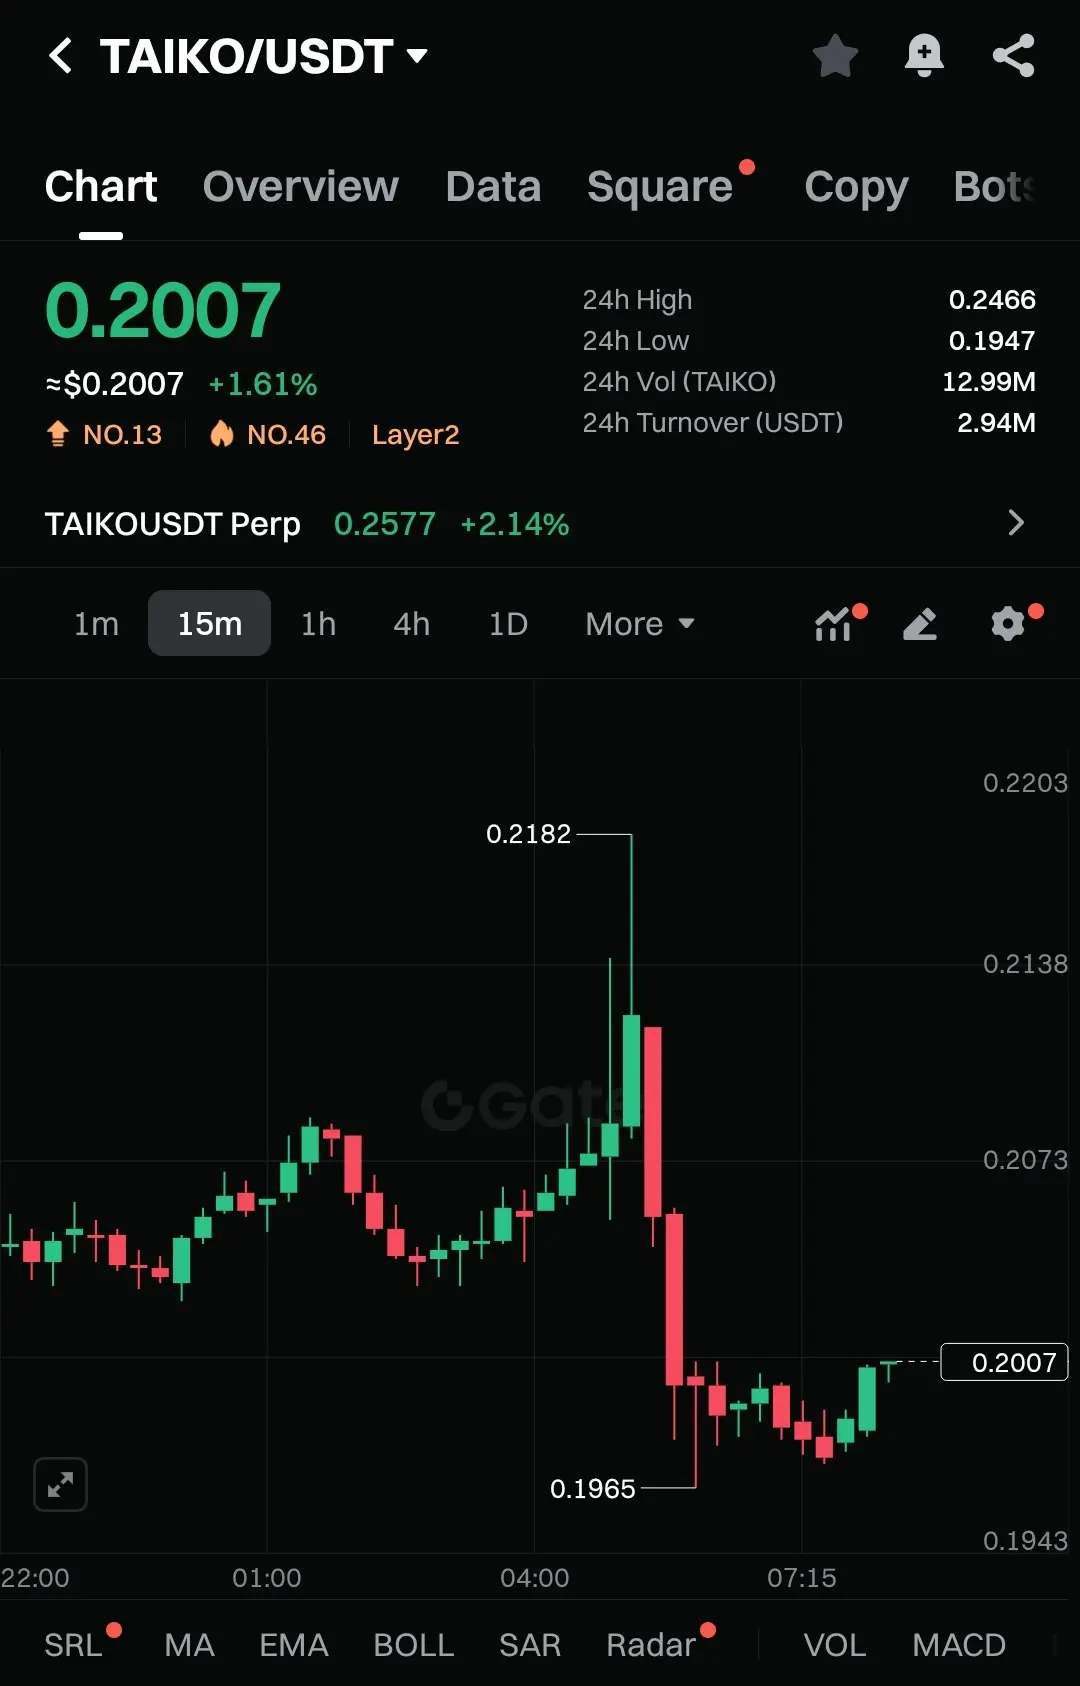
$TAIKO /USDT
Current price: $0.2007 showing short-term recovery after a fast intraday sell-off. After the recent bounce from $0.1965, the chart is stabilizing and building momentum again on lower timeframes. On the 1H, bullish candles are beginning to appear, suggesting accumulation after volatility.
Trade Setup
Entry Zone
$0.1990 – $0.2030
This zone captures pullbacks and micro-structure retests without chasing.
Targets
🎯 Target 1: $0.2075 (scalp)
🎯 Target 2: $0.2135 (mid-range resistance)
🎯 Target 3: $0.2185 (breakout test zone / previous high)
Stop Loss
$0.1948
Below structural suppo
TAIKO6,75%
- Reward
- like
- Comment
- Repost
- Share
Trending Topics
View More42.47M Popularity
159.92K Popularity
123.84K Popularity
1.67M Popularity
516.41K Popularity
Pin