Trade
Basic
Futures
Futures
Hundreds of contracts settled in USDT or BTC
TradFi
Gold
Trade global traditional assets with USDT in one place
Options
Hot
Trade European-style vanilla options
Unified Account
Maximize your capital efficiency
Demo Trading
Futures Kickoff
Get prepared for your futures trading
Futures Events
Participate in events to win generous rewards
Demo Trading
Use virtual funds to experience risk-free trading
Earn
Launch
CandyDrop
Collect candies to earn airdrops
Launchpool
Quick staking, earn potential new tokens
HODLer Airdrop
Hold GT and get massive airdrops for free
Launchpad
Be early to the next big token project
Alpha Points
Trade on-chain assets and enjoy airdrop rewards!
Futures Points
Earn futures points and claim airdrop rewards
Investment
Simple Earn
Earn interests with idle tokens
Auto-Invest
Auto-invest on a regular basis
Dual Investment
Buy low and sell high to take profits from price fluctuations
Soft Staking
Earn rewards with flexible staking
Crypto Loan
0 Fees
Pledge one crypto to borrow another
Lending Center
One-stop lending hub
VIP Wealth Hub
Customized wealth management empowers your assets growth
Private Wealth Management
Customized asset management to grow your digital assets
Quant Fund
Top asset management team helps you profit without hassle
Staking
Stake cryptos to earn in PoS products
Smart Leverage
New
No forced liquidation before maturity, worry-free leveraged gains
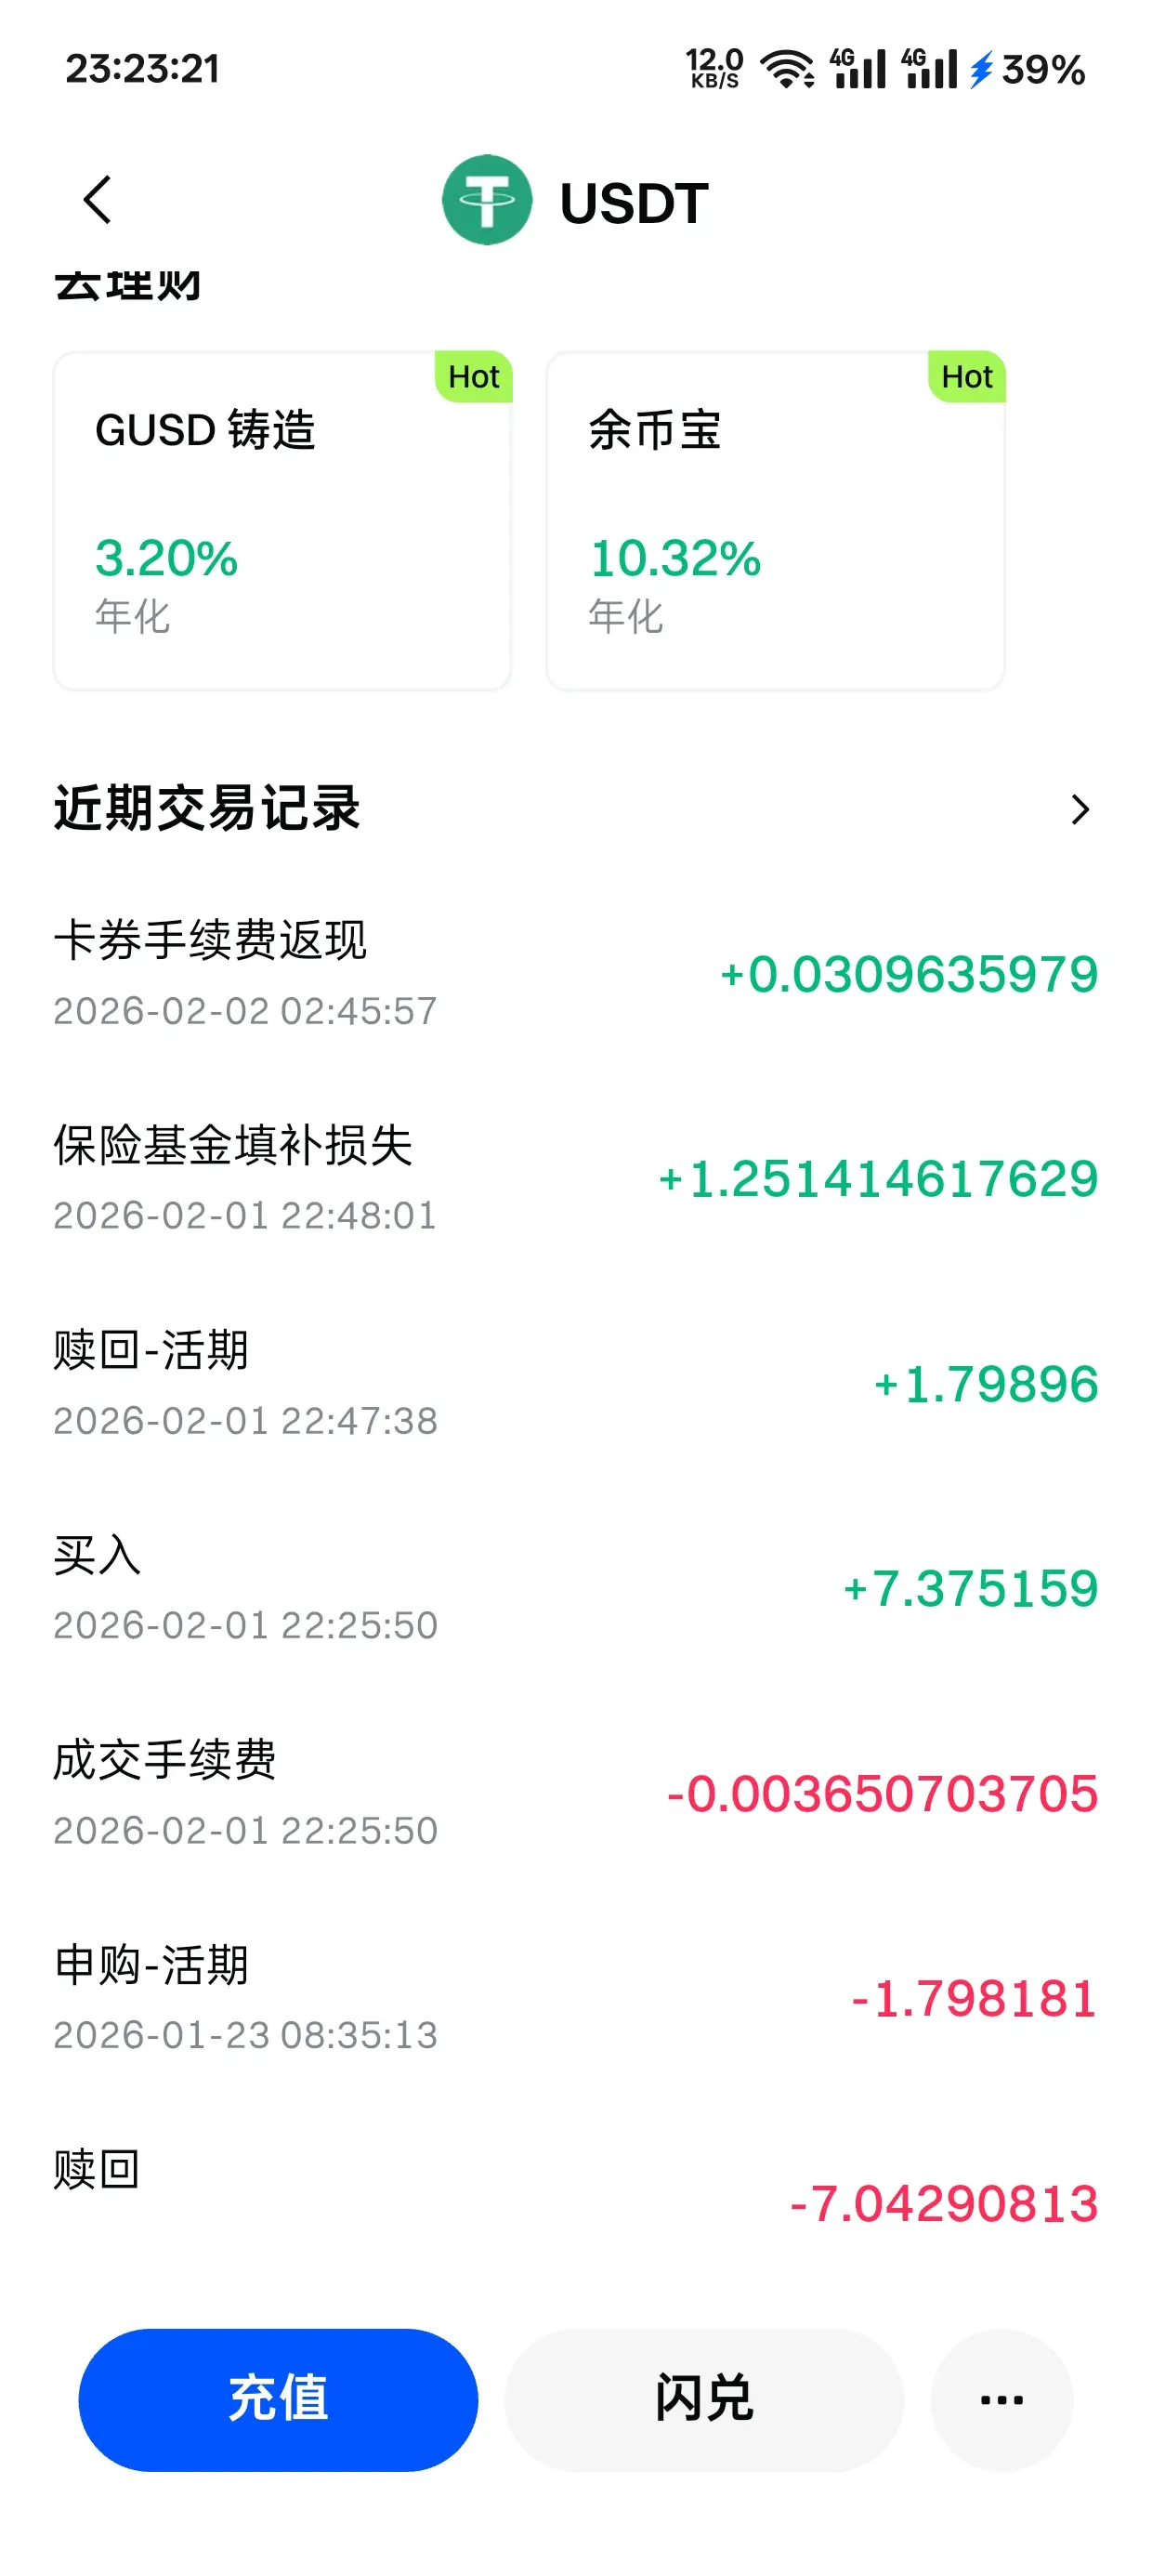
GUSD Minting
Use USDT/USDC to mint GUSD for treasury-level yields
More
TheStrongestKing555
‼️ Second order⬇️
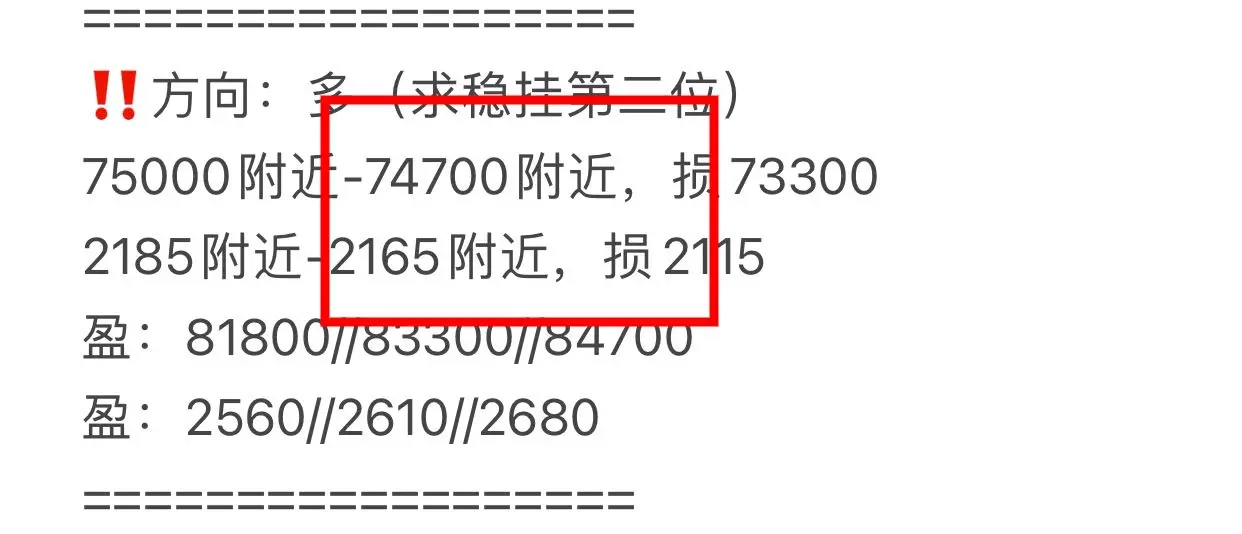
‼️ Direction: Long
Near 76250 - Near 75950, Loss at 74550
Near 2285 - Near 2265, Loss at 2215
Profit: 78200//80000//82000
Profit: 2350//2400//2460
#2月Web3节点
View Original‼️ Direction: Long
Near 76250 - Near 75950, Loss at 74550
Near 2285 - Near 2265, Loss at 2215
Profit: 78200//80000//82000
Profit: 2350//2400//2460
#2月Web3节点
- Reward
- like
- 1
- Repost
- Share
GateUser-998a78fc :
:
‼️ Second order⬇️ ‼️ Direction: Long
Near 76250 - Near 75950, Loss at 74550
Near 2285 - Near 2265, Loss at 2215
Profit: 78200//80000//82000
Profit: 2350//2400//2460
#2月Web3节点#
- Reward
- like
- Comment
- Repost
- Share
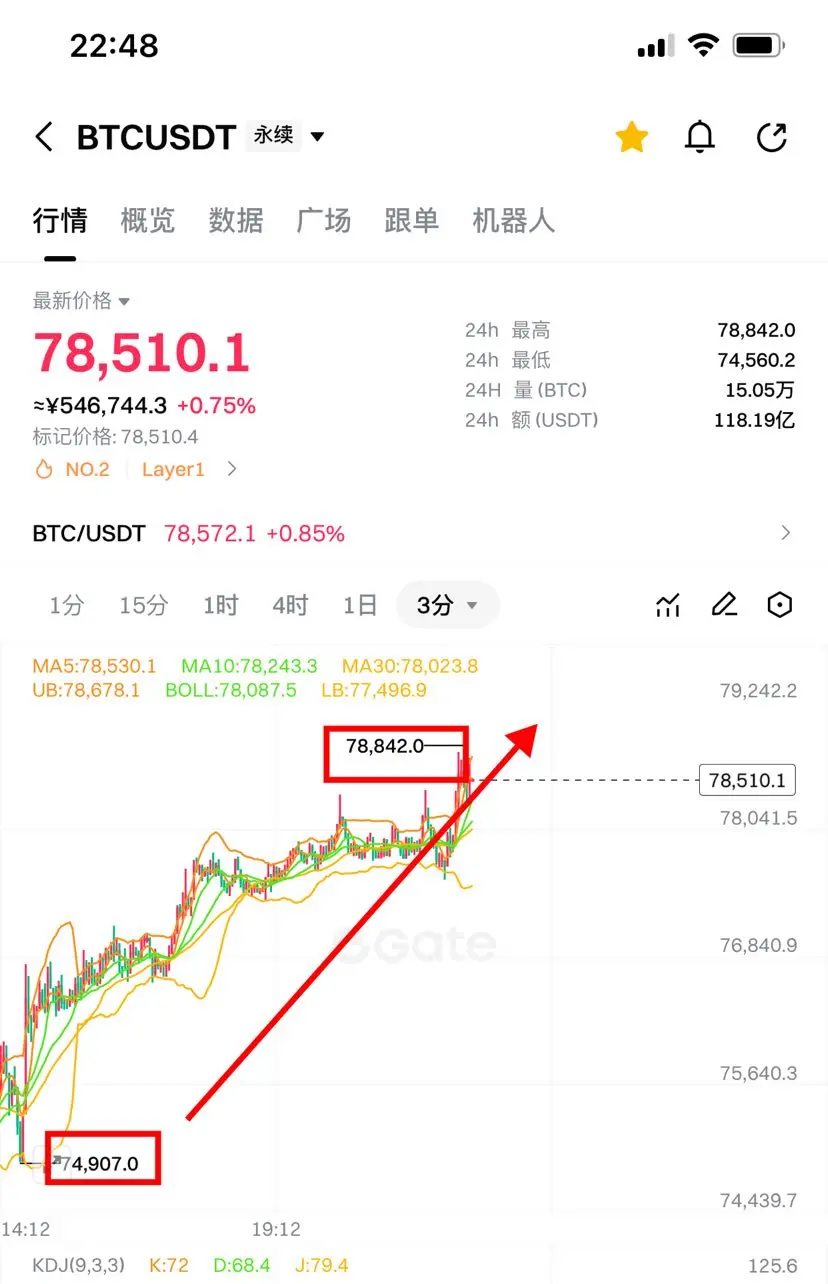
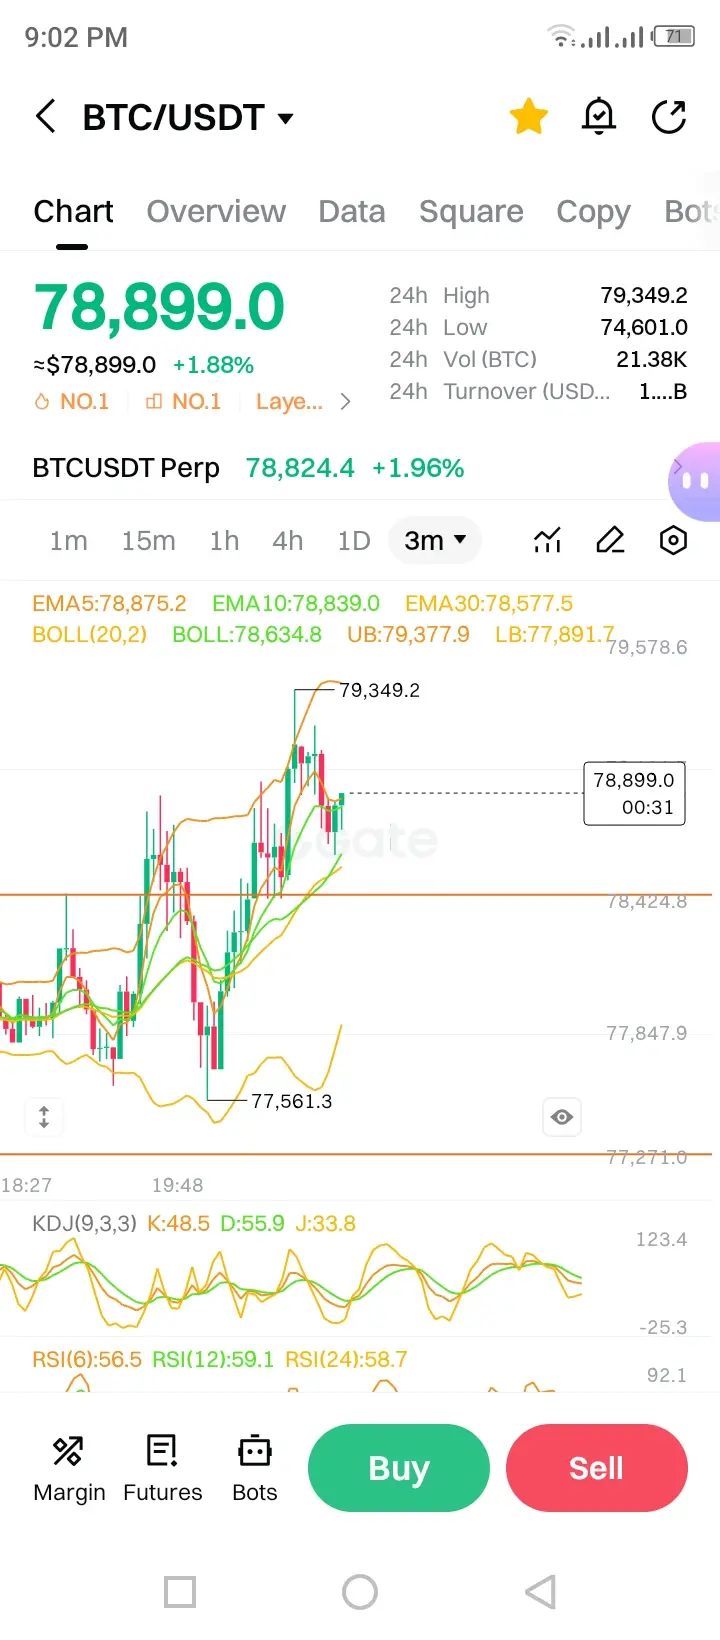
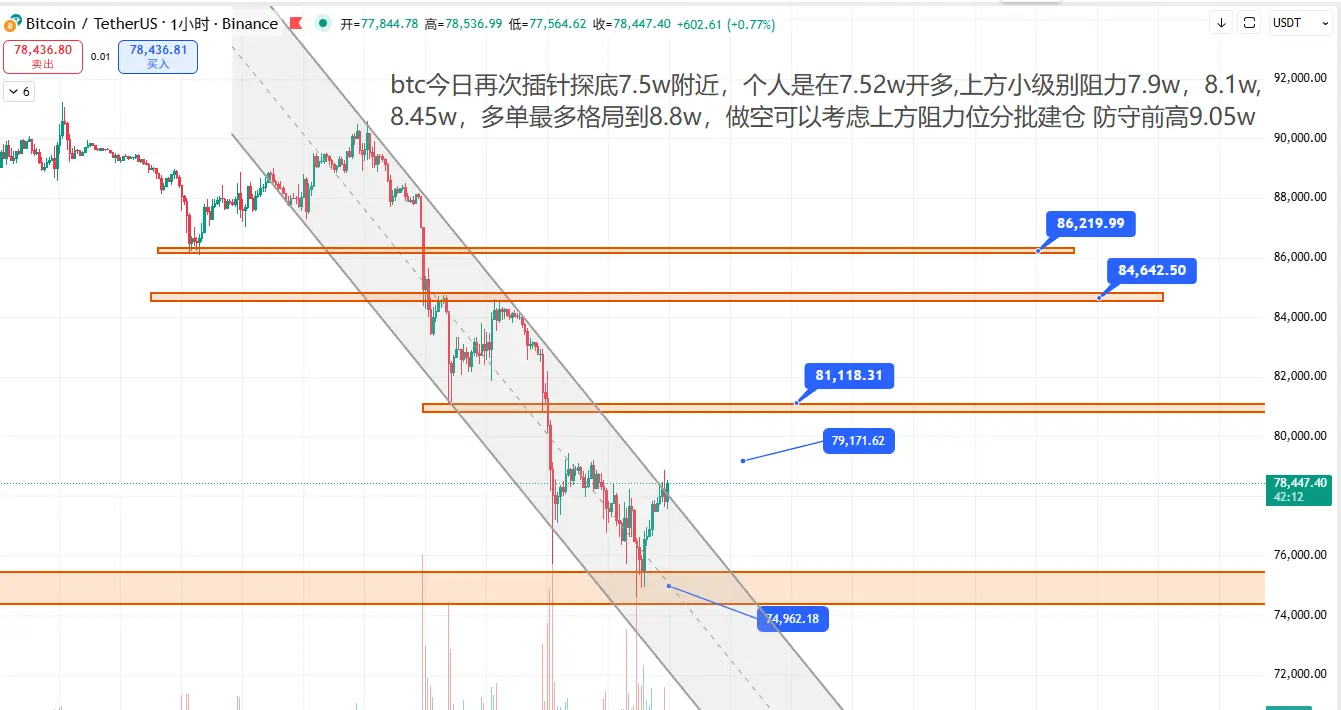
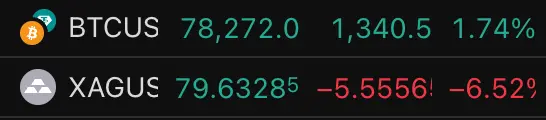
BTC today once again dipped near 75,000, personally opened a long position at 75,200. Minor resistance levels above are at 79,000, 81,000, and 84,500. The maximum upside for longs is around 88,000. For shorts, consider building positions gradually at resistance levels to defend the previous high of 90,500.
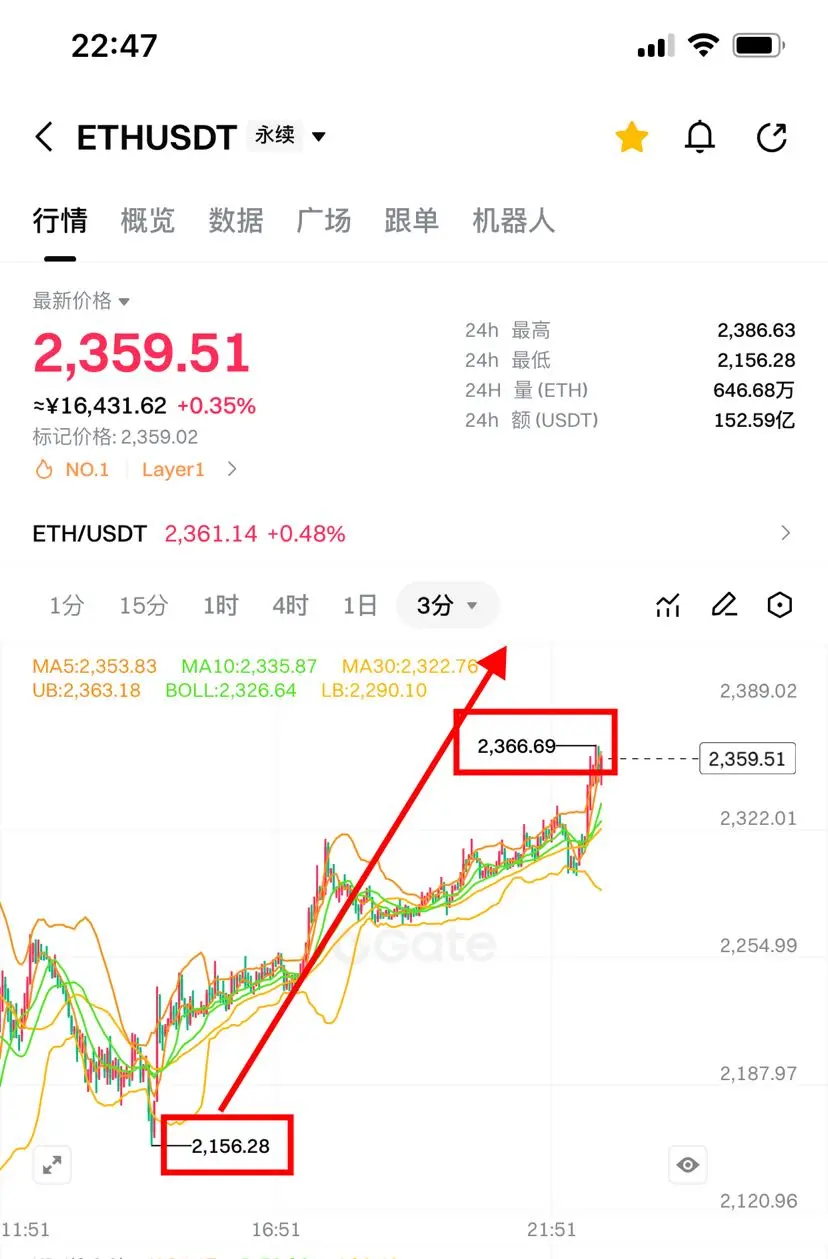
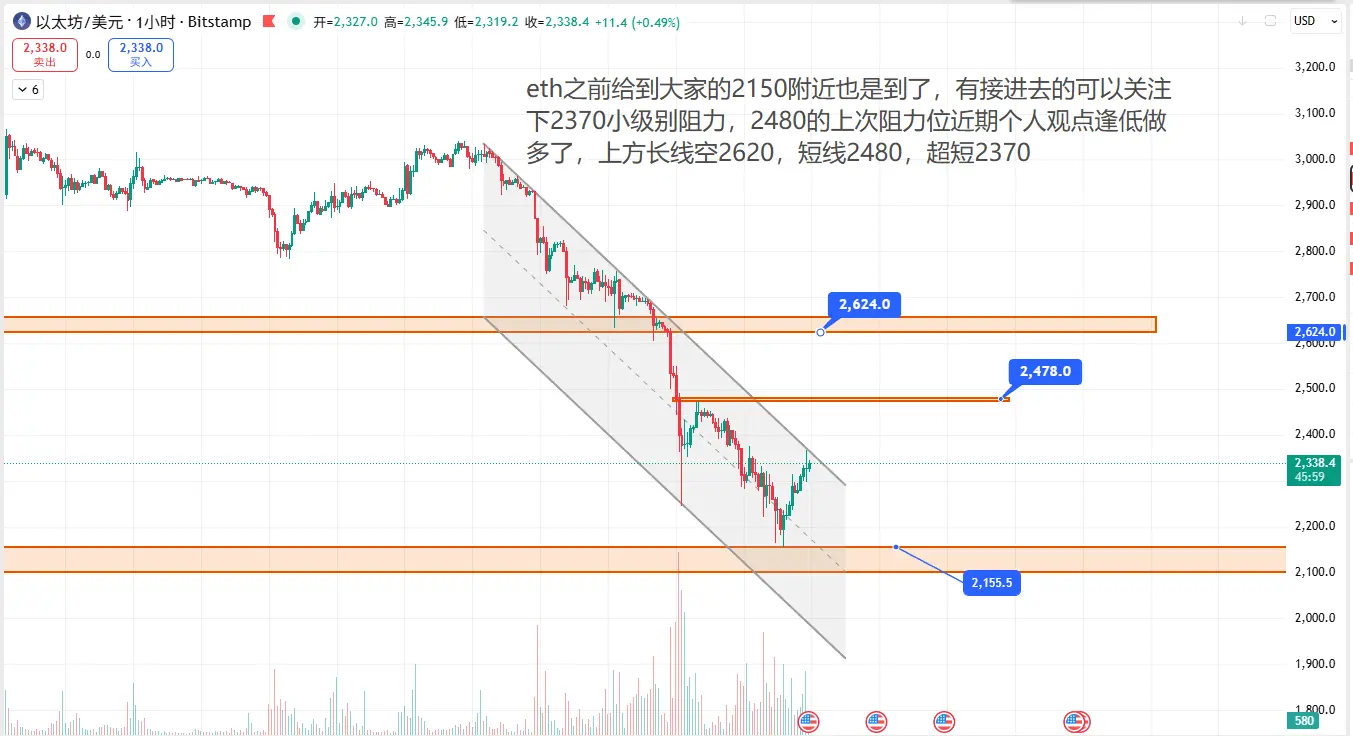
ETH previously reached around 2,150, which was communicated to everyone. Those who entered can watch the minor resistance at 2,370. The previous resistance at 2,480 is a recent personal view to buy on dips. Long-term short target is 2,620, with short-term targets at 2,480 and ultra-short-t
View OriginalETH previously reached around 2,150, which was communicated to everyone. Those who entered can watch the minor resistance at 2,370. The previous resistance at 2,480 is a recent personal view to buy on dips. Long-term short target is 2,620, with short-term targets at 2,480 and ultra-short-t
- Reward
- like
- Comment
- Repost
- Share
B计划
B计划
Created By@TeXiaoPu
Listing Progress
2.60%
MC:
$3.33K
Create My Token
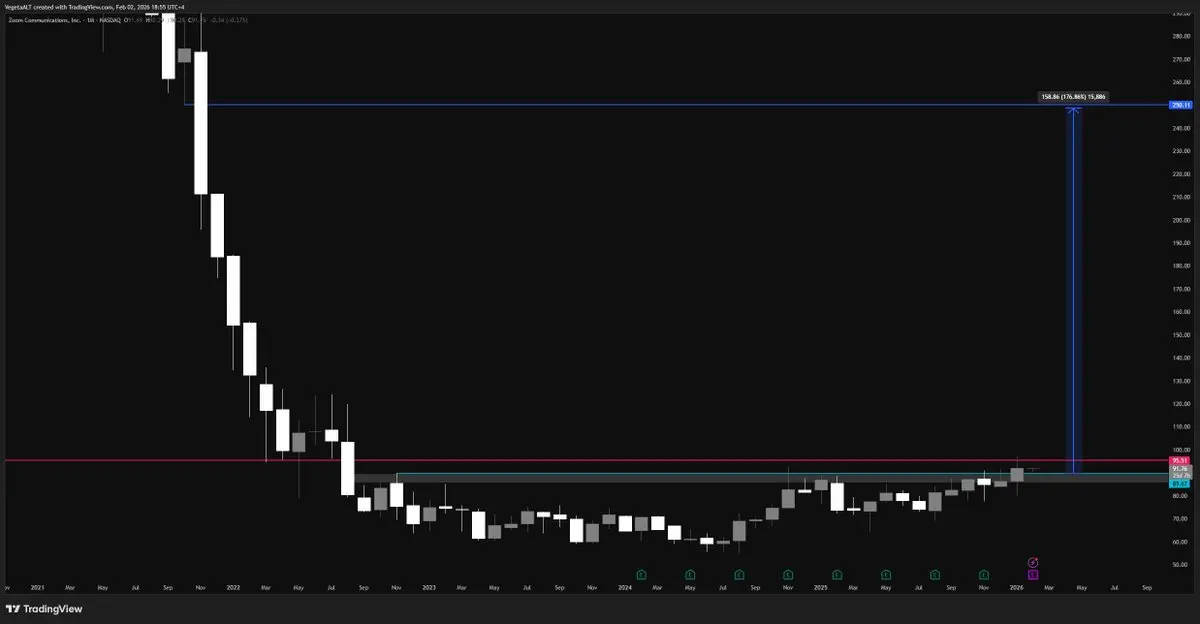
$ZM, lets c how this 1 trades!
- Reward
- like
- Comment
- Repost
- Share
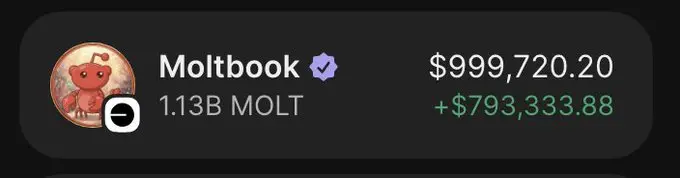
I bought this $molt for $10,000 yesterday and now its worth $1,000,000. Holy fuckThis can be you in exactly 4 hours. 7;00pm UTCDo not fuck this up or regret forever!
- Reward
- like
- Comment
- Repost
- Share
- Reward
- like
- Comment
- Repost
- Share


[Bitcoin price analysis] Live Trade Signals
911
- Reward
- like
- Comment
- Repost
- Share
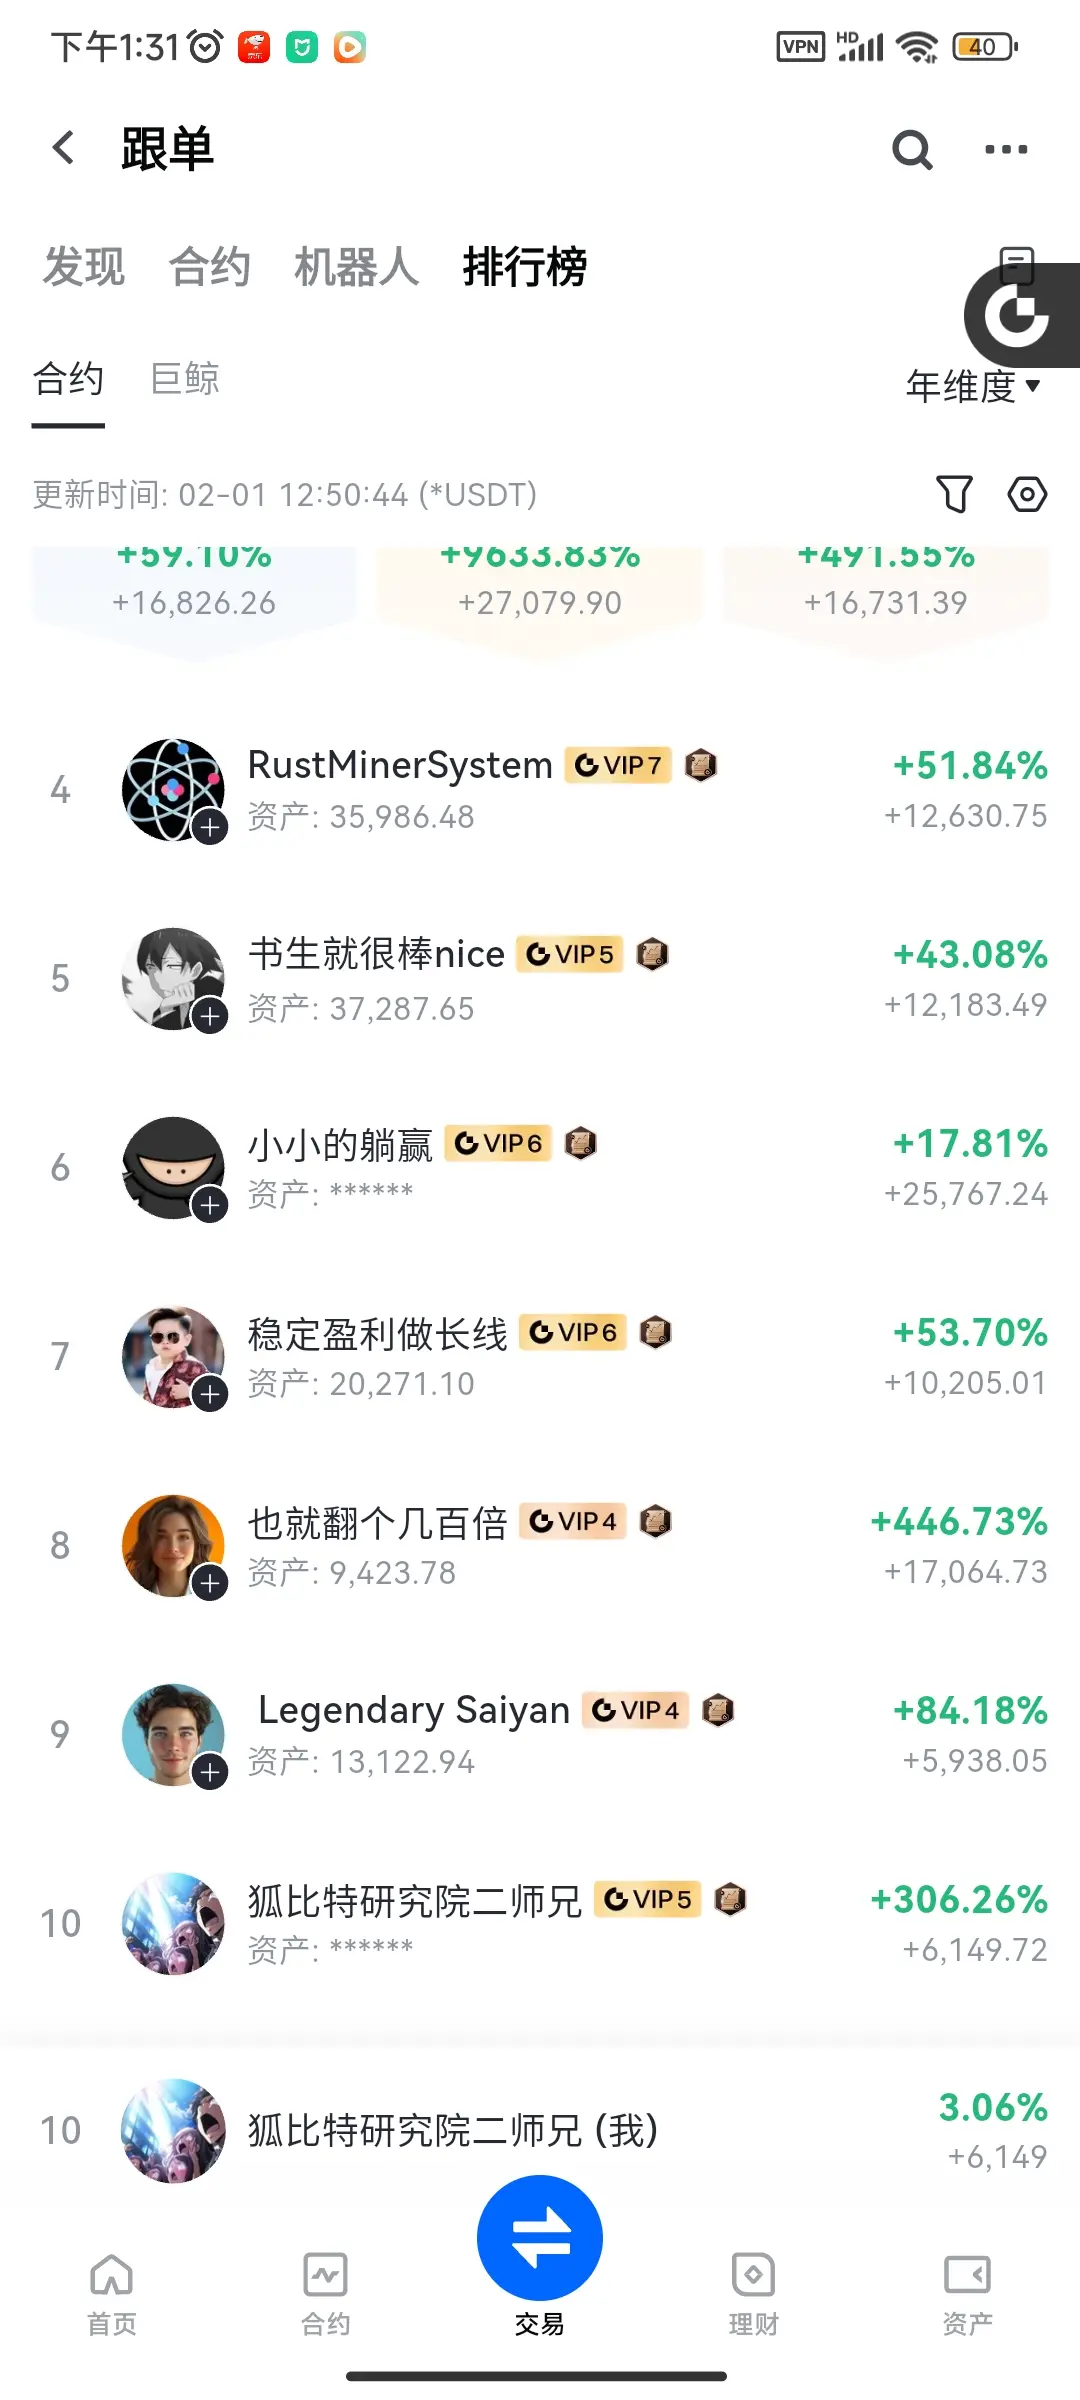
#Trader Says Gate Plaza
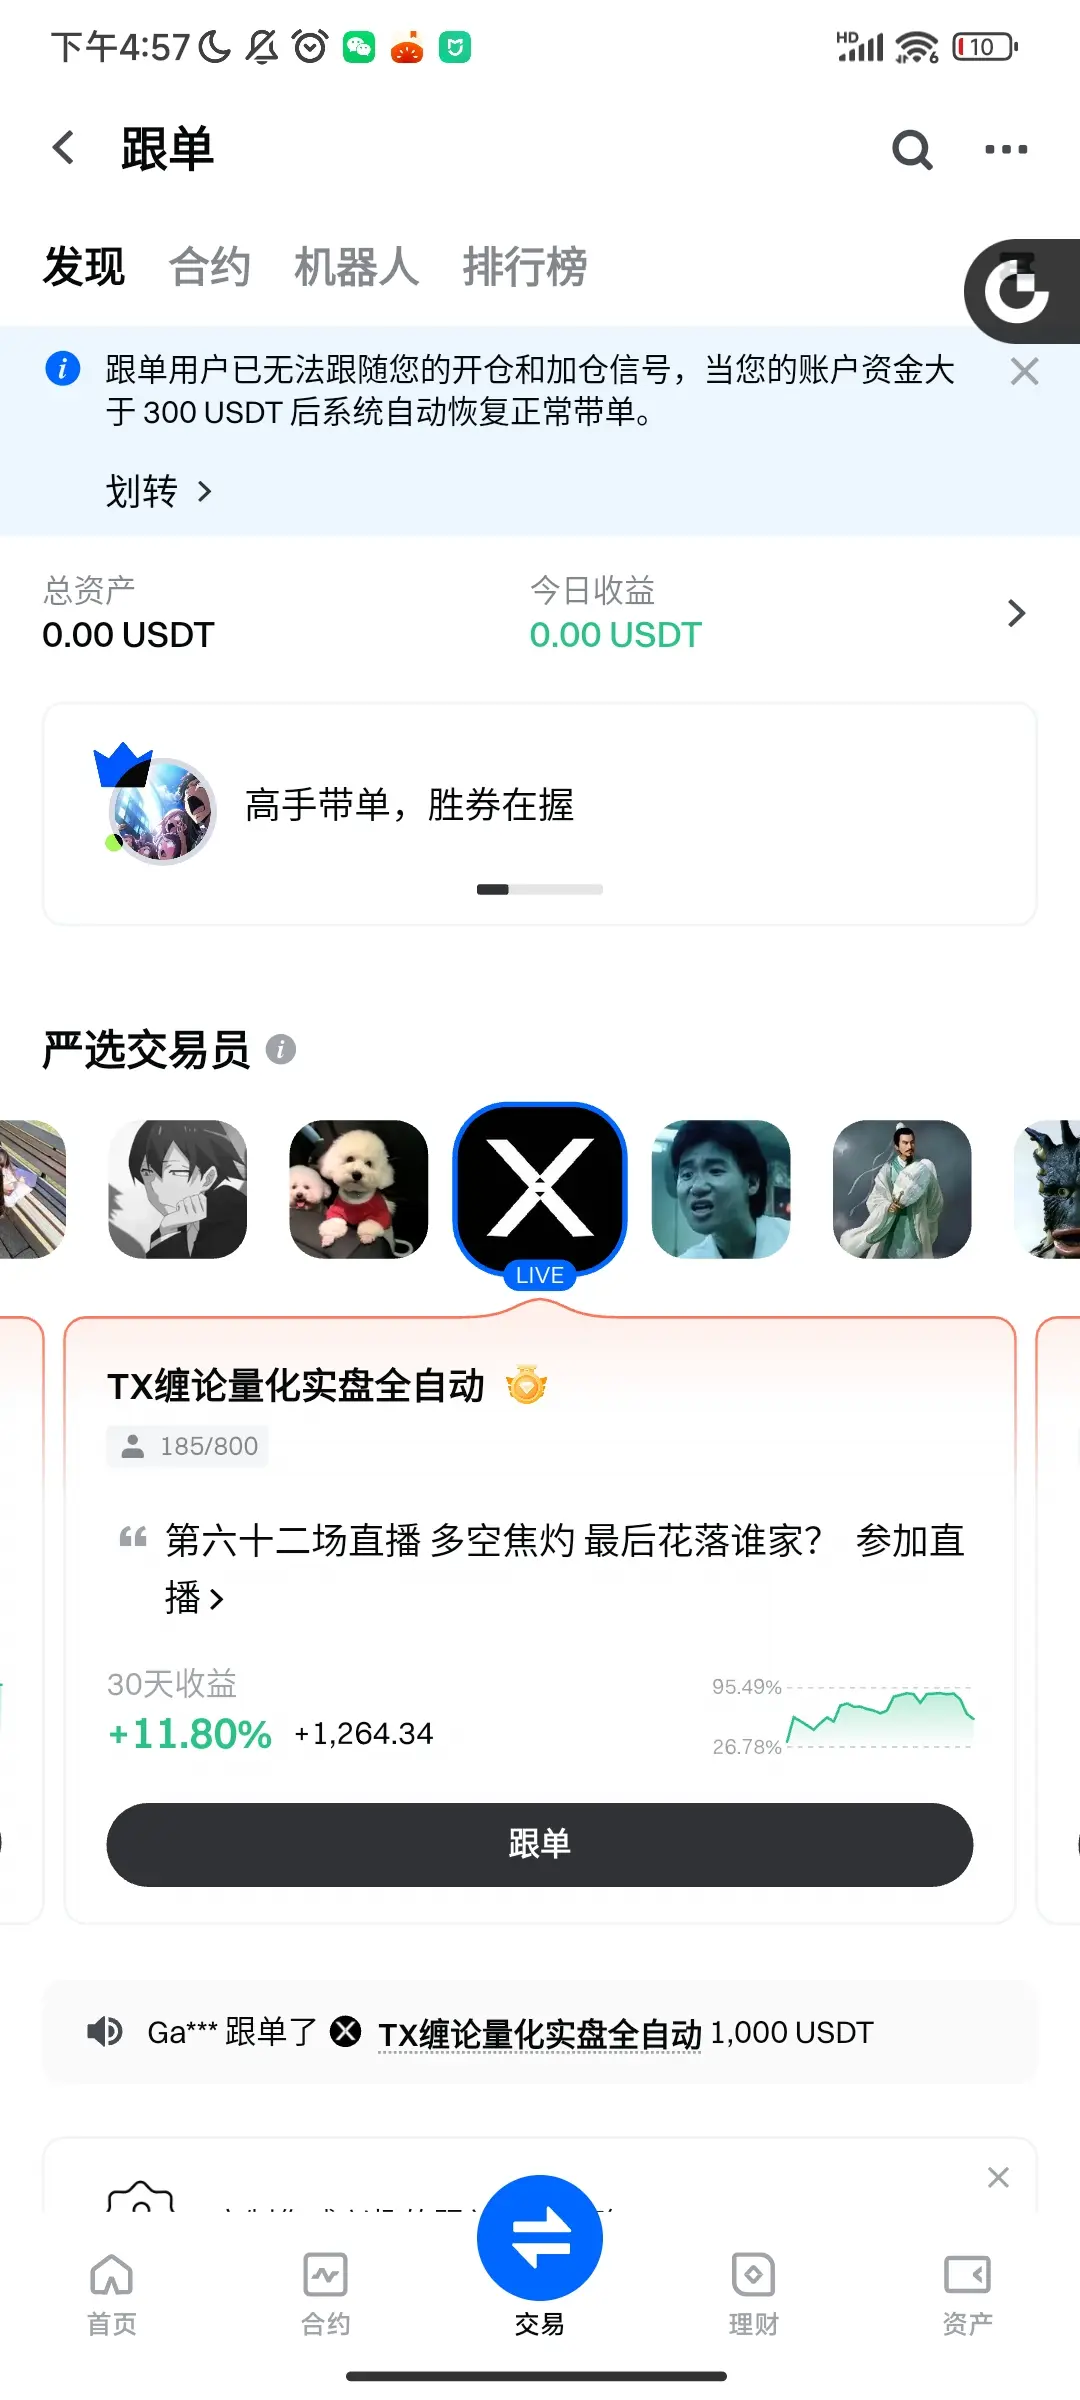
Follow-up trader interview incoming! We will interview several traders with excellent profit rates and share their experiences recording trades on the plaza.
Today, we have TX, who shared their trading experience with RIVER, achieving a profit of 10,000 USDT through fully automated quantitative trading on Gate Plaza. Let's hear their insights on recording trades using Gate Plaza!
More about star traders
https://www.gate.com/zh/announcements/article/49427
View Original

- Reward
- 4
- 5
- Repost
- Share
WhatTheFvck :
:
New Year Wealth Explosion 🤑View More
#WhaleActivityWatch
In the dynamic world of crypto markets as of February 2, 2026, whale activity that is, the transactions and strategic moves of large holders is once again a focal point for traders, analysts, and institutional investors alike. In an era where macro volatility, shifting monetary policy, and on‑chain dynamics blend with deep liquidity flows, watching whale behavior has become essential for reading sentiment, potential trend changes, and broader market balance. The hashtag #WhaleActivityWatch captures this strategic lens, offering a way to interpret what the so‑called “smart
In the dynamic world of crypto markets as of February 2, 2026, whale activity that is, the transactions and strategic moves of large holders is once again a focal point for traders, analysts, and institutional investors alike. In an era where macro volatility, shifting monetary policy, and on‑chain dynamics blend with deep liquidity flows, watching whale behavior has become essential for reading sentiment, potential trend changes, and broader market balance. The hashtag #WhaleActivityWatch captures this strategic lens, offering a way to interpret what the so‑called “smart

- Reward
- 6
- 16
- Repost
- Share
Falcon_Official :
:
amazing contentView More
Hey @grok remove the pedophiles
- Reward
- like
- Comment
- Repost
- Share
孔子
孔子
Created By@PiggyFromTheOcean
Listing Progress
100.00%
MC:
$46.68K
Create My Token
- Reward
- like
- 2
- Repost
- Share
MarketManipulatorNemesisTen:
You're doing great! Keep it up! 👏View More
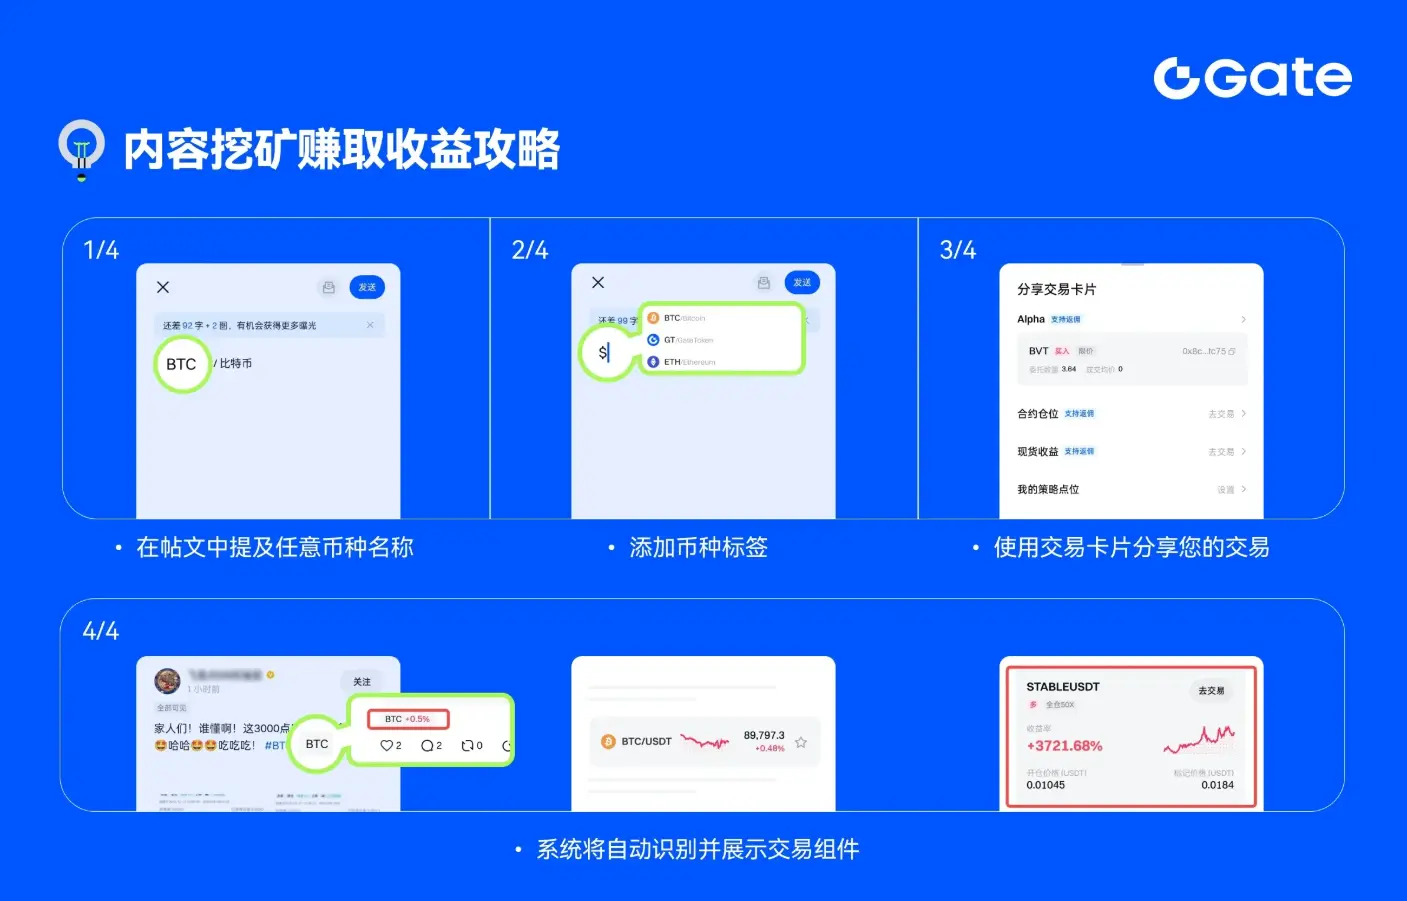
🚀 Gate Square Content Mining Public Beta is Live!
Want to turn your crypto knowledge into real rewards? Gate Square is giving creators like you the chance to earn up to 60% commission rebate just by posting, sharing insights, and interacting with your audience.
How to Get Started:
1️⃣ Sign up for the public beta here: https://www.gate.com/questionnaire/7358
2️⃣ Share market insights using token components and follow cards
3️⃣ Engage with fans to help facilitate genuine trades
Rewards Breakdown:
💰 Basic Rebate: Fans trading earns you 10%
💰 Milestone Bonus: Hit posting & interaction goals for
TOKEN36.99%
- Reward
- 2
- 1
- Repost
- Share
Yanlin :
:
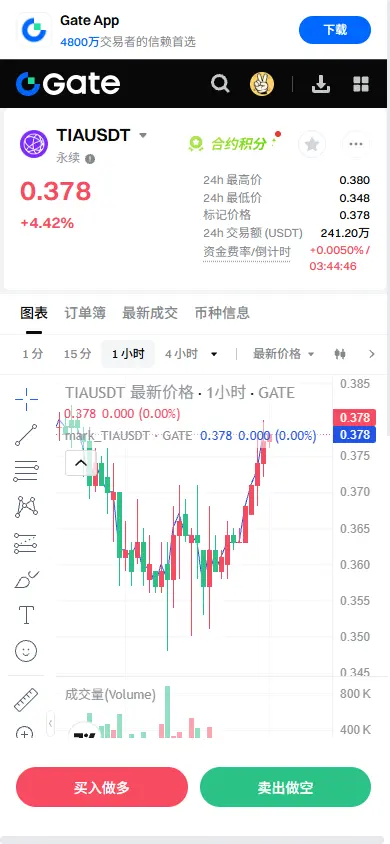
2026 GOGOGO 👊【$TIA Signal】Long | Volume and Price Rise Together for Breakout
$TIA After a volume surge, the price action indicates a healthy breakout rather than a bearish trap. Open interest (OI) rises in tandem, suggesting institutional funds are entering the market rather than retail FOMO.
🎯Direction: Long
🎯Entry: 0.374 - 0.380
🛑Stop Loss: 0.365 (Rigid Stop Loss)
🚀Target 1: 0.395
🚀Target 2: 0.410
$TIA A volume breakout above a key resistance level, with price and open interest rising together, is a classic sign of strength. The market shows effective absorption of buy orders, with limited pullback,
View Original$TIA After a volume surge, the price action indicates a healthy breakout rather than a bearish trap. Open interest (OI) rises in tandem, suggesting institutional funds are entering the market rather than retail FOMO.
🎯Direction: Long
🎯Entry: 0.374 - 0.380
🛑Stop Loss: 0.365 (Rigid Stop Loss)
🚀Target 1: 0.395
🚀Target 2: 0.410
$TIA A volume breakout above a key resistance level, with price and open interest rising together, is a classic sign of strength. The market shows effective absorption of buy orders, with limited pullback,
- Reward
- like
- Comment
- Repost
- Share
Your new car this year is waiting you

- Reward
- like
- Comment
- Repost
- Share
#TraditionalFinanceAcceleratesTokenization
One of the most consequential shifts in global finance is underway: traditional financial institutions are accelerating their embrace of tokenization, fundamentally reshaping how assets are issued, traded, settled, and accessed. What once was viewed as a niche application of blockchain technology has matured into a strategic priority for legacy banks, asset managers, regulators, and market infrastructure providers. The hashtag #TraditionalFinanceAcceleratesTokenization captures this transformation not as a speculative buzzword, but as a structural ev
One of the most consequential shifts in global finance is underway: traditional financial institutions are accelerating their embrace of tokenization, fundamentally reshaping how assets are issued, traded, settled, and accessed. What once was viewed as a niche application of blockchain technology has matured into a strategic priority for legacy banks, asset managers, regulators, and market infrastructure providers. The hashtag #TraditionalFinanceAcceleratesTokenization captures this transformation not as a speculative buzzword, but as a structural ev

- Reward
- 2
- 5
- Repost
- Share
Falcon_Official:
DYOR 🤓View More
#FedLeadershipImpact The leadership of the US Federal Reserve continues to act as a central gravitational force for global financial markets, influencing capital flows, risk sentiment, and long-term investment behavior. As markets move deeper into a data-driven and expectation-sensitive environment, Fed leadership is no longer judged solely by interest rate decisions, but by credibility, consistency, and strategic foresight. In the current cycle, even subtle shifts in tone can reshape narratives across equities, bonds, commodities, and digital assets.
At the foundation of this influence lies t
At the foundation of this influence lies t
BTC1.47%

- Reward
- 1
- 1
- Repost
- Share
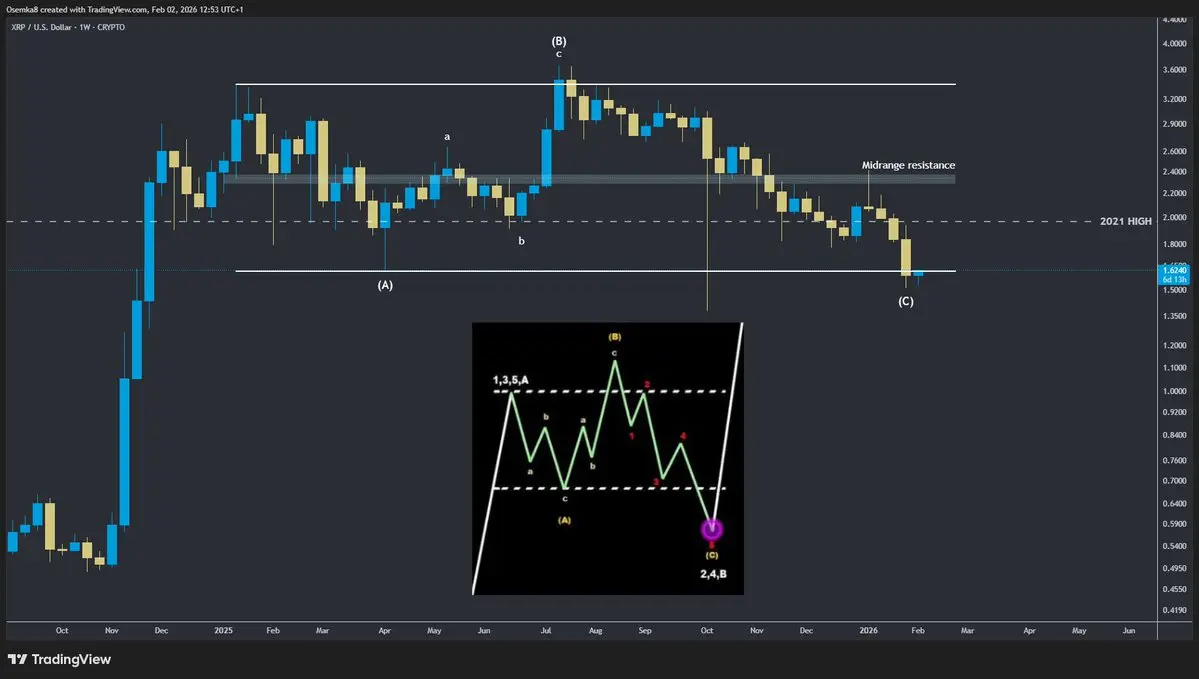
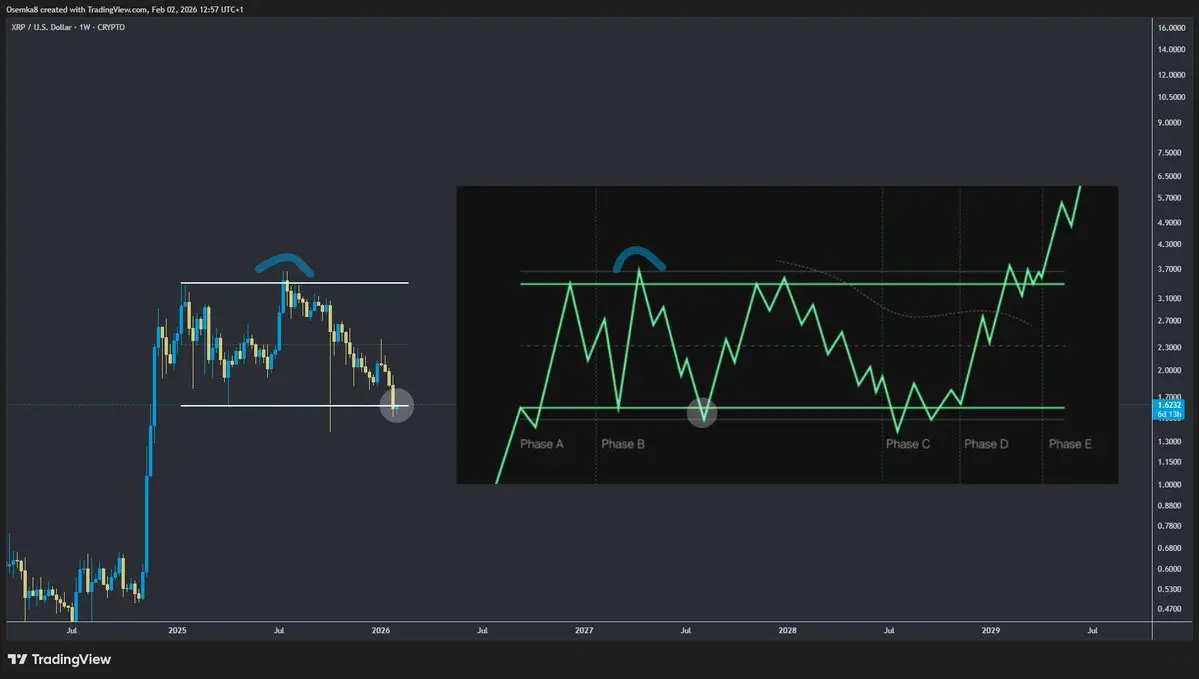
Discovery:
2026 GOGOGO 👊[ $XRP ]If this was an expanded flat correction on XRP, then this here has to be a low soon.With that, the bullish case would probably be a huge reaccumulation channel with a bottom here and that the lower part of the range should be viewed for accumulation for years ahead. If alts run before that, XRP would not be amongst the first to go. Rather, again, one of the last.
XRP2.42%
- Reward
- like
- Comment
- Repost
- Share
Load More
Join 40M users in our growing community
⚡️ Join 40M users in the crypto craze discussion
💬 Engage with your favorite top creators
👍 See what interests you
Trending Topics
View More380.81K Popularity
9.59K Popularity
9.35K Popularity
5.21K Popularity
3.55K Popularity
Hot Gate Fun
View More- MC:$2.87KHolders:10.00%
- MC:$2.87KHolders:10.00%
- MC:$2.87KHolders:10.00%
- MC:$2.86KHolders:10.00%
- MC:$3.33KHolders:22.59%
News
View MoreCircle Transfers 750 Million USDC
2 m
Argentine cryptocurrency scam suspect arrested in Venezuela after allegedly fleeing with $56 million worth of Bitcoin
10 m
Data: The only group currently continuing to buy is the mega whales holding over 1,000 BTC. Retail investors holding less than 10 BTC have been continuously selling for a month.
27 m
Sky Protocol used a total of 8.5 million USDS to repurchase 130 million SKY in January.
33 m
India plans to explore cross-border use of digital rupees to reduce payment costs and improve trade settlement efficiency
35 m
Pin