


Solana (SOL)
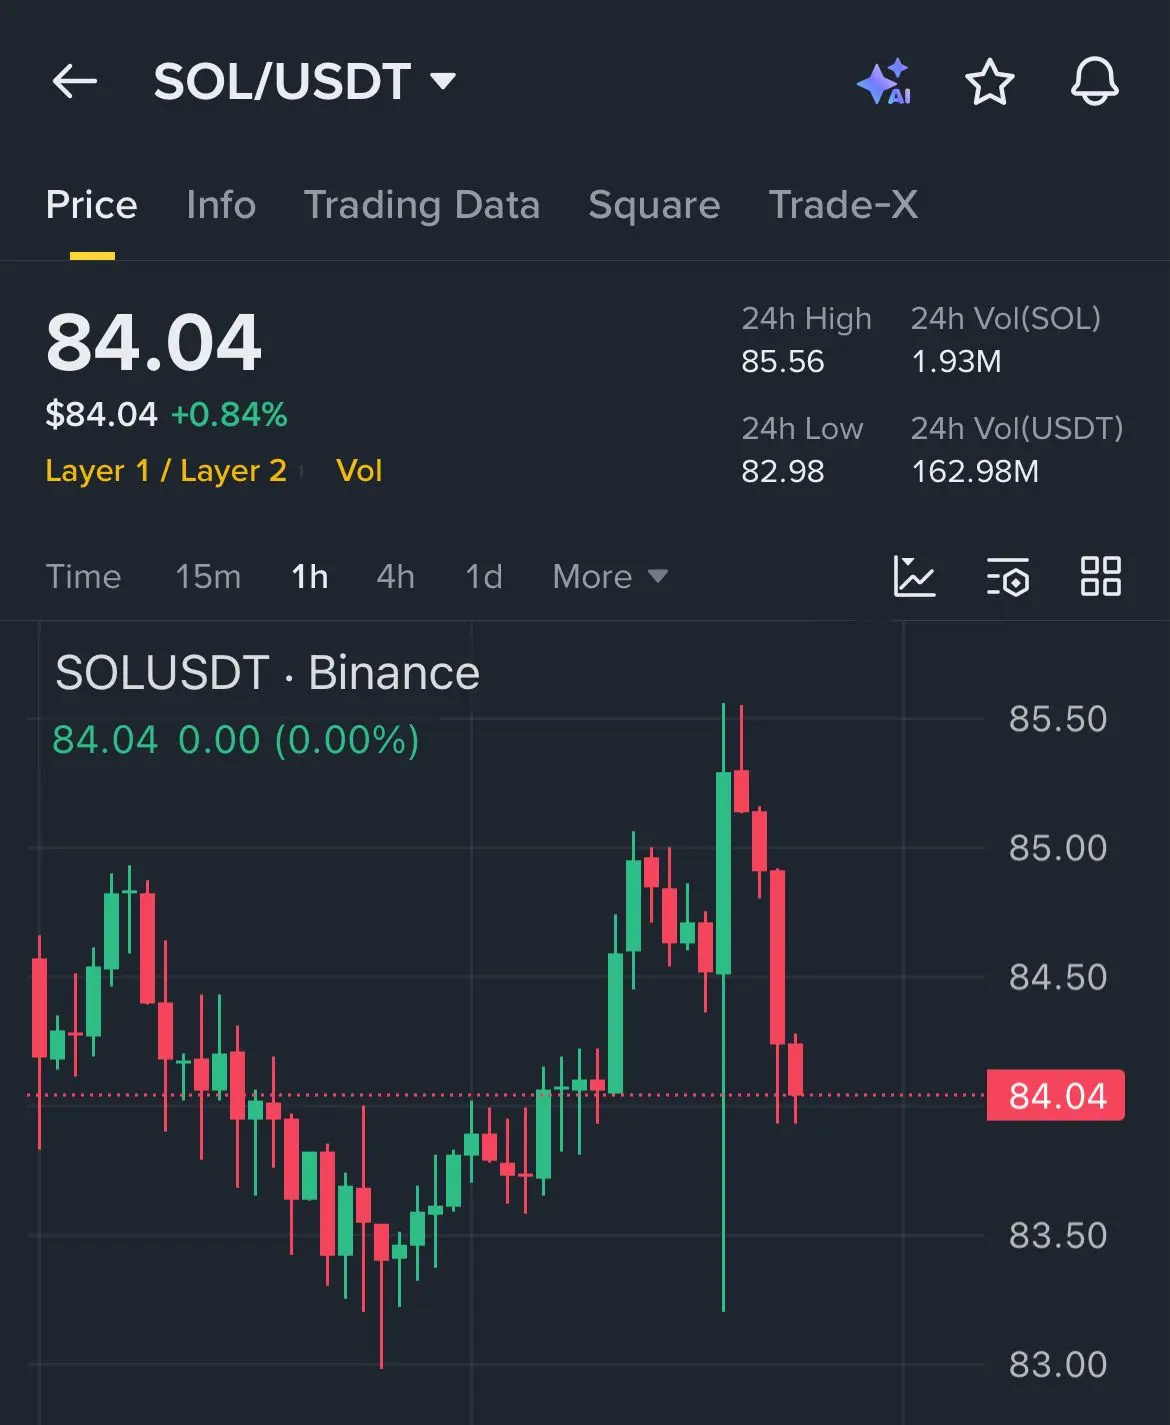
Price: Trading in the 84.98 – 85.60 USD range, up 1.67% over the last 24 hours
1. Current Support and Resistance Levels
The main resistance zone is between 90.00 and 94.00 USD. This area lines up with the 100-day exponential moving average, the upper trendline of the symmetrical triangle, and the Glassnode cost basis heat map where 9.9 million SOL is held in the 90-92 USD band. For that reason, it is a strong supply zone.
Psychological resistance sits at 87.00 to 88.20 USD. The 76.4% Fibonacci retracement is at 88.20 USD and the horizontal ceiling on the 4-hour chart is at 88.00 USD. A daily close above this area puts 90.95 USD and 100.00 USD in focus.
Intermediate resistance is found at 86.50 to 87.30 USD. The 50-day exponential moving average is at 87.04 USD and the Kijun line at 83.72 USD. Holding above it makes this the first test area.
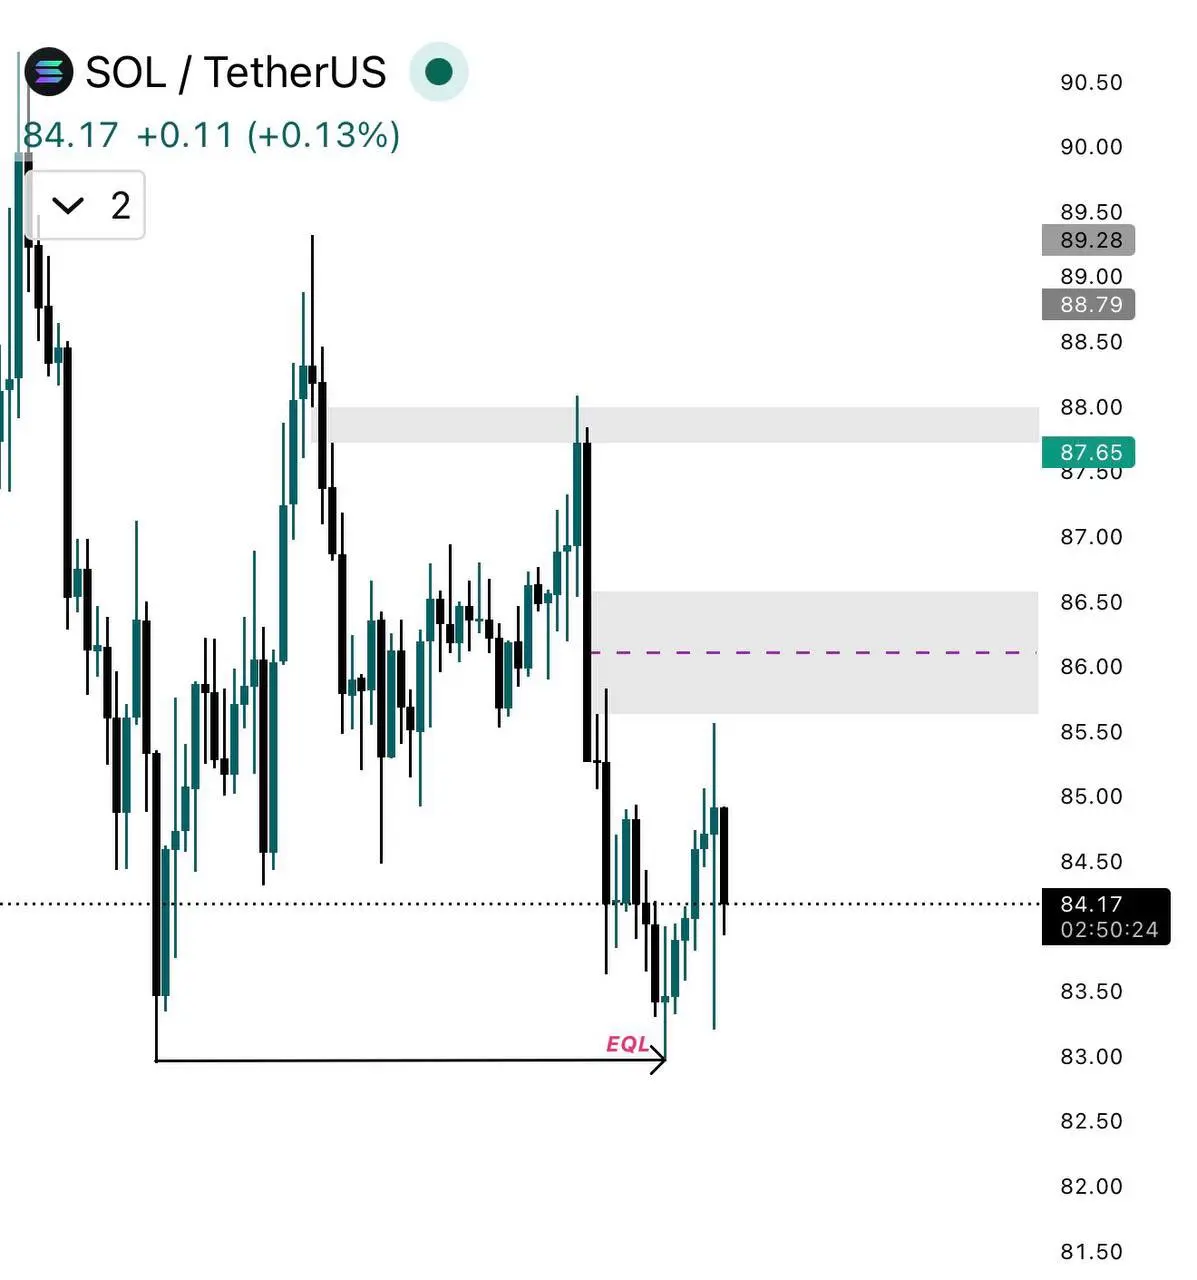
Immediate support is in the 83.00 to 83.70 USD band. The Kijun level at 83.72 USD and the recent rising trendline at 83.83 USD intersect here. Price is currently trying to hold above this zone.
Strong support runs from 80.00 to 82.00 USD. This is a round-number psychology level and the lower reversal zone on the 4-hour chart. A daily close below 80.00 USD would weaken the structure.
Critical support is between 76.00 and 78.00 USD. The early-April low was 78.00 USD and the 3-day Bollinger Band lower limit is at 77.00 USD. Losing this area brings 73.00 USD and the 67.00-70.00 USD range into view.
Rule: As long as price stays above 85.00 USD, the structure is intact. A strong close above 88.00 USD opens the 90.00 – 94.00 USD range. A close below 80.00 USD increases the risk of 73.00 USD.
2. Structural View Using Fibonacci Levels
Using the February 2026 low of 76.69 USD and the April 2026 high of 90.80 USD:
The 23.6% retracement is at 84.25 USD. Price is currently trading here and this is the short-term balance point.
The 38.2% retracement is at 86.50 USD. It overlaps with the 50-day exponential moving average, making it important resistance.
The 50% retracement is at 87.74 USD. This is an intermediate target and liquidity area.
The 61.8% retracement is at 89.26 USD. This is the main breakout level. A daily close above it activates the 100.00 USD psychological target.
The 76.4% retracement is at 88.20 USD. This is the first area short-term sellers defend.
On the daily chart, Solana is using the 50-day exponential moving average as support as long as it holds above 85.00 USD. On the weekly chart, Bollinger Bands are compressing between 77.00 USD and 94.00 USD. This compression usually precedes a sharp move. A 3-day candle close above 94.00 USD opens the path to 100.00 USD.
3. Market Sentiment: Compression and Waiting
Solana participants are currently driven by three main dynamics:
First, institutional accumulation. Solana ETFs recorded 9.44 million USD in net inflows last week and saw inflows for five consecutive days. Total assets stand at 1.45 billion USD. Goldman Sachs disclosed an approximate 108 million USD SOL position. This shows institutional interest continues.
Second, on-chain strength. According to CoinGecko data, Solana led decentralized exchange spot volume in Q1 2026 with a 30.6% share. While total DEX volume declined, Solana increased its share. Stablecoin transfer volume was 1 trillion USD last year, and the network reached nearly that figure in the past month alone. This usage growth supports fundamental value.
Third, retail indecision. The 20-day exponential moving average is at 86.00 USD, the 50-day exponential moving average is at 85.90 USD, and price is compressed around 85.00 USD. RSI is at 52, neutral. MACD is attempting to move into positive territory. ADX is at 8.55, showing weak trend strength. This reads as “searching for direction”: buyers defend 83.00 USD, sellers hold 88.00 USD.
Liquidation data: More than 600 million USD in long positions are at risk below 80.00 USD. Above 90.00 USD, short liquidations could accelerate. The market is consolidating in the 83.00 – 88.00 USD range with declining volume.
4. Current News Flow and Catalysts
Western Union announced it will launch a US dollar-backed stablecoin called USDPT on the Solana blockchain next month. This represents a direct entry of traditional finance into the Solana network and can increase network usage.
While BitMine Immersion Technologies bought 4.98 million ETH, inflows into Solana ETFs also continue. Institutional capital flow is supportive for SOL.
In the options market, 10 billion USD worth of BTC, ETH, XRP, and SOL contracts expire this week. Solana is included in this volatility window and is tracked in the same liquidity pool as major assets.
On the network side: The Solana Foundation lent USDT to Aave and is preparing to bring the AAVE token to Solana. Despite a 293 million USD loss after the KelpDAO incident, the network’s total value has recovered.
On the macro side: Goldman Sachs does not expect a rate cut until Q3. This creates a cautious stance for risk assets. For that reason, SOL remains compressed in the 80.00 – 90.00 USD range.
5. Technical Indicator Summary – April 29
RSI is between 51.7 and 61.5, in neutral territory. It does not provide direction on its own.
MACD histogram is trying to cross into positive territory. A move above the signal line would show buyers taking control.
The 20-day exponential moving average is at 85.50 USD and the 50-day exponential moving average is at 85.90 USD. Price is compressed between these two averages.
The 100-day exponential moving average is at 89.00 USD. This level coincides with the upper trendline of the symmetrical triangle. It is the first major resistance.
The 200-week exponential moving average is at 113.00 USD. This is critical for long-term trend direction. If the triangle breaks, it becomes the medium-term target.
Ichimoku Cloud: Price is above the Kijun at 83.72 USD. The top of the cloud around 86.00 USD acts as resistance.
6. Scenario Plan
Bullish scenario: A strong break of the 88.00 – 89.00 USD band with volume targets 90.95 USD, then 94.00 USD and 100.00 USD. If the 3-day candle closes above 94.00 USD, 113.00 USD comes into view. Continued ETF inflows and rising volume are needed for this.
Bearish scenario: A daily close below 83.00 USD targets 80.00 USD, 77.00 USD, and 73.00 USD. Losing 77.00 USD breaks the structure and increases the risk of 65.00 USD.
Consolidation scenario: Continued sideways movement between 83.00 and 88.00 USD. Bollinger Bands are compressed in the 77.00 – 94.00 USD range. The breakout will be sharp. A close above 88.00 USD favors buyers, a close below 83.00 USD favors sellers.
7. Key Takeaways
Solana is searching for balance around 85.00 USD. The 88.00 USD resistance has held for weeks. This level is both a technical and on-chain cost basis barrier.
Institutional inflows and DEX volume leadership support price. Slowing ETF inflows and unstaking-related supply limit upside. The market is balancing these two forces.
The SuperTrend indicator gave its first buy signal since May 2025. This may indicate the long consolidation is ending.
Volatility is contracting. The apex of the triangle formation is approaching. A breakout is near. 87.20 USD and 88.00 USD are the trigger levels. Holding above them opens the 90.00 – 96.00 USD range.
Summary: SOL is in a decision zone between 83.00 and 88.00 USD. Holding above 85.50 USD keeps the target at 90.00 USD active. A close below 80.00 USD increases the risk of 73.00 USD. Market direction will be defined by a close above 88.00 USD or below 83.00 USD. The FOMC decision and ETF flows may act as catalysts for the breakout.
#TechnicalAnalysis #SoLanà
#GateSquare #CreatorCarnival #ContentMining
Price: Trading in the 84.98 – 85.60 USD range, up 1.67% over the last 24 hours
1. Current Support and Resistance Levels
The main resistance zone is between 90.00 and 94.00 USD. This area lines up with the 100-day exponential moving average, the upper trendline of the symmetrical triangle, and the Glassnode cost basis heat map where 9.9 million SOL is held in the 90-92 USD band. For that reason, it is a strong supply zone.
Psychological resistance sits at 87.00 to 88.20 USD. The 76.4% Fibonacci retracement is at 88.20 USD and the horizontal ceiling on the 4-hour chart is at 88.00 USD. A daily close above this area puts 90.95 USD and 100.00 USD in focus.
Intermediate resistance is found at 86.50 to 87.30 USD. The 50-day exponential moving average is at 87.04 USD and the Kijun line at 83.72 USD. Holding above it makes this the first test area.
Immediate support is in the 83.00 to 83.70 USD band. The Kijun level at 83.72 USD and the recent rising trendline at 83.83 USD intersect here. Price is currently trying to hold above this zone.
Strong support runs from 80.00 to 82.00 USD. This is a round-number psychology level and the lower reversal zone on the 4-hour chart. A daily close below 80.00 USD would weaken the structure.
Critical support is between 76.00 and 78.00 USD. The early-April low was 78.00 USD and the 3-day Bollinger Band lower limit is at 77.00 USD. Losing this area brings 73.00 USD and the 67.00-70.00 USD range into view.
Rule: As long as price stays above 85.00 USD, the structure is intact. A strong close above 88.00 USD opens the 90.00 – 94.00 USD range. A close below 80.00 USD increases the risk of 73.00 USD.
2. Structural View Using Fibonacci Levels
Using the February 2026 low of 76.69 USD and the April 2026 high of 90.80 USD:
The 23.6% retracement is at 84.25 USD. Price is currently trading here and this is the short-term balance point.
The 38.2% retracement is at 86.50 USD. It overlaps with the 50-day exponential moving average, making it important resistance.
The 50% retracement is at 87.74 USD. This is an intermediate target and liquidity area.
The 61.8% retracement is at 89.26 USD. This is the main breakout level. A daily close above it activates the 100.00 USD psychological target.
The 76.4% retracement is at 88.20 USD. This is the first area short-term sellers defend.
On the daily chart, Solana is using the 50-day exponential moving average as support as long as it holds above 85.00 USD. On the weekly chart, Bollinger Bands are compressing between 77.00 USD and 94.00 USD. This compression usually precedes a sharp move. A 3-day candle close above 94.00 USD opens the path to 100.00 USD.
3. Market Sentiment: Compression and Waiting
Solana participants are currently driven by three main dynamics:
First, institutional accumulation. Solana ETFs recorded 9.44 million USD in net inflows last week and saw inflows for five consecutive days. Total assets stand at 1.45 billion USD. Goldman Sachs disclosed an approximate 108 million USD SOL position. This shows institutional interest continues.
Second, on-chain strength. According to CoinGecko data, Solana led decentralized exchange spot volume in Q1 2026 with a 30.6% share. While total DEX volume declined, Solana increased its share. Stablecoin transfer volume was 1 trillion USD last year, and the network reached nearly that figure in the past month alone. This usage growth supports fundamental value.
Third, retail indecision. The 20-day exponential moving average is at 86.00 USD, the 50-day exponential moving average is at 85.90 USD, and price is compressed around 85.00 USD. RSI is at 52, neutral. MACD is attempting to move into positive territory. ADX is at 8.55, showing weak trend strength. This reads as “searching for direction”: buyers defend 83.00 USD, sellers hold 88.00 USD.
Liquidation data: More than 600 million USD in long positions are at risk below 80.00 USD. Above 90.00 USD, short liquidations could accelerate. The market is consolidating in the 83.00 – 88.00 USD range with declining volume.
4. Current News Flow and Catalysts
Western Union announced it will launch a US dollar-backed stablecoin called USDPT on the Solana blockchain next month. This represents a direct entry of traditional finance into the Solana network and can increase network usage.
While BitMine Immersion Technologies bought 4.98 million ETH, inflows into Solana ETFs also continue. Institutional capital flow is supportive for SOL.
In the options market, 10 billion USD worth of BTC, ETH, XRP, and SOL contracts expire this week. Solana is included in this volatility window and is tracked in the same liquidity pool as major assets.
On the network side: The Solana Foundation lent USDT to Aave and is preparing to bring the AAVE token to Solana. Despite a 293 million USD loss after the KelpDAO incident, the network’s total value has recovered.
On the macro side: Goldman Sachs does not expect a rate cut until Q3. This creates a cautious stance for risk assets. For that reason, SOL remains compressed in the 80.00 – 90.00 USD range.
5. Technical Indicator Summary – April 29
RSI is between 51.7 and 61.5, in neutral territory. It does not provide direction on its own.
MACD histogram is trying to cross into positive territory. A move above the signal line would show buyers taking control.
The 20-day exponential moving average is at 85.50 USD and the 50-day exponential moving average is at 85.90 USD. Price is compressed between these two averages.
The 100-day exponential moving average is at 89.00 USD. This level coincides with the upper trendline of the symmetrical triangle. It is the first major resistance.
The 200-week exponential moving average is at 113.00 USD. This is critical for long-term trend direction. If the triangle breaks, it becomes the medium-term target.
Ichimoku Cloud: Price is above the Kijun at 83.72 USD. The top of the cloud around 86.00 USD acts as resistance.
6. Scenario Plan
Bullish scenario: A strong break of the 88.00 – 89.00 USD band with volume targets 90.95 USD, then 94.00 USD and 100.00 USD. If the 3-day candle closes above 94.00 USD, 113.00 USD comes into view. Continued ETF inflows and rising volume are needed for this.
Bearish scenario: A daily close below 83.00 USD targets 80.00 USD, 77.00 USD, and 73.00 USD. Losing 77.00 USD breaks the structure and increases the risk of 65.00 USD.
Consolidation scenario: Continued sideways movement between 83.00 and 88.00 USD. Bollinger Bands are compressed in the 77.00 – 94.00 USD range. The breakout will be sharp. A close above 88.00 USD favors buyers, a close below 83.00 USD favors sellers.
7. Key Takeaways
Solana is searching for balance around 85.00 USD. The 88.00 USD resistance has held for weeks. This level is both a technical and on-chain cost basis barrier.
Institutional inflows and DEX volume leadership support price. Slowing ETF inflows and unstaking-related supply limit upside. The market is balancing these two forces.
The SuperTrend indicator gave its first buy signal since May 2025. This may indicate the long consolidation is ending.
Volatility is contracting. The apex of the triangle formation is approaching. A breakout is near. 87.20 USD and 88.00 USD are the trigger levels. Holding above them opens the 90.00 – 96.00 USD range.
Summary: SOL is in a decision zone between 83.00 and 88.00 USD. Holding above 85.50 USD keeps the target at 90.00 USD active. A close below 80.00 USD increases the risk of 73.00 USD. Market direction will be defined by a close above 88.00 USD or below 83.00 USD. The FOMC decision and ETF flows may act as catalysts for the breakout.
#TechnicalAnalysis #SoLanà
#GateSquare #CreatorCarnival #ContentMining
