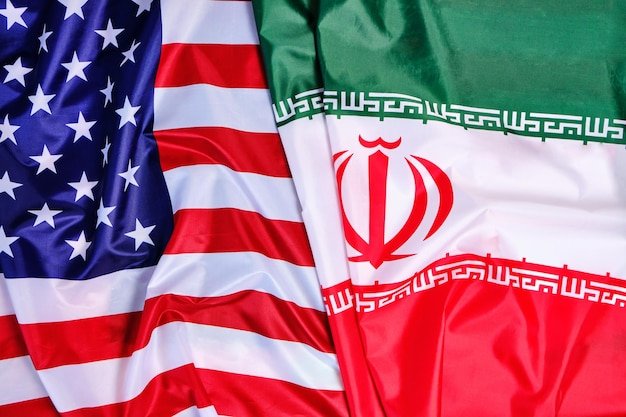
#USIranNegotiationGame The ongoing geopolitical confrontation between the United States and Iran remains one of the most powerful macro forces shaping global financial markets in 2026. What appears externally as diplomatic engagement is in reality a strategic leverage game where both nations continuously adjust pressure through sanctions, nuclear negotiations, military signaling, and regional influence.
The United States applies economic pressure through sanctions targeting Iran’s oil exports, shipping networks, banking infrastructure, and international financial access. Iran responds through nuclear enrichment expansion, proxy networks across the Middle East, and strategic leverage over global energy routes, particularly the Strait of Hormuz, through which nearly one-fifth of global oil supply flows.
This ongoing tension creates a constant cycle of fear, relief, and repricing across global markets. Every diplomatic statement, military escalation, or negotiation breakdown immediately impacts crypto, oil, gold, equities, and currency markets in real time.
Crypto Market Trend Under US-Iran Negotiation Pressure
The cryptocurrency market has evolved into a real-time geopolitical risk indicator. Digital assets now behave as macro-sensitive instruments reacting to liquidity shifts, inflation expectations, and geopolitical uncertainty.
When US-Iran tensions escalate, investors rotate capital into Bitcoin, Ethereum, and major altcoins as alternative stores of value outside traditional financial systems. When diplomatic progress emerges, liquidity flows back into equities and the U.S. dollar strengthens, temporarily pressuring crypto valuations.
Ethereum, Solana, and XRP generally follow Bitcoin’s macro direction but with amplified volatility due to lower liquidity depth and higher speculative exposure. Stablecoins also see increased demand during escalation cycles, as traders seek dollar-pegged assets outside sanctioned or stressed banking systems.
Ethereum, Bitcoin, XRP, and Solana Current Market Prices
As of 2026 market conditions:
Bitcoin (BTC): 74,030 USD
Ethereum (ETH): 2,080 USD
XRP: 1.34 USD
Solana (SOL): 82.5 USD
Bitcoin remains the dominant geopolitical hedge asset in crypto markets, while Ethereum reflects liquidity cycles and ecosystem activity. Solana and XRP act as higher-beta instruments tied to broader risk sentiment.
Ethereum (ETH) 2026 Market Analysis and Forecast
Ethereum is currently trading near 2,080 USD, reflecting a cautious macro environment shaped by geopolitical instability and uneven global liquidity conditions.
ETH has been moving in a broad 2,000–2,200 USD range, with price action heavily influenced by US-Iran negotiation headlines and global risk sentiment.
Ethereum Scenarios:
Bullish escalation: 2,300–2,450 USD
Neutral stalemate: 2,000–2,200 USD
Diplomatic improvement: 1,900–2,000 USD
Ethereum’s long-term structure remains neutral-to-volatile, with macro liquidity and geopolitical sentiment overriding technical patterns.
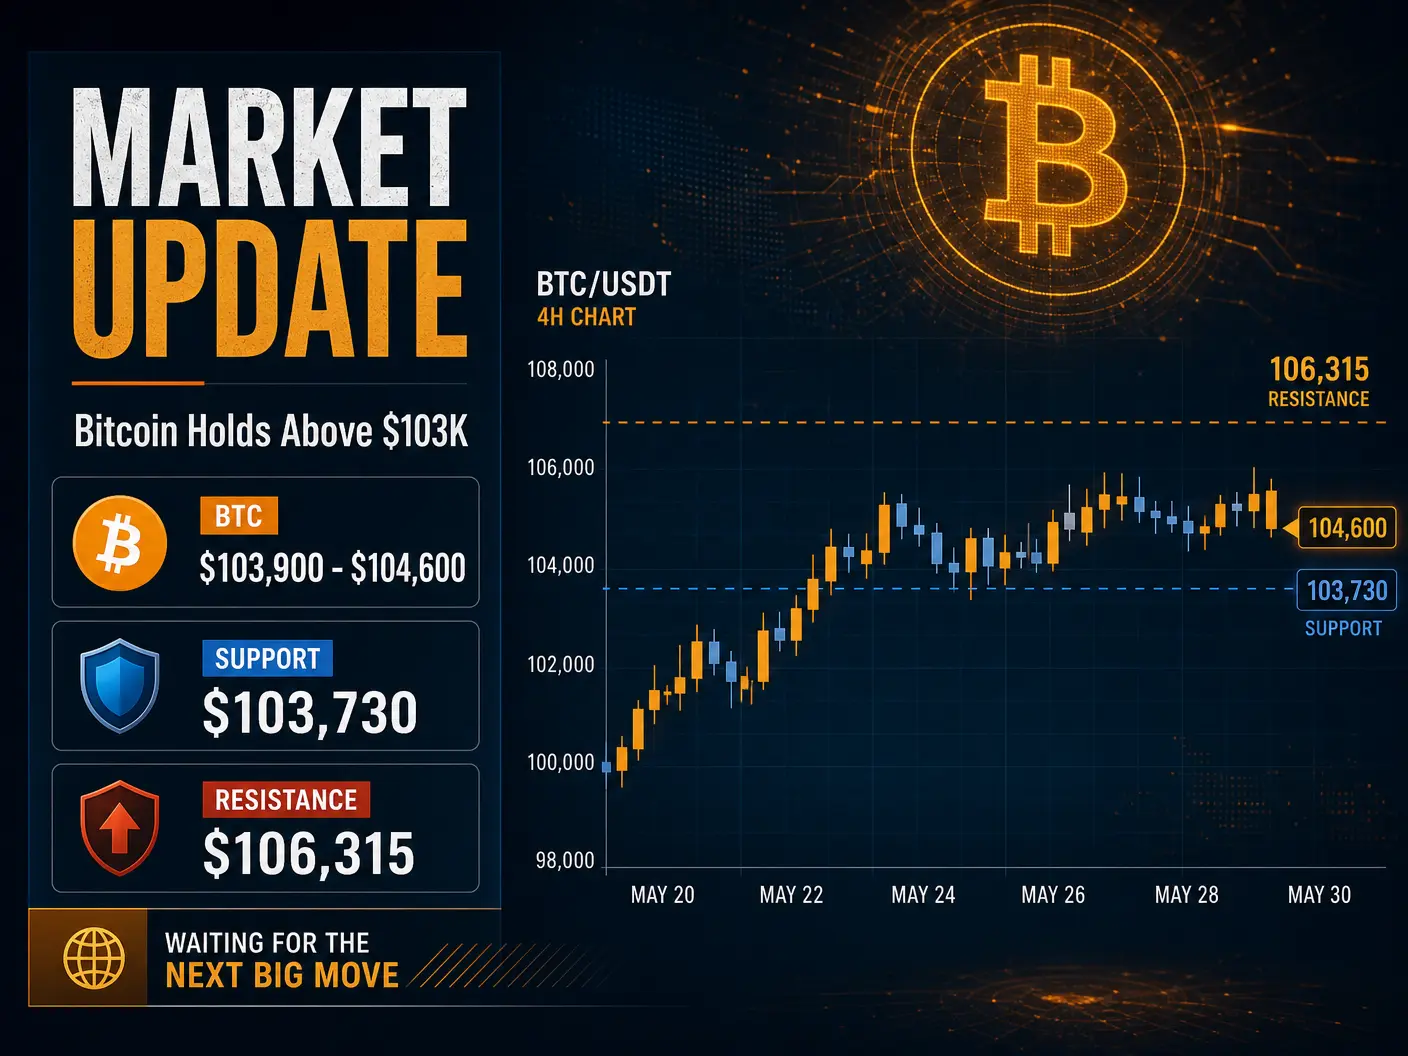
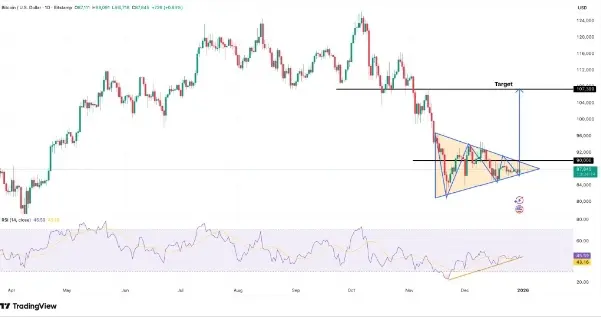
Bitcoin Market Outlook Under Geopolitical Pressure
Bitcoin at 74,030 USD continues to act as the primary digital hedge against geopolitical instability.
Its price movements are strongly linked to escalation phases in the US-Iran conflict, especially developments involving nuclear enrichment, sanctions tightening, or Strait of Hormuz risk.
Key BTC Levels:
Support: 72,000 USD
Resistance: 78,500–82,000 USD
Scenario Outlook:
Escalation shock → 85,000+ USD
Diplomatic easing → ~70,000 USD
Continued stalemate → range-bound volatility
Bitcoin remains structurally supported by institutional inflows, ETF demand, and macro hedging narratives, even during corrections.
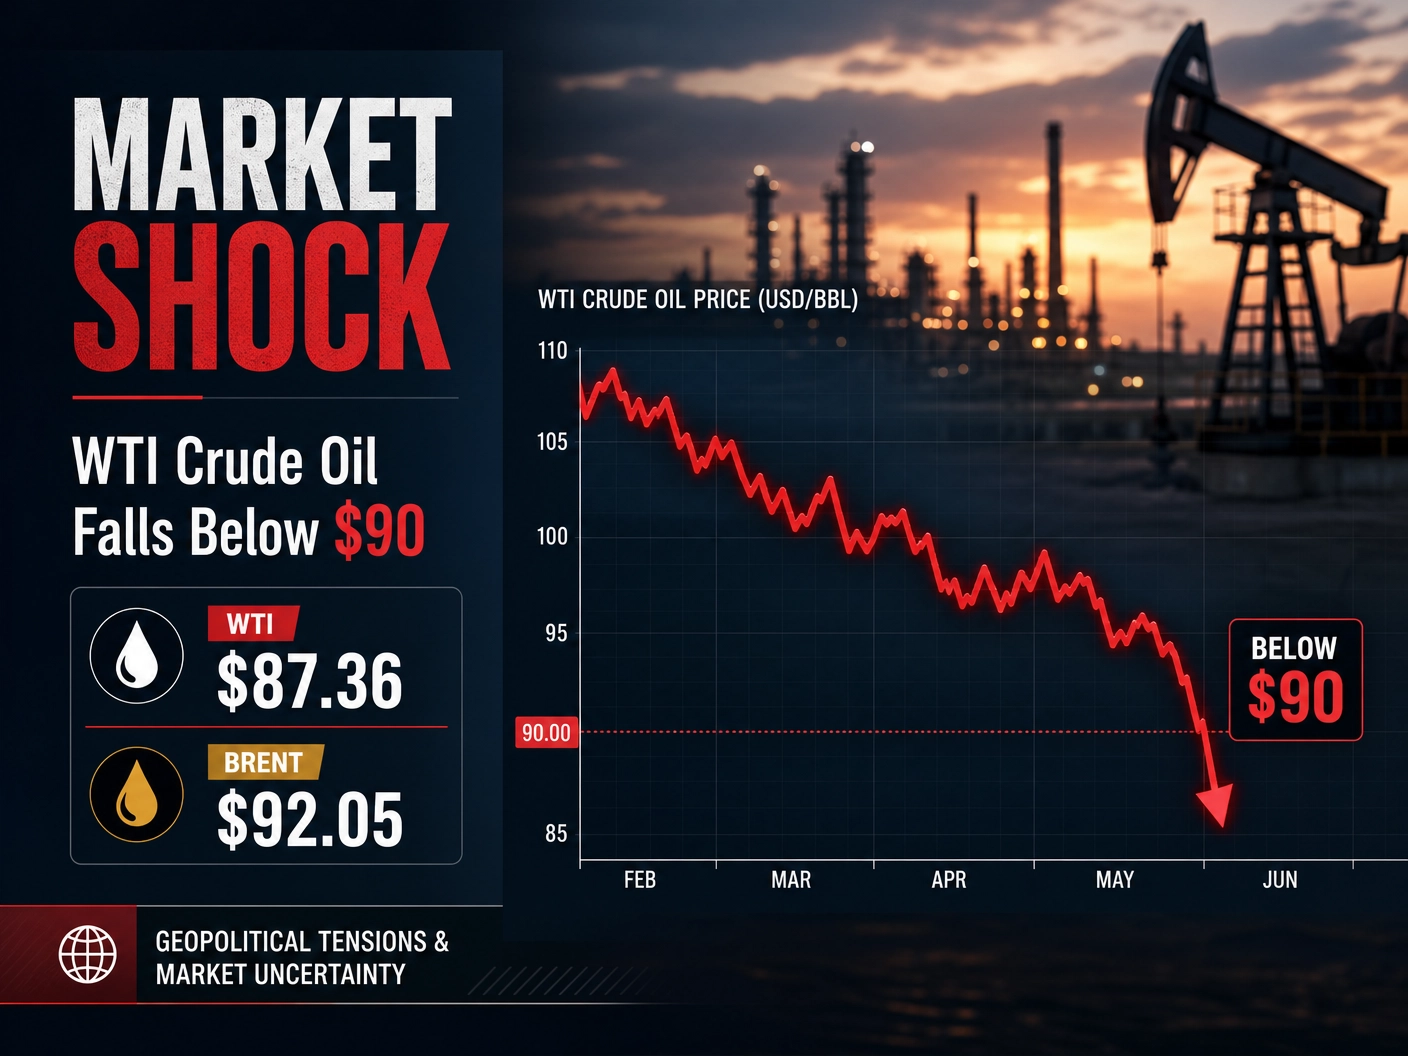
Oil Market Situation and Geopolitical Role
Oil is the central strategic weapon in the US-Iran negotiation framework. It represents both economic pressure on Iran and a global inflation trigger.
Iran’s oil exports remain constrained due to sanctions, while its geopolitical leverage is concentrated around the Strait of Hormuz, a critical global supply chokepoint.
Current Price:
WTI (XTI): 90.3 USD per barrel
Oil markets remain highly reactive to geopolitical headlines, including sanctions updates, military tension, and diplomatic signals.
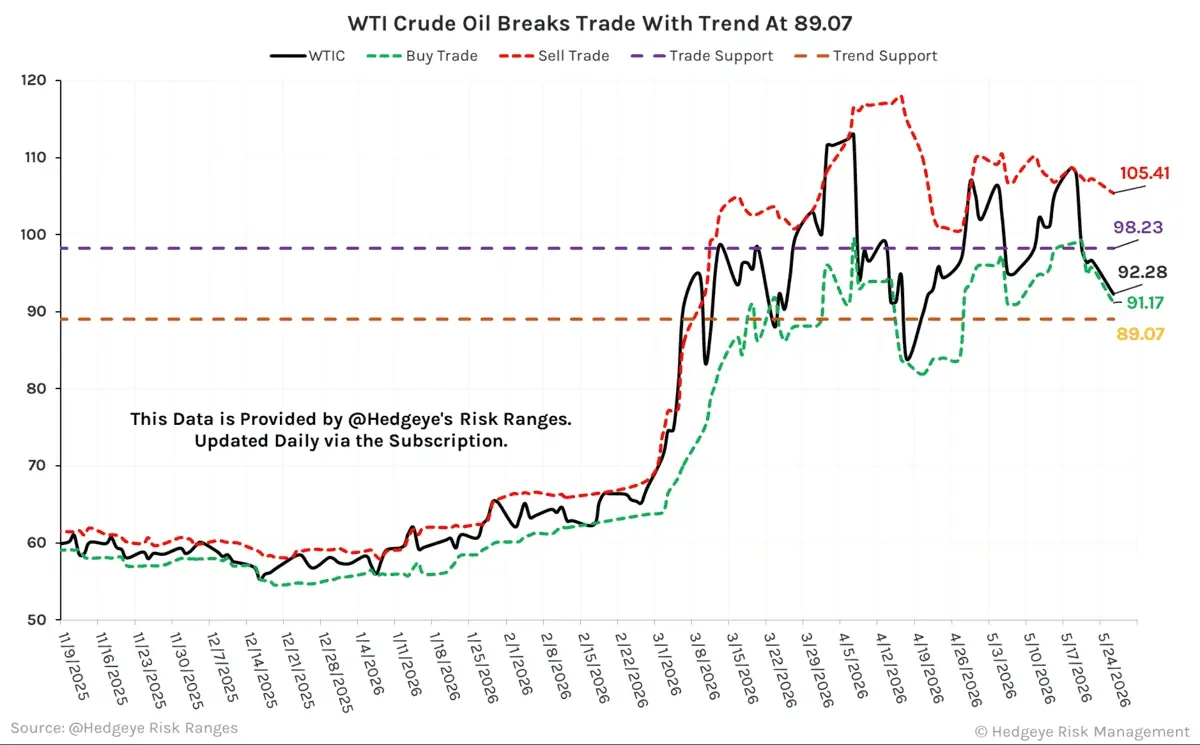
Oil Forecast Scenarios:
Upside breakout: 95–100 USD
Base range: 86–94 USD
Downside relief: 84–86 USD
Oil continues to influence inflation expectations globally, directly affecting crypto and gold valuations.
Gold Market Behavior Under Geopolitical Stress
Gold remains the strongest traditional safe-haven asset during geopolitical uncertainty.
Current Price:
Gold (XAUT): 4,530 USD
Gold reacts directly to inflation expectations, currency instability, and geopolitical escalation.
Forecast Range:
Base case: 4,450–4,650 USD
Bullish escalation: 4,750–4,900 USD
Extreme risk scenario: 4,900–5,050 USD
Diplomatic easing: 4,300–4,400 USD
Central bank accumulation continues to provide strong structural support, especially from emerging economies diversifying away from USD dependency.
Interconnected Market Dynamics
All major asset classes are tightly interconnected under the US-Iran negotiation framework.
Rising oil → inflation expectations → bullish for gold & Bitcoin
Falling oil → risk-on sentiment → supports equities & USD
Escalation → safe-haven flows into crypto & metals
Diplomacy → short-term correction in hedging assets
This creates a synchronized macro environment where no asset moves independently.
Macro Trading Impact and Strategy Framework
The US-Iran negotiation cycle has created a high-volatility trading regime where macro headlines dominate technical analysis.
Bitcoin Strategy:
Buy zone: 72K–74K dips
Sell zone: 78K–82K rallies
Breakout hedge: 85K+ targets during escalation
Ethereum Strategy:
Accumulate near 2,000 USD support
Take profit near 2,300–2,400 USD
Avoid over-leverage due to macro volatility
Oil Strategy:
Sell above 92–95 USD
Buy dips near 84–86 USD
Trade news-driven swings only
Gold Strategy:
Accumulate dips 4,350–4,450 USD
Profit zone 4,700+ USD
Hedge geopolitical spikes aggressively
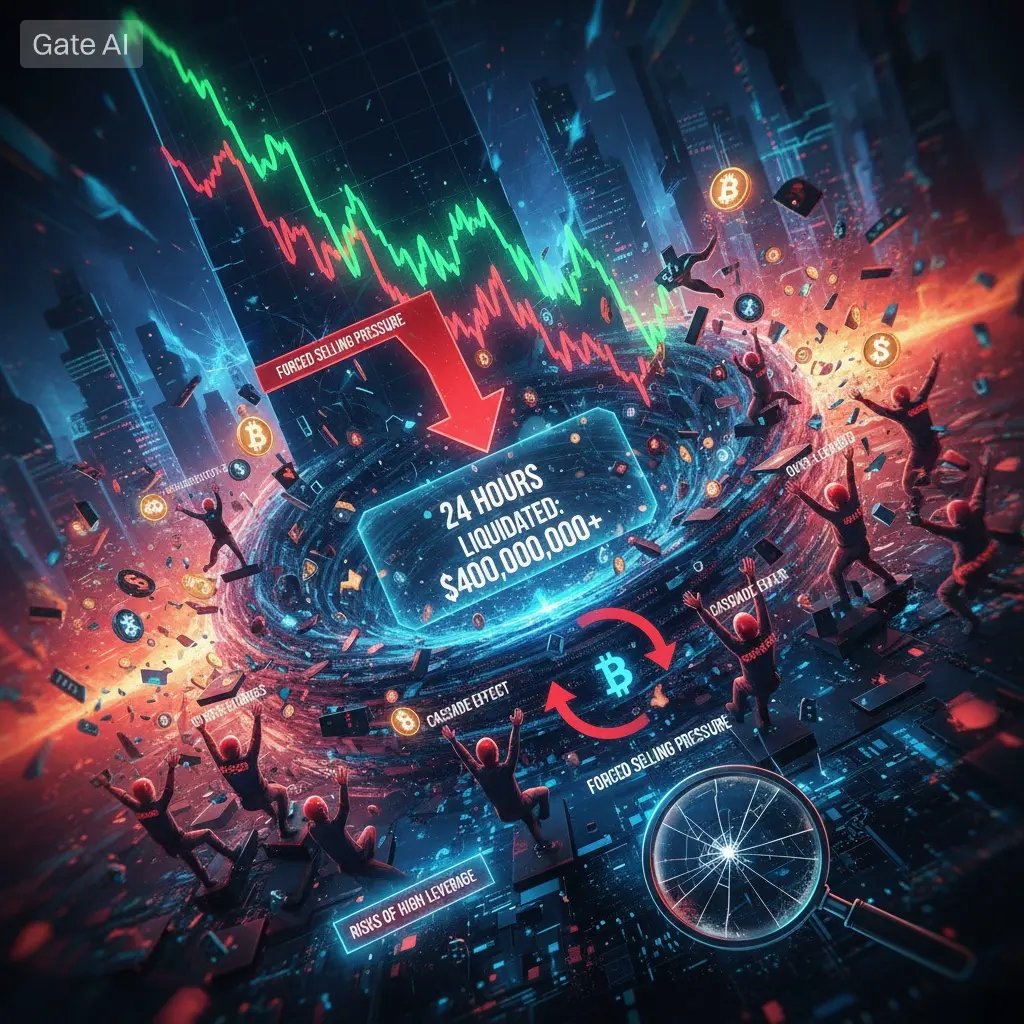
Risk management remains critical because geopolitical headlines can trigger 5–10% moves in crypto and commodities within hours.
Structural Outlook (Q3 2026)
The structural outlook remains dominated by uncertainty. Neither the US nor Iran has incentives for rapid resolution, which sustains a prolonged negotiation cycle.
This creates a macro environment where:
Bitcoin remains above 70K–100K structural range
Ethereum stays within 2,000–2,400 volatility band
Oil holds 80–100 USD geopolitical range
Gold remains elevated above 4,300 USD baseline
Markets are not trending — they are oscillating between fear and relief cycles driven entirely by geopolitical headlines.
Global financial markets remain in a high-volatility macro regime where geopolitical risk dominates traditional fundamentals.
Bitcoin at 74,030 USD, Ethereum near 2,080 USD, oil at 90.3 USD, and gold at 4,530 USD collectively reflect a world driven by uncertainty rather than stability.
Until a clear US-Iran resolution emerges, markets will continue reacting to headlines, producing cyclical volatility and structured trading opportunities across crypto, commodities, and safe-haven assets.
@Gate_Square @Gate广场_Official