Trade
Basic
Futures
Futures
Hundreds of contracts settled in USDT or BTC
TradFi
Gold
Trade global traditional assets with USDT in one place
Options
Hot
Trade European-style vanilla options
Unified Account
Maximize your capital efficiency
Demo Trading
Futures Kickoff
Get prepared for your futures trading
Futures Events
Participate in events to win generous rewards
Demo Trading
Use virtual funds to experience risk-free trading
Earn
Launch
CandyDrop
Collect candies to earn airdrops
Launchpool
Quick staking, earn potential new tokens
HODLer Airdrop
Hold GT and get massive airdrops for free
Launchpad
Be early to the next big token project
Alpha Points
Trade on-chain assets and enjoy airdrop rewards!
Futures Points
Earn futures points and claim airdrop rewards
Investment
Simple Earn
Earn interests with idle tokens
Auto-Invest
Auto-invest on a regular basis
Dual Investment
Buy low and sell high to take profits from price fluctuations
Soft Staking
Earn rewards with flexible staking
Crypto Loan
0 Fees
Pledge one crypto to borrow another
Lending Center
One-stop lending hub
VIP Wealth Hub
Customized wealth management empowers your assets growth
Private Wealth Management
Customized asset management to grow your digital assets
Quant Fund
Top asset management team helps you profit without hassle
Staking
Stake cryptos to earn in PoS products
Smart Leverage
New
No forced liquidation before maturity, worry-free leveraged gains
GUSD Minting
Use USDT/USDC to mint GUSD for treasury-level yields
More
TechnicalAnalyst
Ethereum Foundation launches Chinese website to support institutional participation
0
- Reward
- like
- Comment
- Repost
- Share
Participate in horse racing betting, complete tasks to earn horse racing tickets, and enjoy a million red envelope rain daily, sharing a prize pool of 100,000 USDT at the Gate 2026 Spring Festival Celebration. https://www.gate.com/competition/year-of-horse-2026?ref_type=165&utm_cmp=7EQB9Jba&ref=VVEXVF4KBW
View Original
- Reward
- 2
- Comment
- Repost
- Share
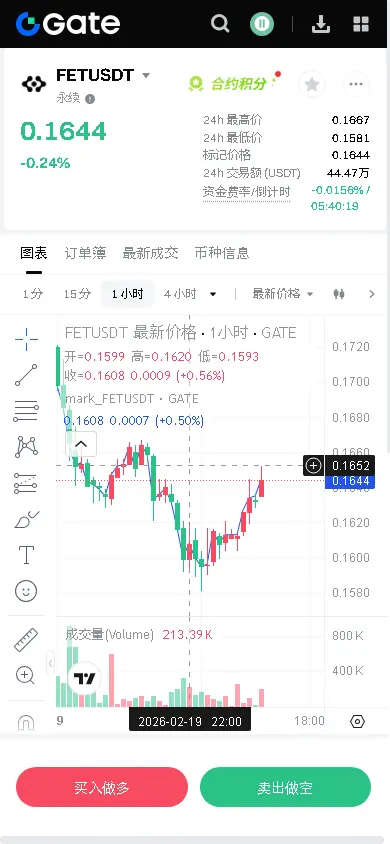
【$FET Signal】1H Breakout and Pullback Confirmation, Short-term Rebound Setup
$FET The 1H timeframe has stabilized above EMA20 (0.1628) and broken out with increased volume from the short-term consolidation zone, forming a bullish structure. Although the 4H timeframe is still in a downtrend channel, the latest candlestick closed bullish with buying pressure increasing. The momentum on the 1H aligns with the signs of a bottoming on the 4H, indicating a short-term rebound can be expected.
🎯Direction: Long (Long)
🎯Entry/Order: 0.1640 - 0.1645 (Reason: 1H EMA20 support zone & pullback confirmatio
View Original$FET The 1H timeframe has stabilized above EMA20 (0.1628) and broken out with increased volume from the short-term consolidation zone, forming a bullish structure. Although the 4H timeframe is still in a downtrend channel, the latest candlestick closed bullish with buying pressure increasing. The momentum on the 1H aligns with the signs of a bottoming on the 4H, indicating a short-term rebound can be expected.
🎯Direction: Long (Long)
🎯Entry/Order: 0.1640 - 0.1645 (Reason: 1H EMA20 support zone & pullback confirmatio
- Reward
- 3
- 1
- Repost
- Share
TooUgly :
:
Make a fortune in the Year of the Horse 🐴 Happy New Year 🙂 Make a fortune in the Year of the Horse 🐴 Happy New Year 🙂🙂🙂🙂🙂🙂🙂🙂🙂🙂FCB
发财币
Created By@BossPi
Subscription Progress
0.00%
MC:
$0
More Tokens
🔥 LATEST: #Coinbase CEO Brian Armstrong says, "Crypto is updating the entire financial system, from #trading to payments to lending and more" with trillions in revenue at stake. #crypto

- Reward
- 2
- Comment
- Repost
- Share

- Reward
- 5
- 7
- Repost
- Share
BaiXiaoyun:
Start eating shit!View More
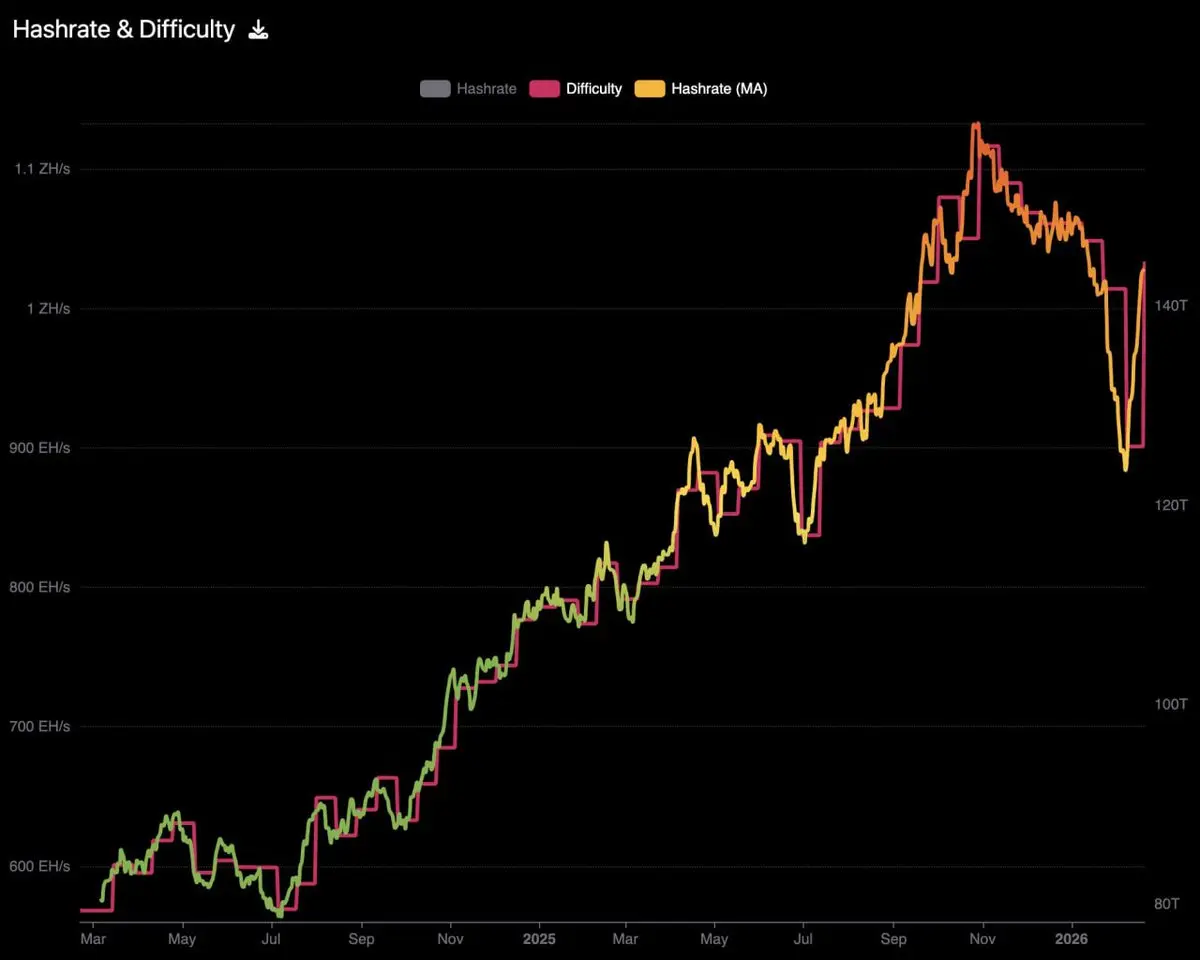
Wu says that, according to mempool founder mononaut, Bitcoin mining difficulty has surged nearly 15% to 144.4T, marking the largest increase in absolute difficulty in history and almost offsetting the previous significant adjustment.
BTC0,92%
- Reward
- 1
- Comment
- Repost
- Share
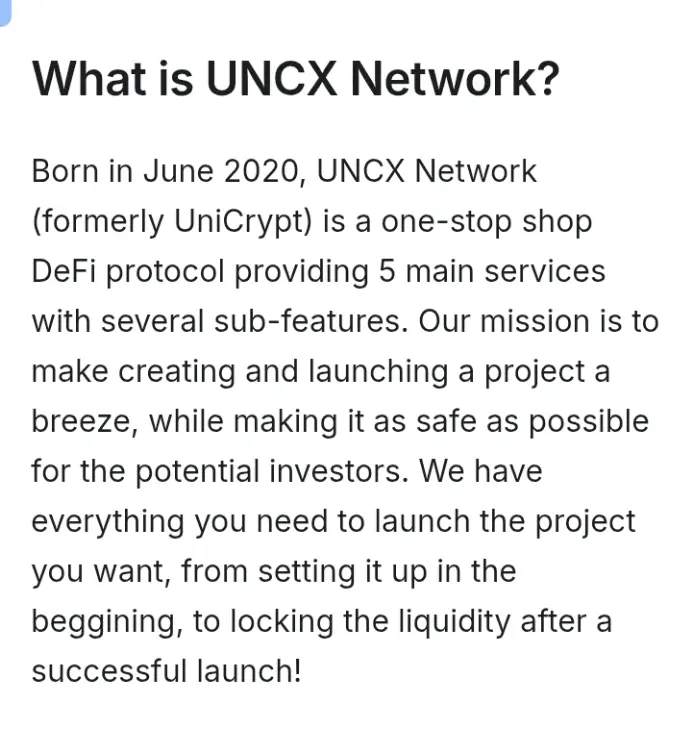
$UNCX the Unicrypt native token is now available in best price for buying for little amount holders who have just 15-20 USDT in wallet buy this token & hold it tight in future soon it must pump high then sell it don't sell if it price is down in minutes it recover back don't listen any fud just buy and hold.
UNCX0,5%

- Reward
- 2
- Comment
- Repost
- Share
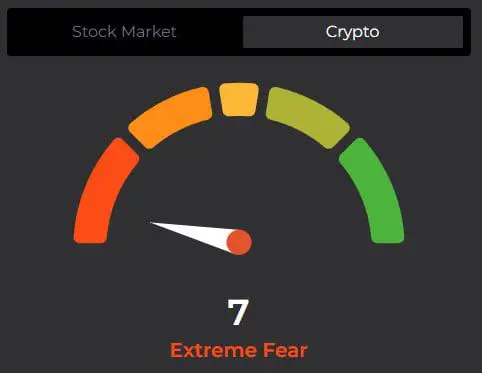
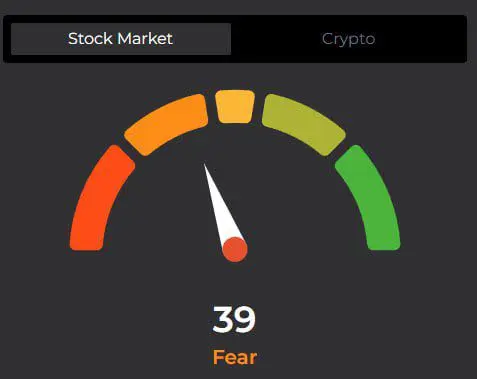
🔥The Crypto market still cannot escape "Extreme Fear"
In contrast, the Stock Market remains sideways at a safe level of 36-50. The Crypto Greed and Fear Index still hasn't broken above 10, and it even dropped to 5 last week. Currently, it is (7)
* Historically, Bitcoin has not often fallen below 7:
- August 2019, BTC dropped this index to 5
- March 2020, during COVID, this index fell to 6
- Or in 2022, Luna Terra & FTX also did not cause investor panic like now.
👉 Generally, investors are not only afraid that prices will continue to fall sharply and then recover, but they are also worried ab
BTC0,92%
- Reward
- 2
- Comment
- Repost
- Share
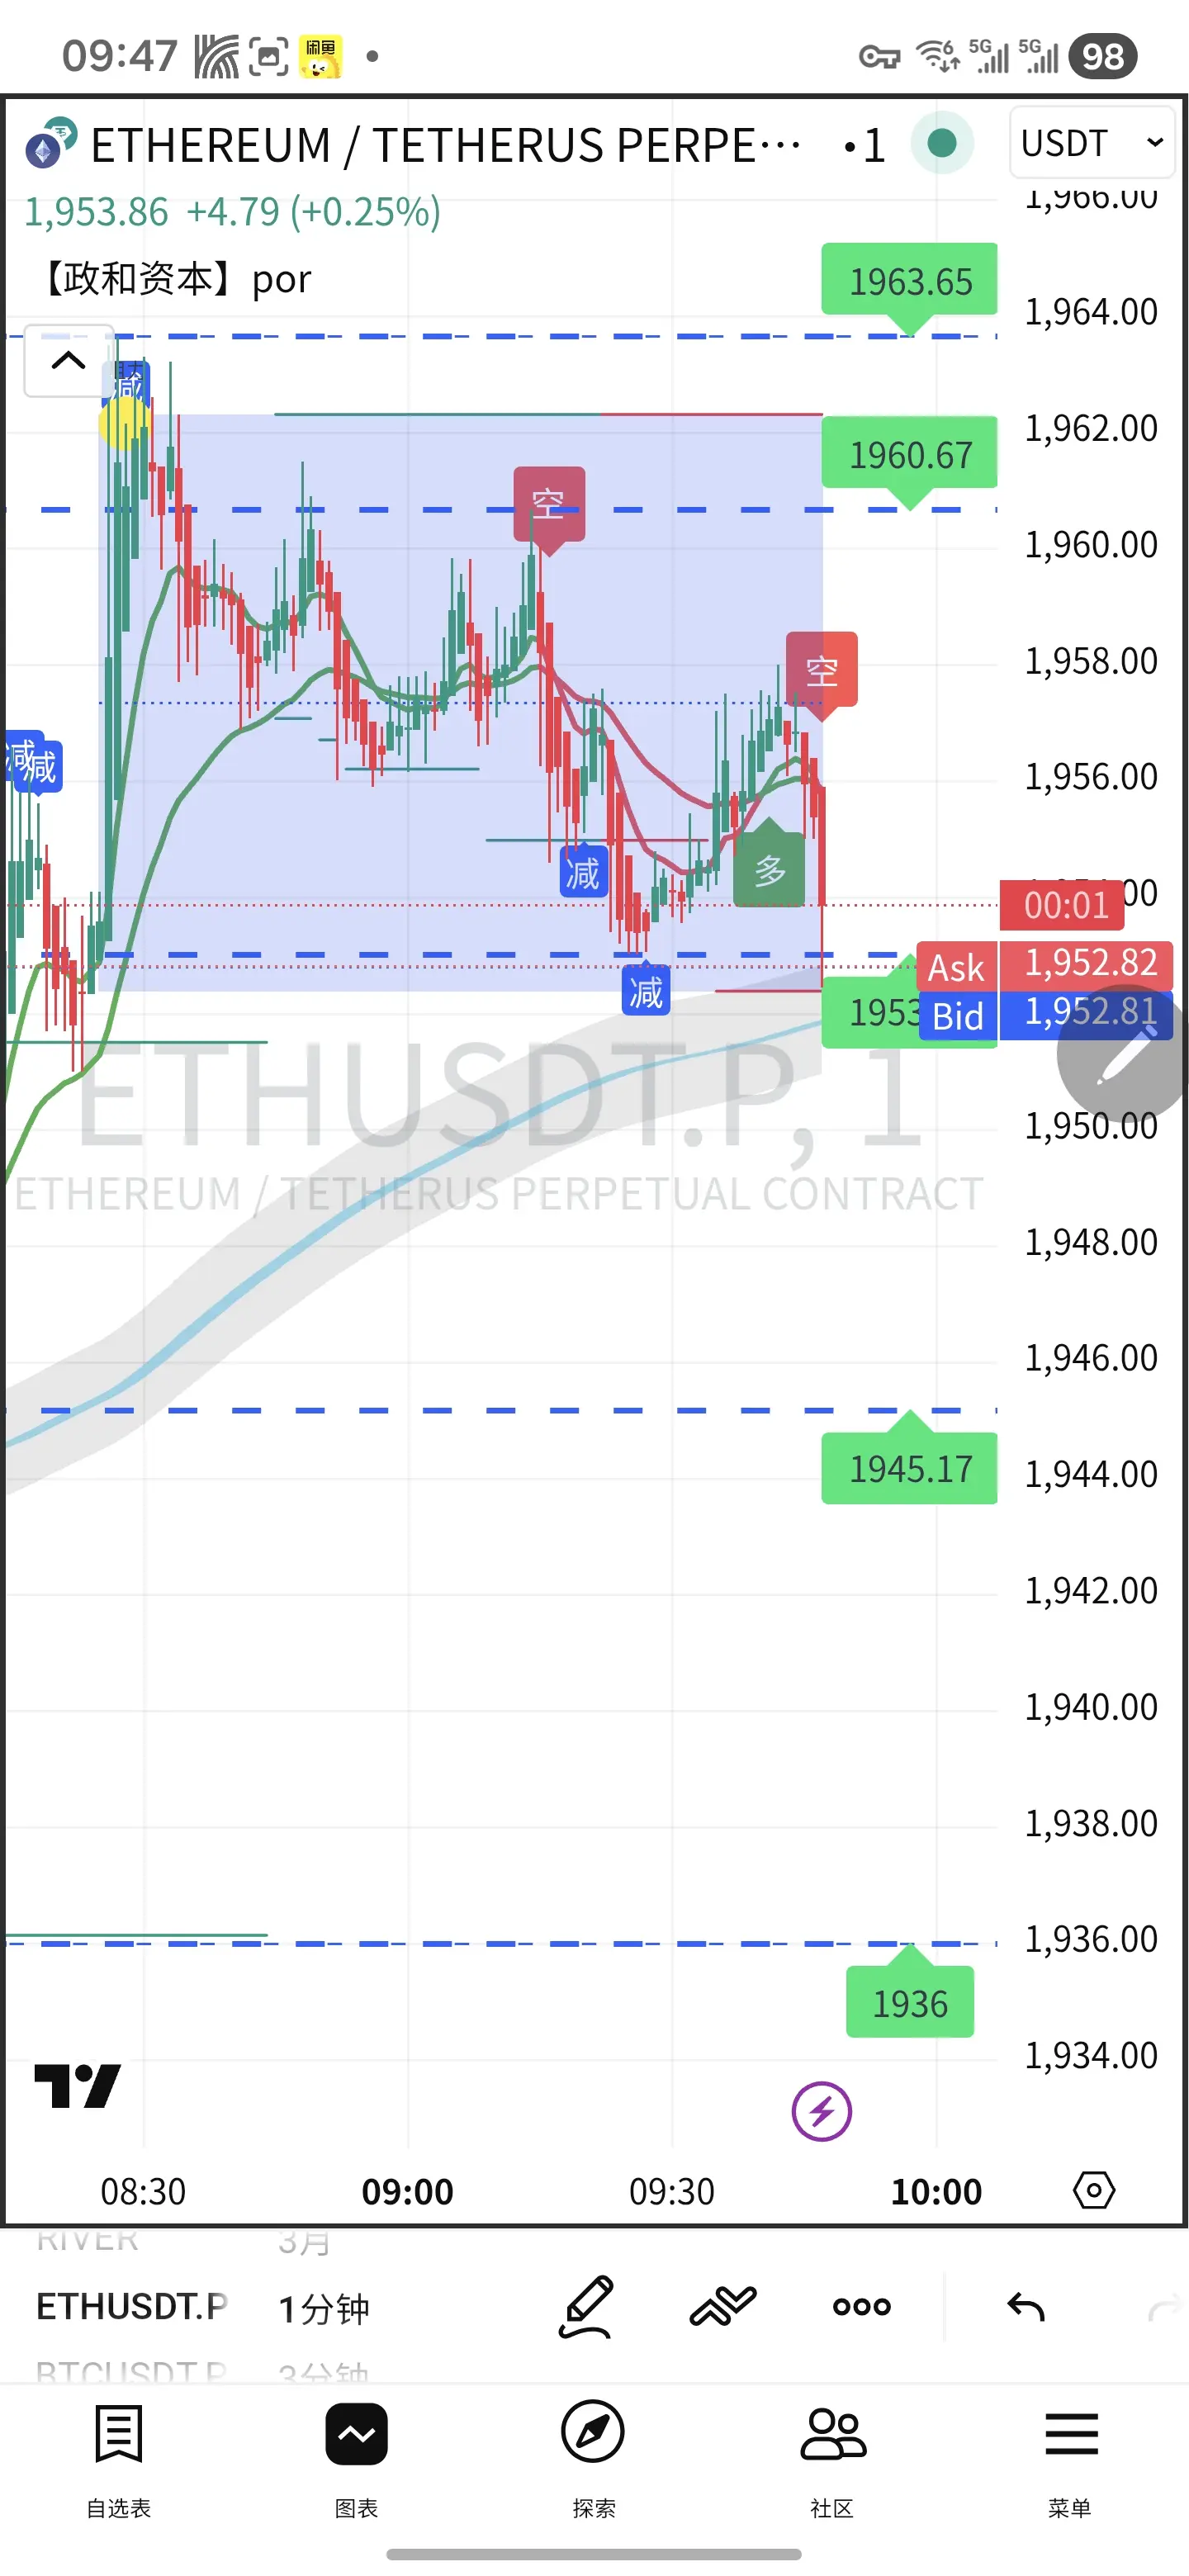
📊 2026-02-20 ETH Technical Analysis (As of this morning)
Current Price: Around $1,950
1. Daily Chart (Mid-term Trend)
- Trend: Mid-term downtrend, price below 50-day moving average (2,200) and 200-day moving average (2,400), overall weak
- RSI: About 27, deeply oversold, accumulation of rebound momentum
- Support/Resistance
- Strong Support: 1,920–1,940 (recent lows + concentrated chips)
- Secondary Support: 1,880 (break below targets 1,840–1,850)
- Resistance: 1,980 → 2,000 → 2,030
2. 4-Hour/Short-term (Intraday Trading)
- Pattern: Low-level oscillation correction, slight rebound a
ETH-0,52%
- Reward
- 3
- Comment
- Repost
- Share
#CelebratingNewYearOnGateSquare 🚀🔥
New Year, New Excitement, and Amazing Rewards with Gate.io!
The year 2026 has begun, and the Gate Square community is celebrating this new year with renewed enthusiasm. If you haven't joined the celebration yet, you're missing out on a lot!
🌟 Why Celebrate the New Year at Gate Square? (Details)
Gate.io always offers its users beneficial and exciting (attractive) offers. This new year, special (exclusive) activities are happening at Gate Square:
Exclusive Red Packets: Special Red Packets are being distributed to celebrate the new year.
Community

- Reward
- 5
- 4
- Repost
- Share
Discovery :
:
To The Moon 🌕View More
#CryptoSurvivalGuide Crypto Survival Guide: How to Navigate Volatility and Thrive in the Digital Asset World
The cryptocurrency market is one of the most exciting yet unforgiving financial arenas ever created. Prices can soar to unimaginable heights and collapse just as quickly, fortunes can be made or lost in weeks, and new technologies continuously reshape the landscape. For participants on platforms like Gate.io, survival is not about luck — it is about preparation, discipline, and adaptability.
Whether you are a beginner entering the space for the first time or an experienced trader weathe


- Reward
- 4
- 4
- Repost
- Share
Discovery:
2026 GOGOGO 👊View More
Nexus
Nexus
Created By@梢哥soo
Subscription Progress
0.00%
MC:
$0
More Tokens
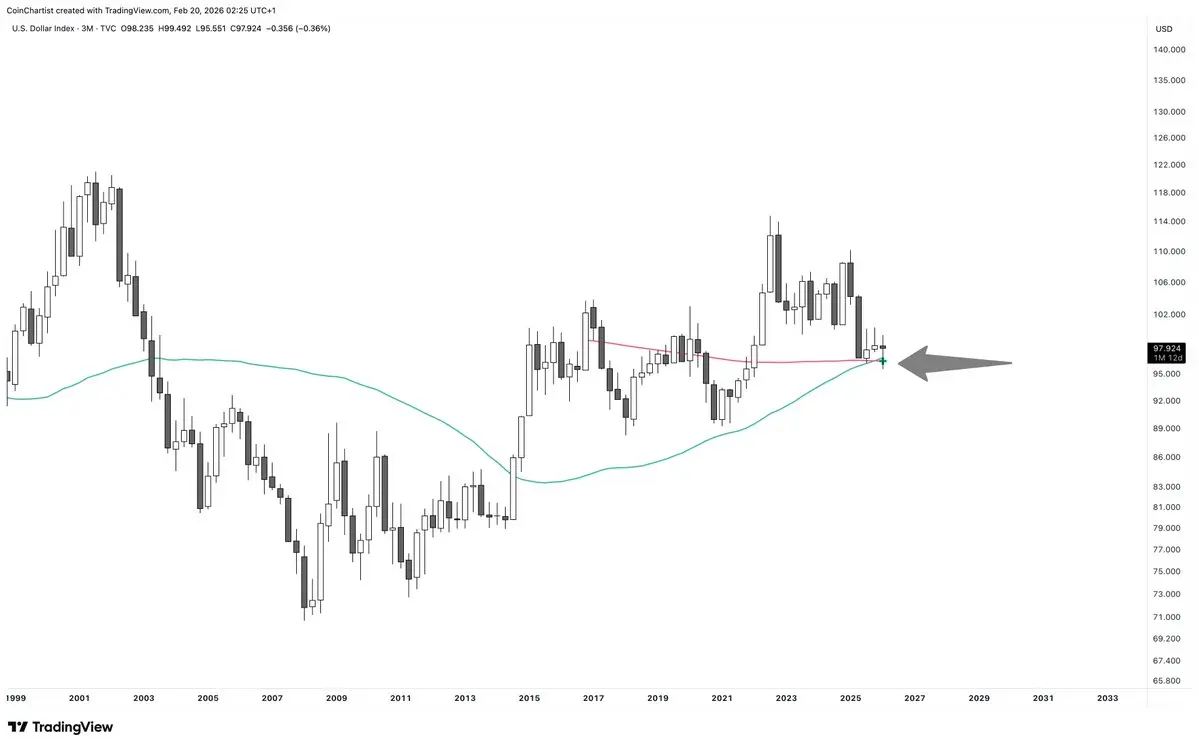
The DXY Dollar Currency Index has formed a Golden Cross on the quarterly (3M) timeframe
Data suggests that Golden/Death Crosses are most effective when price is near the Moving Averages
Price is right above them, retesting them as support for the last year and have held
Two years ago, I called attention to this impending Death Cross and said it was coming – now what exactly is it telling us?
Nothing good, I suspect
- Reward
- 2
- Comment
- Repost
- Share
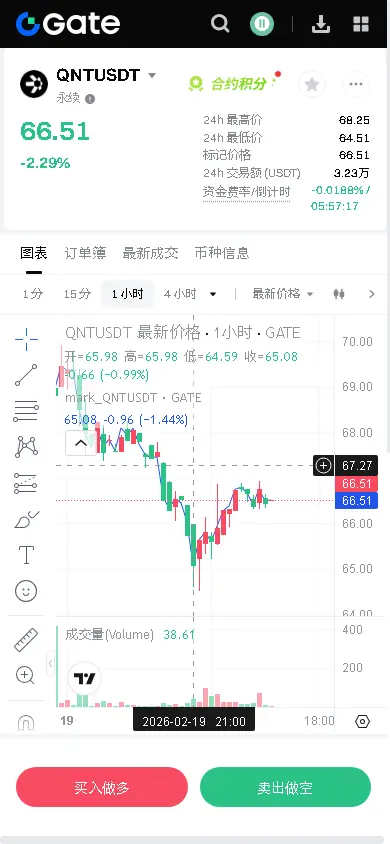
【$QNT Signal】1H level consolidation with decreasing volume, waiting for trend confirmation, dual-side pending orders lurking
$QNT The 1H level is consolidating with decreasing volume around 66.5, with the price suppressed below EMA20 (66.66), indicating insufficient short-term momentum. The 4H level remains in a downtrend channel, but after finding support near 65.9 (previous low), it rebounded, forming a potential double bottom pattern. Current open interest remains stable, the price has declined but did not trigger large-scale liquidations, suggesting selling pressure may be weakening. The
View Original$QNT The 1H level is consolidating with decreasing volume around 66.5, with the price suppressed below EMA20 (66.66), indicating insufficient short-term momentum. The 4H level remains in a downtrend channel, but after finding support near 65.9 (previous low), it rebounded, forming a potential double bottom pattern. Current open interest remains stable, the price has declined but did not trigger large-scale liquidations, suggesting selling pressure may be weakening. The
- Reward
- 2
- Comment
- Repost
- Share
#WhenisBestTimetoEntertheMarket #WhenIsBestTimeToEnterTheMarket
In the world of finance, timing is everything—but it’s never about luck. It’s about preparation, patience, and precision. Over the years, I’ve learned that the markets don’t reward haste; they reward discipline. They don’t care about fear, greed, or trending opinions—they respond to strategy, insight, and foresight.
I remember the first time I truly understood market cycles. Watching the charts, analyzing movements, and comparing history to present conditions—it was like reading a story written in numbers and patterns. Every dip,

- Reward
- 4
- 4
- Repost
- Share
Discovery:
To The Moon 🌕View More
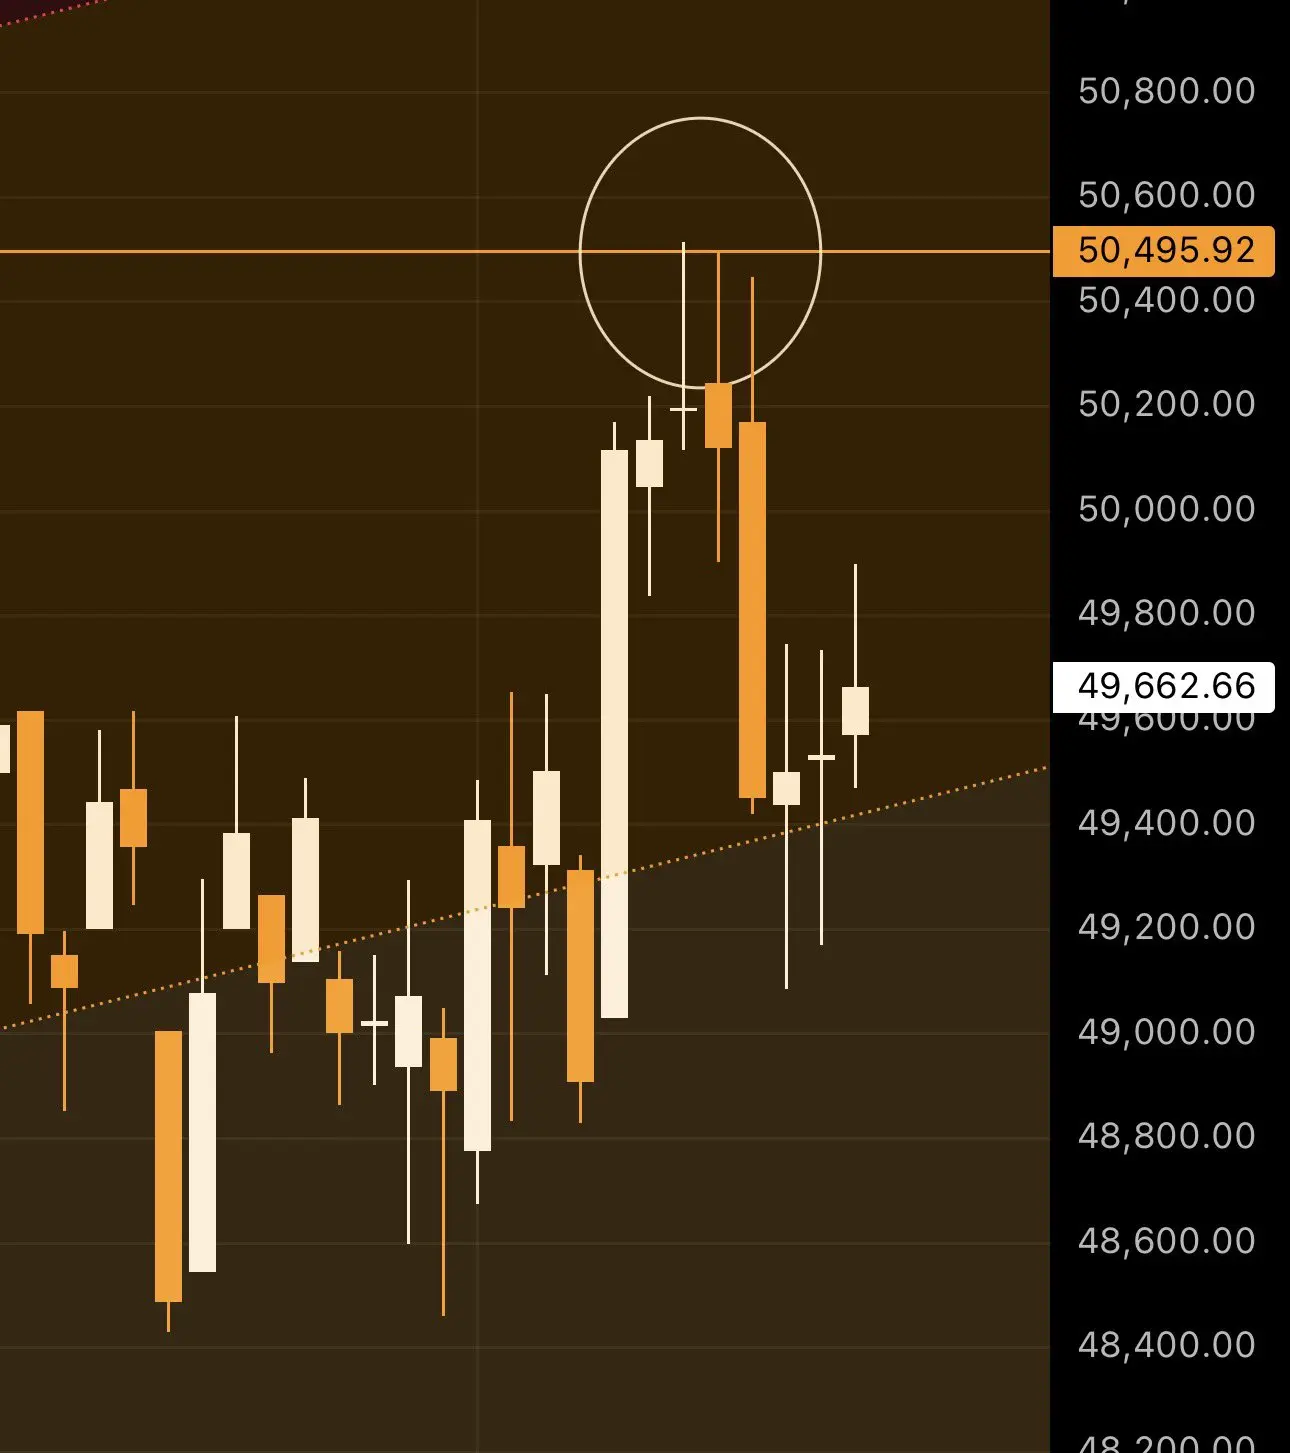
The Dow Jones target was precisely set at $50,495 exactly 11 months ago, on the day tariffs collapsed in April 2025. Its price was $38,000, and the targets for the S&P 500 and all markets respected the analysis and logic, responding to economic stimuli.
Economic improvement is reflected in GDP figures, decreasing inflation, and falling interest rates throughout 2025.
All markets respect the analysis, economic data, and stimuli,
but the cursed crypto market, full of manipulation, scams, and theft, operates in a parallel universe governed by CZ and a group of scammers.
Other markets are
View OriginalEconomic improvement is reflected in GDP figures, decreasing inflation, and falling interest rates throughout 2025.
All markets respect the analysis, economic data, and stimuli,
but the cursed crypto market, full of manipulation, scams, and theft, operates in a parallel universe governed by CZ and a group of scammers.
Other markets are
- Reward
- 2
- Comment
- Repost
- Share
📊 2026-02-20 BTC Technical Analysis (As of this morning)
Current Price: Around $66,000
1. Daily Chart (Trend Assessment)
- Trend: Medium-term downtrend, price below 50-day moving average (87,000) and 200-day moving average (102,000), overall weak
- RSI: About 15, deeply oversold (only seen during the 2018 bear market and March 2020), short-term rebound probability increases
- Support/Resistance
- Strong Support: 60,000–62,000 (consolidation zone + 200-week moving average)
- Secondary Support: 58,000 (if broken, then watch 49,000–52,000)
- Resistance: 68,000 → 70,000 → 75,000
2. Hourly
BTC0,92%
- Reward
- 3
- 1
- Repost
- Share
VictoryOfTheHeavenlyFattyPig:
Wishing you great wealth in the Year of the Horse 🐴#HongKongPlansNewVAGuidelines
Asia’s Capital of Digital Finance: Hong Kong’s New Virtual Asset Roadmap
In the opening months of 2026, the global financial ecosystem has turned its gaze toward the rising digital fortress of the East. The latest developments resonating under the #HongKongPlansNewVAGuidelines tag solidify the city's vision of being not just a trade hub, but a "legal sanctuary" for digital assets. As of February 2026, the Hong Kong Securities and Futures Commission (SFC) is redefining the boundaries of institutionalization in the virtual asset world with its newly released guide

- Reward
- 13
- 14
- Repost
- Share
YamahaBlue:
Diamond Hands 💎View More
High Volatility in BTC/ETH/SOL —washout or trend reversal
235
- Reward
- like
- Comment
- Repost
- Share

Load More
Join 40M users in our growing community
⚡️ Join 40M users in the crypto craze discussion
💬 Engage with your favorite top creators
👍 See what interests you
Trending Topics
View More242.62K Popularity
869.73K Popularity
10.63M Popularity
98.35K Popularity
513.42K Popularity
Hot Gate Fun
View More- MC:$2.44KHolders:10.00%
- MC:$2.44KHolders:10.00%
- MC:$2.44KHolders:10.00%
- MC:$2.43KHolders:00.00%
- MC:$0.1Holders:10.00%
News
View MoreTradFi上涨提醒:EURNZD上涨超0.5%
7 m
US Dollar Index (DXY) breaks through 98, with an intraday increase of 0.17%
8 m
Market Report: Top 5 cryptocurrencies by decline on February 20, 2026, with Arbitrum experiencing the largest drop.
29 m
Nick Timiraos: Forecast shows US December PCE inflation rose 0.37% month-on-month
32 m
Polymarket predicts that the probability of the United States confirming the existence of aliens before 2027 has surged to 22%.
36 m
Pin