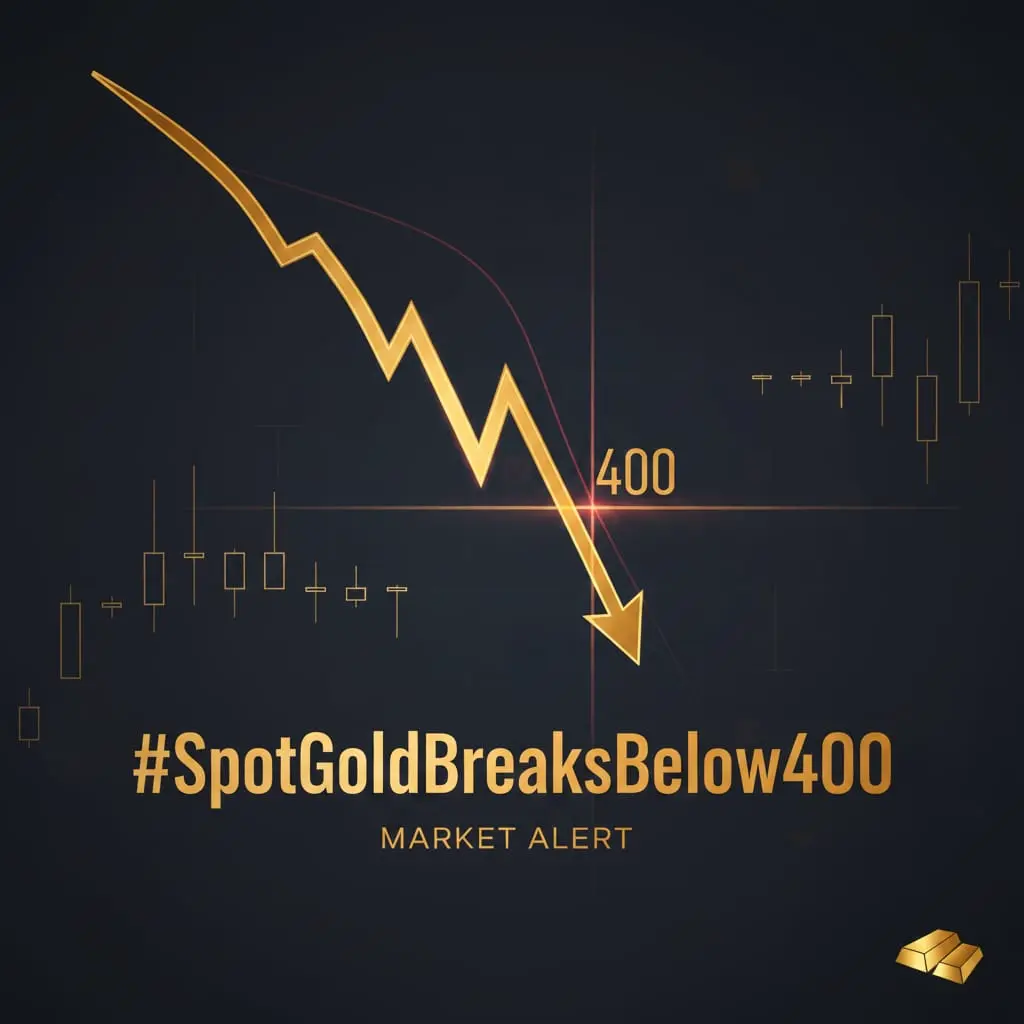
#SpotGoldBreaksBelow400
When the Unthinkable Becomes Reality
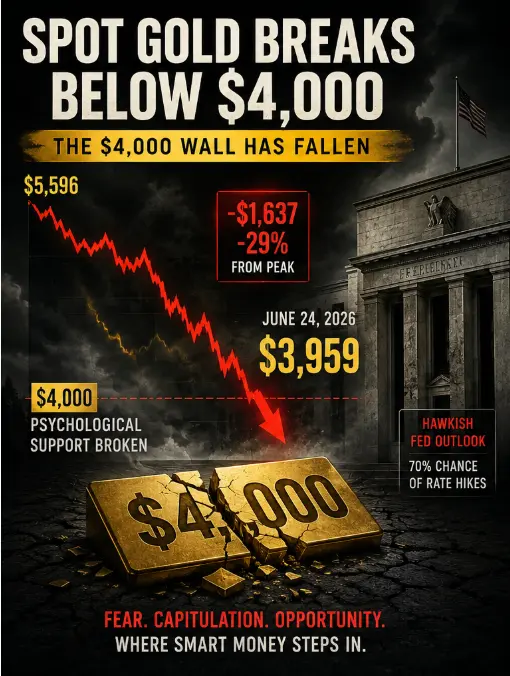
Seven months ago, gold touched $5,596 — a number that seemed to defy gravity. Traders called it "the new paradigm." Central banks were hoarding. ETFs were flooding in. The narrative was bulletproof: de-dollarization, geopolitical chaos, and infinite money printing would push gold to $6,000, then $8,000. Fast forward to June 24, 2026. Spot gold just traded at $3,959. A 29% collapse from the peak. The psychological $4,000 level — the floor that "could never break" — has shattered. This isn't just a price drop. This is a narrative collapse. And narrative collapses create the most asymmetric opportunities in markets.
The "Anchor-Trap" Framework: Understanding Why $4,000 Matters
I've developed a concept I call the "Anchor-Trap Framework" — a behavioral finance model explaining why certain price levels become self-fulfilling prophecies until they don't. Here's how it works: When an asset trades at a round number for an extended period, market participants anchor their expectations to that level. $4,000 wasn't just a price — it was a psychological contract between bulls and bears. Bulls saw it as "strong support, never tested." Bears saw it as "the line in the sand." For seven months, this anchor held. But when the Fed's dot plot revealed hawkish expectations — with markets now pricing in a 70% chance of rate hikes — the anchor snapped. The trap springs: everyone who bought at $4,100-$4,200 thinking they were getting "cheap gold" is now underwater. Their stops trigger. Momentum accelerates. The trap closes.
This is classic loss aversion bias meets herd behavior. Traders who swore they'd "never sell gold" are now panic-exiting. The same crowd that FOMO'd into $5,000+ is now capitulating at $4,000. This is where smart money steps in.
Current Market Structure: The Anatomy of a Breakdown
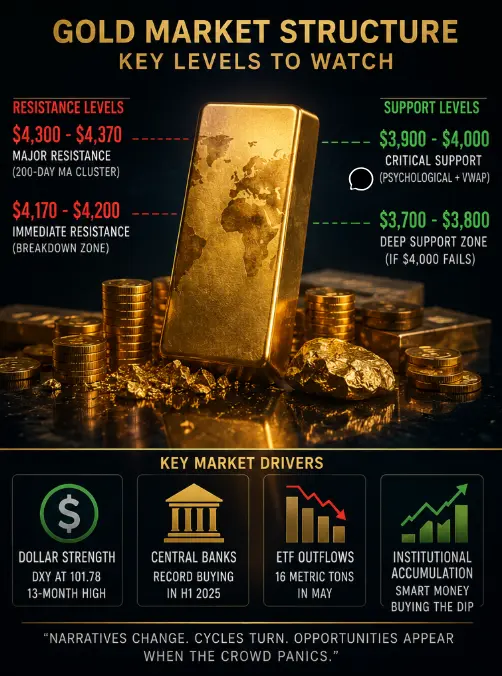
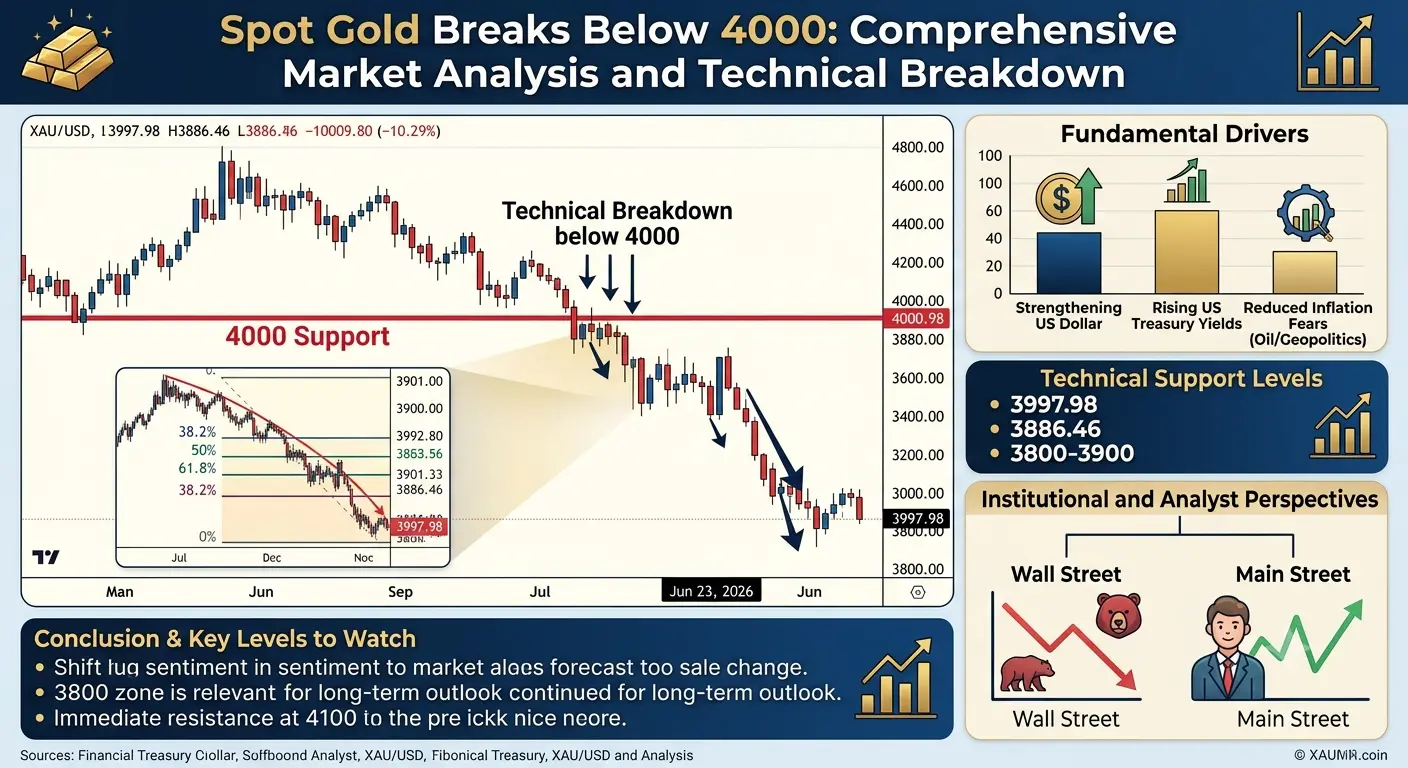
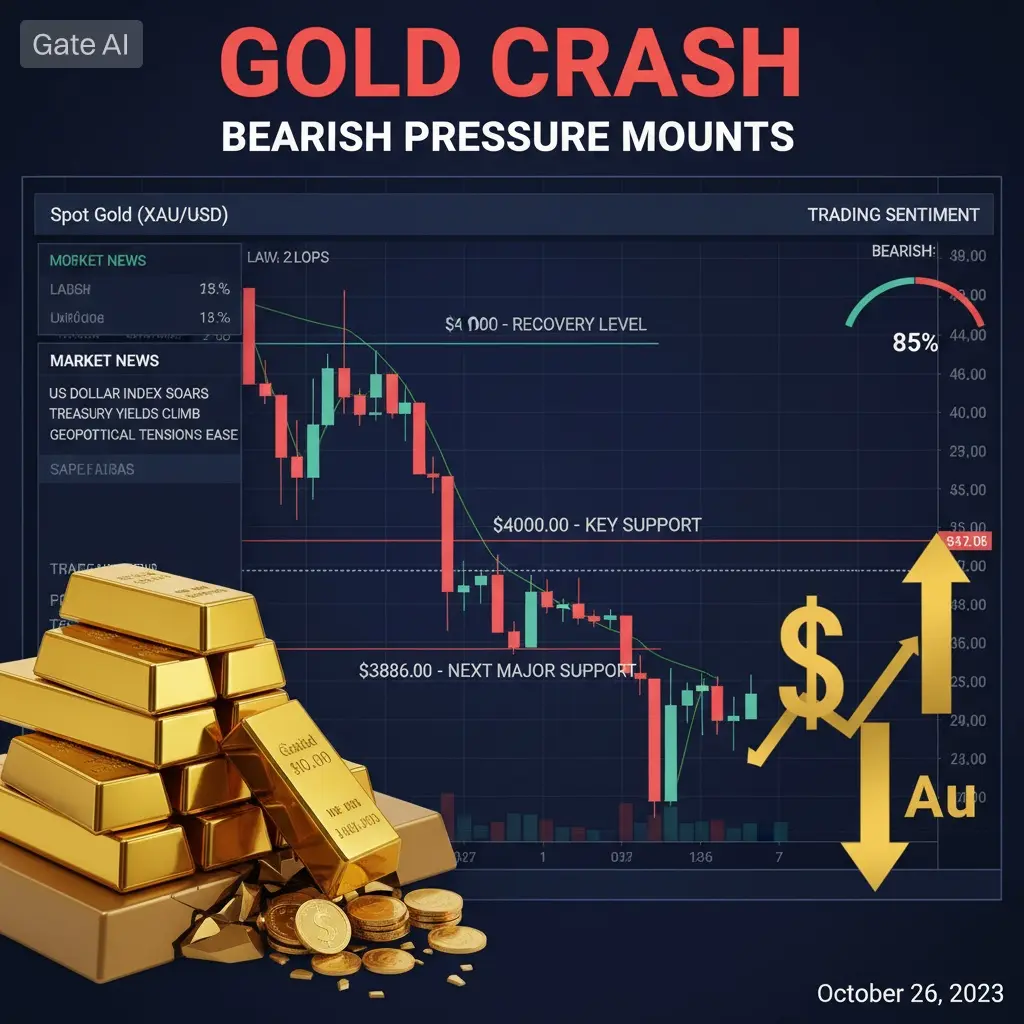
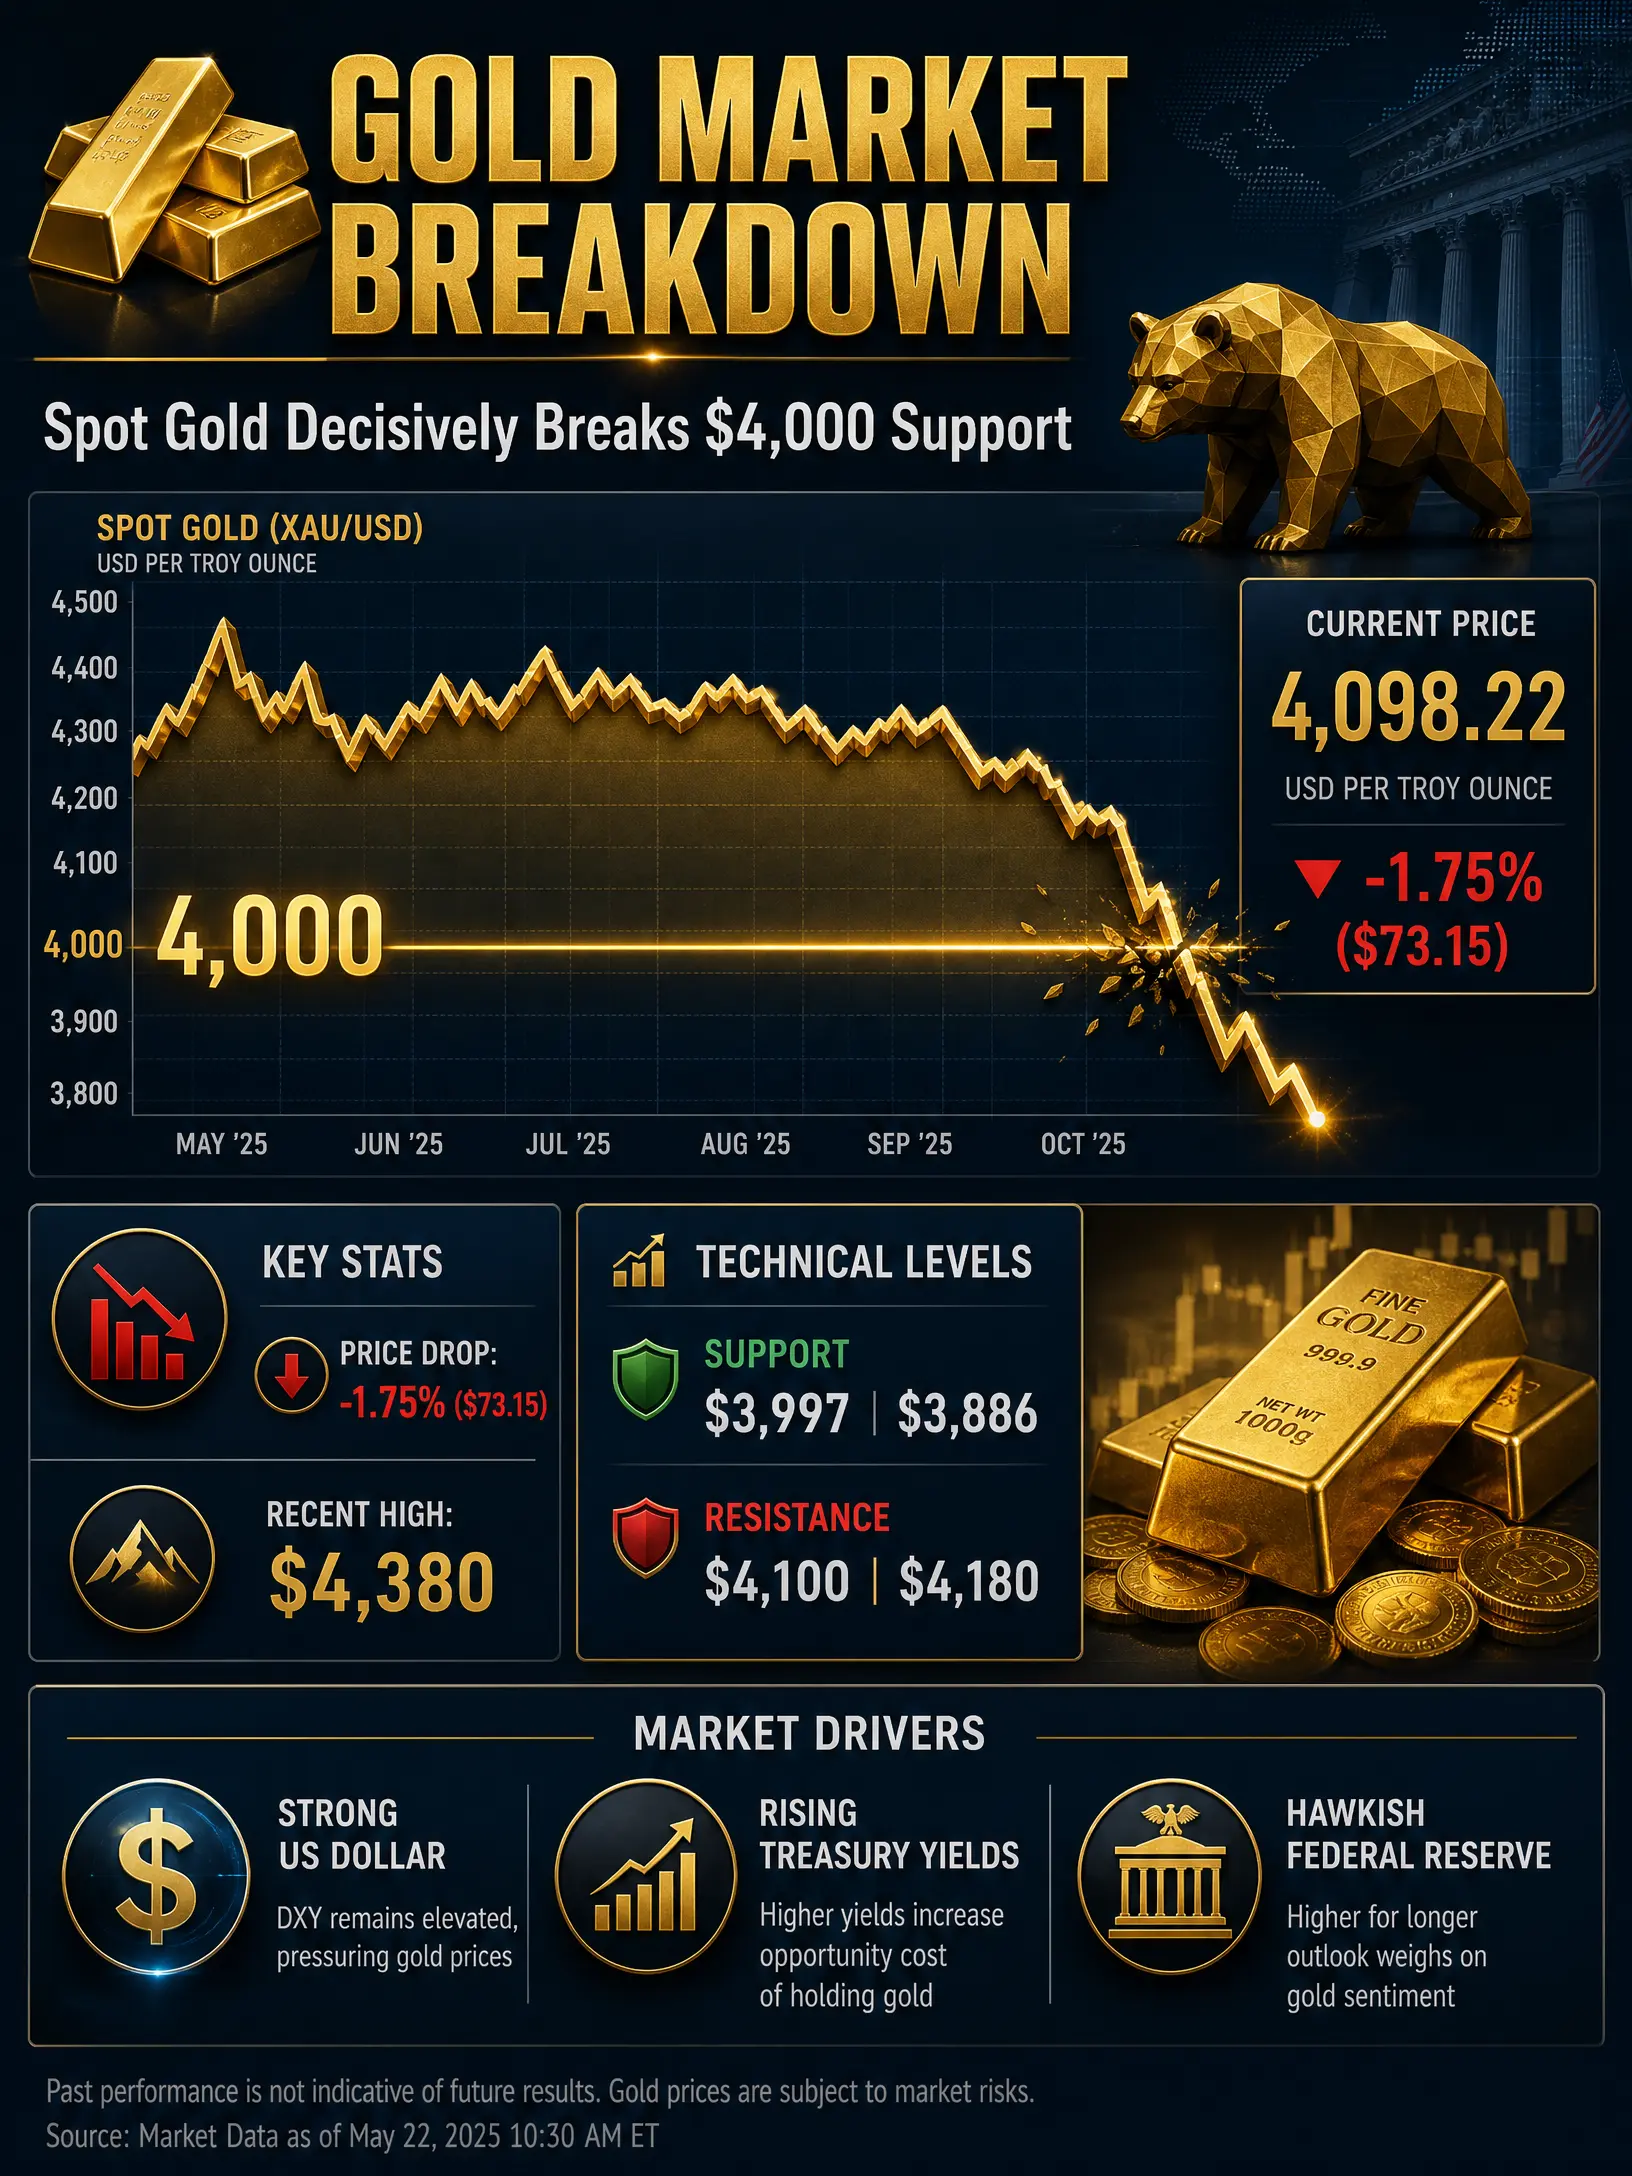
Price Action: Spot gold hit $3,959 on June 24 — the lowest since November 2025. The $4,000 level has been breached, but the market is currently trading around $4,006, showing a tentative bounce. This is crucial: we're seeing a "test and retest" pattern.
Key Levels (Based on Technical Analysis):
Critical Support Zone: $3,900-$4,000 (psychological + anchored VWAP)
Immediate Resistance: $4,170-$4,200 (previous breakdown zone)
Major Resistance: $4,300-$4,370 (200-day moving average cluster)
Deep Support: $3,700-$3,800 (if $4,000 fails decisively)
Buy/Sell Pressure Dynamics:
ETF Flows: Gold-backed ETFs saw net outflows of 16 metric tons in May, with continued outflows in early June. However, last week registered the strongest weekly inflows since mid-April — a potential early signal of institutional dip-buying
Institutional Positioning: COMEX net longs declined 2.5% in May to 466 tonnes, but managed money positions actually increased over three of four weeks — suggesting smart money is quietly accumulating while retail panics
Dollar Strength: DXY at 101.78 (13-month high) — the primary headwind. Every 50bps of Fed easing historically adds ~$120/oz to gold
Bull Case: Why This Could Be the Generational Buy
The Fed Pivot is Inevitable: Current market pricing of rate hikes assumes inflation from the Iran war persists. But energy shocks are temporary. When the Fed eventually pivots — and they will — gold's opportunity cost collapses. Goldman Sachs notes every 50bps of easing adds $120/oz. If we get 100bps of cuts in 2027, that's $240 of built-in upside.
Central Bank Demand is Structural: Central banks bought record amounts in H1 2025. This isn't trading flow — it's geopolitical diversification. Even if Western ETFs sell, Eastern central banks are buying. This creates a floor.
The $4,000 Trap Reversal: When a level that "could never break" breaks, it creates a washout. The weak hands are gone. The remaining holders are strong hands. This is the setup for a violent reversal.
Institutional Divergence: While retail panics, institutional managed money increased positions in May. Follow the smart money.
Target: $4,500-$4,700 by Q1 2027 if Fed pivots. $5,200+ if geopolitical escalation returns.
Bear Case: Why $3,500 is Possible
Fed Hawkishness is Real: The dot plot shows FOMC members leaning toward rate hikes. If the Fed actually hikes — not just talks about it — gold's carry cost rises. The opportunity cost of holding non-yielding assets becomes punitive.
Dollar Strength Persistence: DXY at 13-month highs. If the dollar breaks 105, gold could see $3,700-$3,800 rapidly. The Iran war inflation shock could force the Fed's hand.
ETF Outflow Cascade: If gold ETFs see sustained outflows — which is likely if rate hike expectations persist — the mechanical selling pressure could push gold to $3,700 before finding stability.
Technical Damage: Breaking $4,000 after seven months above it is significant. The path of least resistance is lower until proven otherwise.
Target: $3,700-$3,800 if $4,000 fails to reclaim. $3,500 if Fed hikes 50bps+.
Key Risks: What Could Invalidate Everything
Fed Policy Whiplash: The biggest risk is binary. If the Fed hikes — gold crashes. If they cut — gold rips. The June 24 price action is the market repricing this uncertainty.
Geopolitical De-escalation: If the Iran war cools and energy prices drop, inflation fears fade — but so does safe-haven demand. Gold could lose both narratives simultaneously.
Liquidity Events: If broader risk assets sell off (equities, crypto), gold could get caught in a "sell everything" cascade despite being a safe haven.
Technical Breakdown: A weekly close below $3,900 would confirm the bearish structure and likely trigger algorithmic selling to $3,700.
Trade Setup: Entry, Exit, and Risk Management
For Bulls (Long Bias):
Entry Zone: $3,950-$4,050 (current zone — scaling in)
Add Zone: $3,800-$3,900 (if we get a washout)
Stop Loss: $3,750 (below major structural support)
Target 1: $4,200 (reclaim of breakdown zone)
Target 2: $4,370 (200-day MA)
Target 3: $4,500-$4,700 (bull case realization)
For Bears (Short Bias):
Entry Zone: $4,150-$4,200 (resistance rejection)
Stop Loss: $4,300 (above key resistance)
Target 1: $3,900 (retest of breakdown)
Target 2: $3,750-$3,800 (deep support)
Risk Management: Position size for 2-3% account risk. This is a high-volatility environment. Gold's 30-day realized volatility has spiked. Use options if available to define risk.
The Behavioral Edge: What the Crowd is Getting Wrong
Right now, the crowd is trapped in recency bias — they can't imagine gold above $5,000 again because they just saw it at $3,959. But markets are mean-reverting machines. The same behavioral patterns that pushed gold to $5,600 (greed, FOMO, narrative chasing) will eventually return.
The smart play isn't to predict the Fed. It's to position for asymmetry. At $4,000, the risk/reward is shifting toward bulls — IF you can survive the volatility. The retail trader is selling. The institutional trader is quietly accumulating. Which side are you on?
⚠️ RISK WARNING
This analysis is for educational and informational purposes only and does not constitute financial advice. Trading gold CFDs and derivatives carries substantial risk of loss. Gold prices can be extremely volatile, and leverage amplifies both gains and losses. Past performance is not indicative of future results. The $4,000 level may hold or break — no analysis can predict the future with certainty. Only trade with capital you can afford to lose. Always use stop losses and proper risk management. This is not a recommendation to buy or sell any financial instrument.
When the Unthinkable Becomes Reality
Seven months ago, gold touched $5,596 — a number that seemed to defy gravity. Traders called it "the new paradigm." Central banks were hoarding. ETFs were flooding in. The narrative was bulletproof: de-dollarization, geopolitical chaos, and infinite money printing would push gold to $6,000, then $8,000. Fast forward to June 24, 2026. Spot gold just traded at $3,959. A 29% collapse from the peak. The psychological $4,000 level — the floor that "could never break" — has shattered. This isn't just a price drop. This is a narrative collapse. And narrative collapses create the most asymmetric opportunities in markets.
The "Anchor-Trap" Framework: Understanding Why $4,000 Matters
I've developed a concept I call the "Anchor-Trap Framework" — a behavioral finance model explaining why certain price levels become self-fulfilling prophecies until they don't. Here's how it works: When an asset trades at a round number for an extended period, market participants anchor their expectations to that level. $4,000 wasn't just a price — it was a psychological contract between bulls and bears. Bulls saw it as "strong support, never tested." Bears saw it as "the line in the sand." For seven months, this anchor held. But when the Fed's dot plot revealed hawkish expectations — with markets now pricing in a 70% chance of rate hikes — the anchor snapped. The trap springs: everyone who bought at $4,100-$4,200 thinking they were getting "cheap gold" is now underwater. Their stops trigger. Momentum accelerates. The trap closes.
This is classic loss aversion bias meets herd behavior. Traders who swore they'd "never sell gold" are now panic-exiting. The same crowd that FOMO'd into $5,000+ is now capitulating at $4,000. This is where smart money steps in.
Current Market Structure: The Anatomy of a Breakdown
Price Action: Spot gold hit $3,959 on June 24 — the lowest since November 2025. The $4,000 level has been breached, but the market is currently trading around $4,006, showing a tentative bounce. This is crucial: we're seeing a "test and retest" pattern.
Key Levels (Based on Technical Analysis):
Critical Support Zone: $3,900-$4,000 (psychological + anchored VWAP)
Immediate Resistance: $4,170-$4,200 (previous breakdown zone)
Major Resistance: $4,300-$4,370 (200-day moving average cluster)
Deep Support: $3,700-$3,800 (if $4,000 fails decisively)
Buy/Sell Pressure Dynamics:
ETF Flows: Gold-backed ETFs saw net outflows of 16 metric tons in May, with continued outflows in early June. However, last week registered the strongest weekly inflows since mid-April — a potential early signal of institutional dip-buying
Institutional Positioning: COMEX net longs declined 2.5% in May to 466 tonnes, but managed money positions actually increased over three of four weeks — suggesting smart money is quietly accumulating while retail panics
Dollar Strength: DXY at 101.78 (13-month high) — the primary headwind. Every 50bps of Fed easing historically adds ~$120/oz to gold
Bull Case: Why This Could Be the Generational Buy
The Fed Pivot is Inevitable: Current market pricing of rate hikes assumes inflation from the Iran war persists. But energy shocks are temporary. When the Fed eventually pivots — and they will — gold's opportunity cost collapses. Goldman Sachs notes every 50bps of easing adds $120/oz. If we get 100bps of cuts in 2027, that's $240 of built-in upside.
Central Bank Demand is Structural: Central banks bought record amounts in H1 2025. This isn't trading flow — it's geopolitical diversification. Even if Western ETFs sell, Eastern central banks are buying. This creates a floor.
The $4,000 Trap Reversal: When a level that "could never break" breaks, it creates a washout. The weak hands are gone. The remaining holders are strong hands. This is the setup for a violent reversal.
Institutional Divergence: While retail panics, institutional managed money increased positions in May. Follow the smart money.
Target: $4,500-$4,700 by Q1 2027 if Fed pivots. $5,200+ if geopolitical escalation returns.
Bear Case: Why $3,500 is Possible
Fed Hawkishness is Real: The dot plot shows FOMC members leaning toward rate hikes. If the Fed actually hikes — not just talks about it — gold's carry cost rises. The opportunity cost of holding non-yielding assets becomes punitive.
Dollar Strength Persistence: DXY at 13-month highs. If the dollar breaks 105, gold could see $3,700-$3,800 rapidly. The Iran war inflation shock could force the Fed's hand.
ETF Outflow Cascade: If gold ETFs see sustained outflows — which is likely if rate hike expectations persist — the mechanical selling pressure could push gold to $3,700 before finding stability.
Technical Damage: Breaking $4,000 after seven months above it is significant. The path of least resistance is lower until proven otherwise.
Target: $3,700-$3,800 if $4,000 fails to reclaim. $3,500 if Fed hikes 50bps+.
Key Risks: What Could Invalidate Everything
Fed Policy Whiplash: The biggest risk is binary. If the Fed hikes — gold crashes. If they cut — gold rips. The June 24 price action is the market repricing this uncertainty.
Geopolitical De-escalation: If the Iran war cools and energy prices drop, inflation fears fade — but so does safe-haven demand. Gold could lose both narratives simultaneously.
Liquidity Events: If broader risk assets sell off (equities, crypto), gold could get caught in a "sell everything" cascade despite being a safe haven.
Technical Breakdown: A weekly close below $3,900 would confirm the bearish structure and likely trigger algorithmic selling to $3,700.
Trade Setup: Entry, Exit, and Risk Management
For Bulls (Long Bias):
Entry Zone: $3,950-$4,050 (current zone — scaling in)
Add Zone: $3,800-$3,900 (if we get a washout)
Stop Loss: $3,750 (below major structural support)
Target 1: $4,200 (reclaim of breakdown zone)
Target 2: $4,370 (200-day MA)
Target 3: $4,500-$4,700 (bull case realization)
For Bears (Short Bias):
Entry Zone: $4,150-$4,200 (resistance rejection)
Stop Loss: $4,300 (above key resistance)
Target 1: $3,900 (retest of breakdown)
Target 2: $3,750-$3,800 (deep support)
Risk Management: Position size for 2-3% account risk. This is a high-volatility environment. Gold's 30-day realized volatility has spiked. Use options if available to define risk.
The Behavioral Edge: What the Crowd is Getting Wrong
Right now, the crowd is trapped in recency bias — they can't imagine gold above $5,000 again because they just saw it at $3,959. But markets are mean-reverting machines. The same behavioral patterns that pushed gold to $5,600 (greed, FOMO, narrative chasing) will eventually return.
The smart play isn't to predict the Fed. It's to position for asymmetry. At $4,000, the risk/reward is shifting toward bulls — IF you can survive the volatility. The retail trader is selling. The institutional trader is quietly accumulating. Which side are you on?
⚠️ RISK WARNING
This analysis is for educational and informational purposes only and does not constitute financial advice. Trading gold CFDs and derivatives carries substantial risk of loss. Gold prices can be extremely volatile, and leverage amplifies both gains and losses. Past performance is not indicative of future results. The $4,000 level may hold or break — no analysis can predict the future with certainty. Only trade with capital you can afford to lose. Always use stop losses and proper risk management. This is not a recommendation to buy or sell any financial instrument.