Scan to Download Gate App
qrCode
More Download Options
Don't remind me again today
BankOfChinaReview
vip
Market Analyst
Futures Trading Strategist
Peak Tier 5
☞ Live stream every night at 11:00! No highs or lows in the heart, no prices in the heart, trade as you wish. short-term offense trend Be the strongest suckers, be the fastest sickle.
Pin
Everyone wants an analysis of the price trend of a certain 币.
You can type the coin names in the comment area!
Give it to everyone after liking and commenting! 👌
View Original
  • Reward
  • 7
  • Repost
  • Share
Fengyavip:
Where can I learn this subscription? I can't find anyone at all, when are you online?
View More
BTC Market Analysis on October 13
1. Trend Analysis
· The bearish pattern remains: the price is below all EMAs, showing a complete bearish arrangement.
· Interval fluctuation characteristics: Fluctuating and consolidating in the range of 100,680-102,575
· Key support test: Price found support at 100,680.0 (24-hour low)
· The moving average pressure is evident: EMAs across all timeframes are showing a downward trend, indicating strong resistance.
2. MACD Indicator Analysis
· Short selling momentum continues:
· The MACD value is -205.0, the DIF is -2,537.8, both are deep negative values.
· T
BTC-0.26%
View Original
post-image
  • Reward
  • Comment
  • Repost
  • Share
ETH Market Analysis on October 8
1. Trend Analysis
· Oversold rebound confirmation: A single-day surge of 4.79%, strongly rebounding from the low of 3,271.69
· Key level breakout: Price has broken above EMA5(3,459.31), and is currently testing this key resistance.
· The bearish pattern remains: still below key moving averages such as EMA10, EMA30, and EMA72.
· Positive signal: Price has risen above EMA180(3,650.20)
2. MACD Indicator Analysis - Important Trend Reversal Signals
· Bullish divergence golden cross formation:
· DIF(+86.32) has clearly crossed above DEA(-142.25)
· Although the MA
ETH2.24%
View Original
post-image
  • Reward
  • Comment
  • Repost
  • Share
BTC Market Analysis on October 6
1. Trend Analysis
· Clear bearish pattern: Price is below all EMAs, showing a complete bearish arrangement.
· Range fluctuation characteristics: narrow fluctuations within the range of 102,665-104,499
· Key level: Price found support above the previous low of 101,553.1
· Moving Average Resistance: All periods of EMA are showing a downward trend, indicating strong resistance.
2. MACD Indicator Analysis
· Short selling momentum continues but is slowing down:
· The MACD value is -68.1, relatively small, indicating a slowdown in downward momentum.
· DIF and DEA
BTC-0.26%
View Original
post-image
  • Reward
  • Comment
  • Repost
  • Share
BTC November 5 Market Analysis
1. Trend Analysis
· Strong bearish pattern: The price is below all EMAs, showing a perfect bearish alignment.
· Deep correction status: dropped from a high of 130,934.3 to the current 101,621.0, a decline of over 22%.
· Key support test: The price rebounded after finding support at 98,889.0 (24-hour low)
· Serious moving average suppression: All period EMAs are showing a downward trend, with multiple resistances.
2. MACD Indicator Analysis
· Strong bearish momentum:
· The MACD value is -304.6, the DEA is -1467.6, both are deep negative values.
· The downward
BTC-0.26%
View Original
post-image
  • Reward
  • 1
  • Repost
  • Share
Syriavip:
I seek forgiveness from Allah the Almighty and I repent to Him.
BTC Market Analysis on October 31
1. Trend Analysis
· Key position contest: The current price of 109,268.6 is almost overlapping with the EMA180 at 109,294.9, testing this important long-term support.
· Short selling pressure still exists: the price is below EMA5, EMA10, EMA30, and EMA72, indicating a weak short-term trend.
· Signs of rebound: The price has rebounded from the low of 106,236.1 to the current level, indicating that buying pressure has started to come in.
· Deep pullback status: down from the high point of 128,615.2 to the current level, a decline of about 15%
2. MACD Indicator A
BTC-0.26%
View Original
post-image
  • Reward
  • 1
  • Repost
  • Share
ETH Market Analysis on October 30
1. Trend Analysis
· The bearish pattern remains unchanged: the price is still below all short to medium-term EMAs.
· Key level breakout: The price rebounded from the low of 3,835.10 to the current 3,942.01, recovering part of the decline.
· Moving Average Resistance: EMA5, EMA10, EMA20 form a dense resistance zone
· Long-term support is effective: EMA180(3,660.81) provides strong support.
2. MACD Indicator Analysis - Important Trend Reversal Signal
· Golden cross preliminary formation:
· DIF(-6.62) has crossed above DEA(-7.07)
· Although the MACD histogram
ETH2.24%
View Original
post-image
  • Reward
  • Comment
  • Repost
  • Share
  • Reward
  • Comment
  • Repost
  • Share
The reason you are reluctant to set a stop loss is that you are using "hope" instead of "strategy."
View Original
post-image
  • Reward
  • Comment
  • Repost
  • Share
ETH Market Analysis on October 23
#ETH反弹在即?
1. Trend Analysis
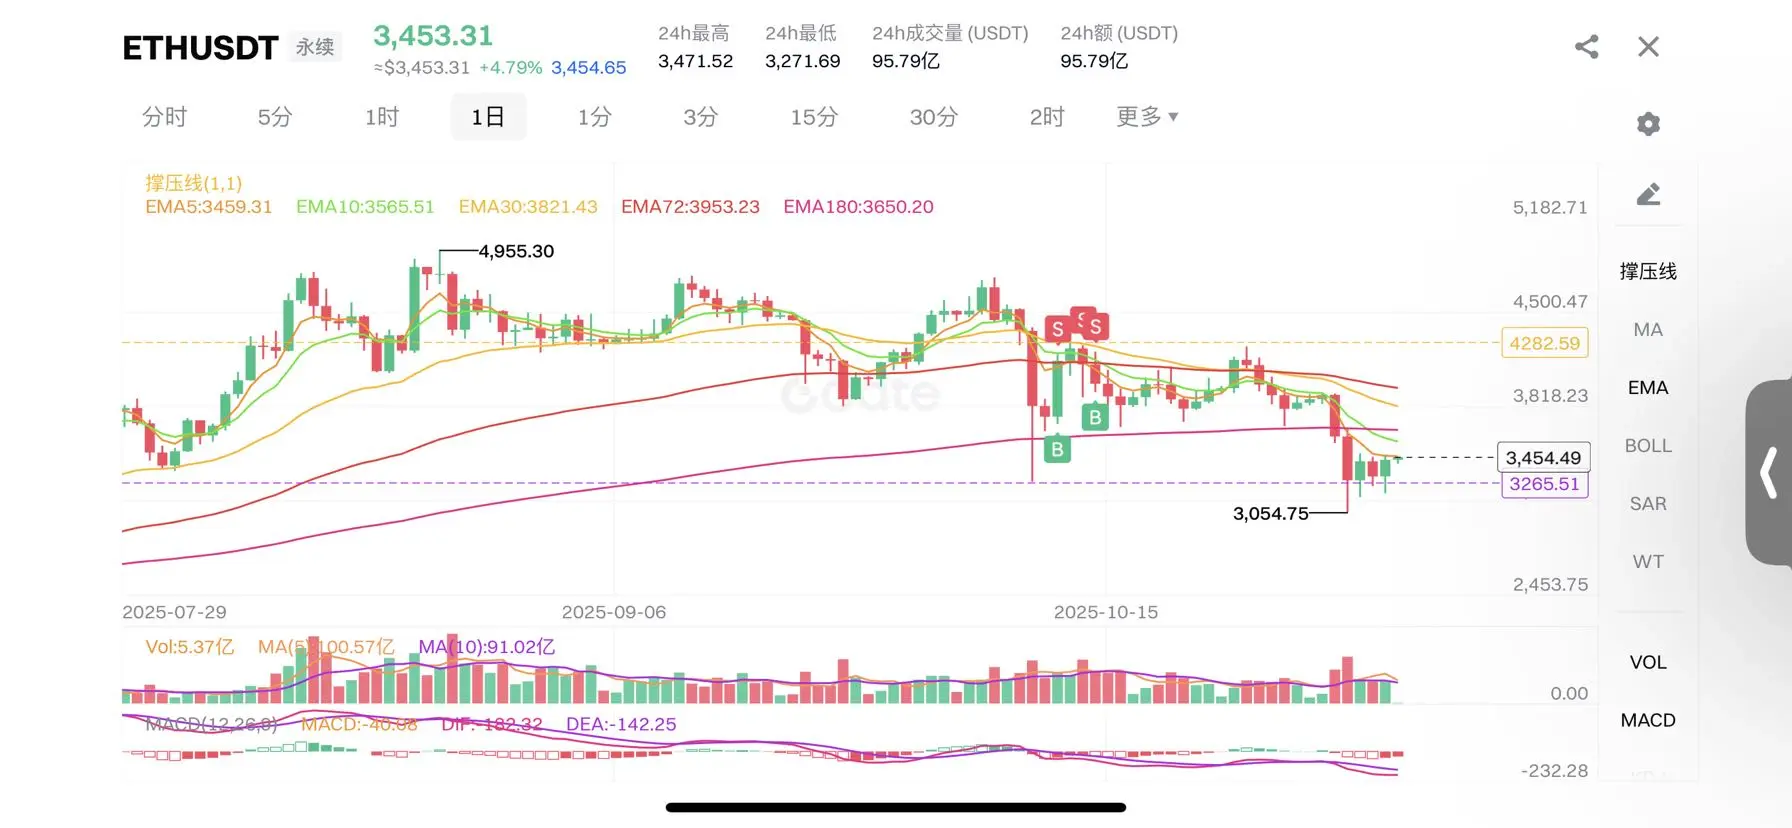
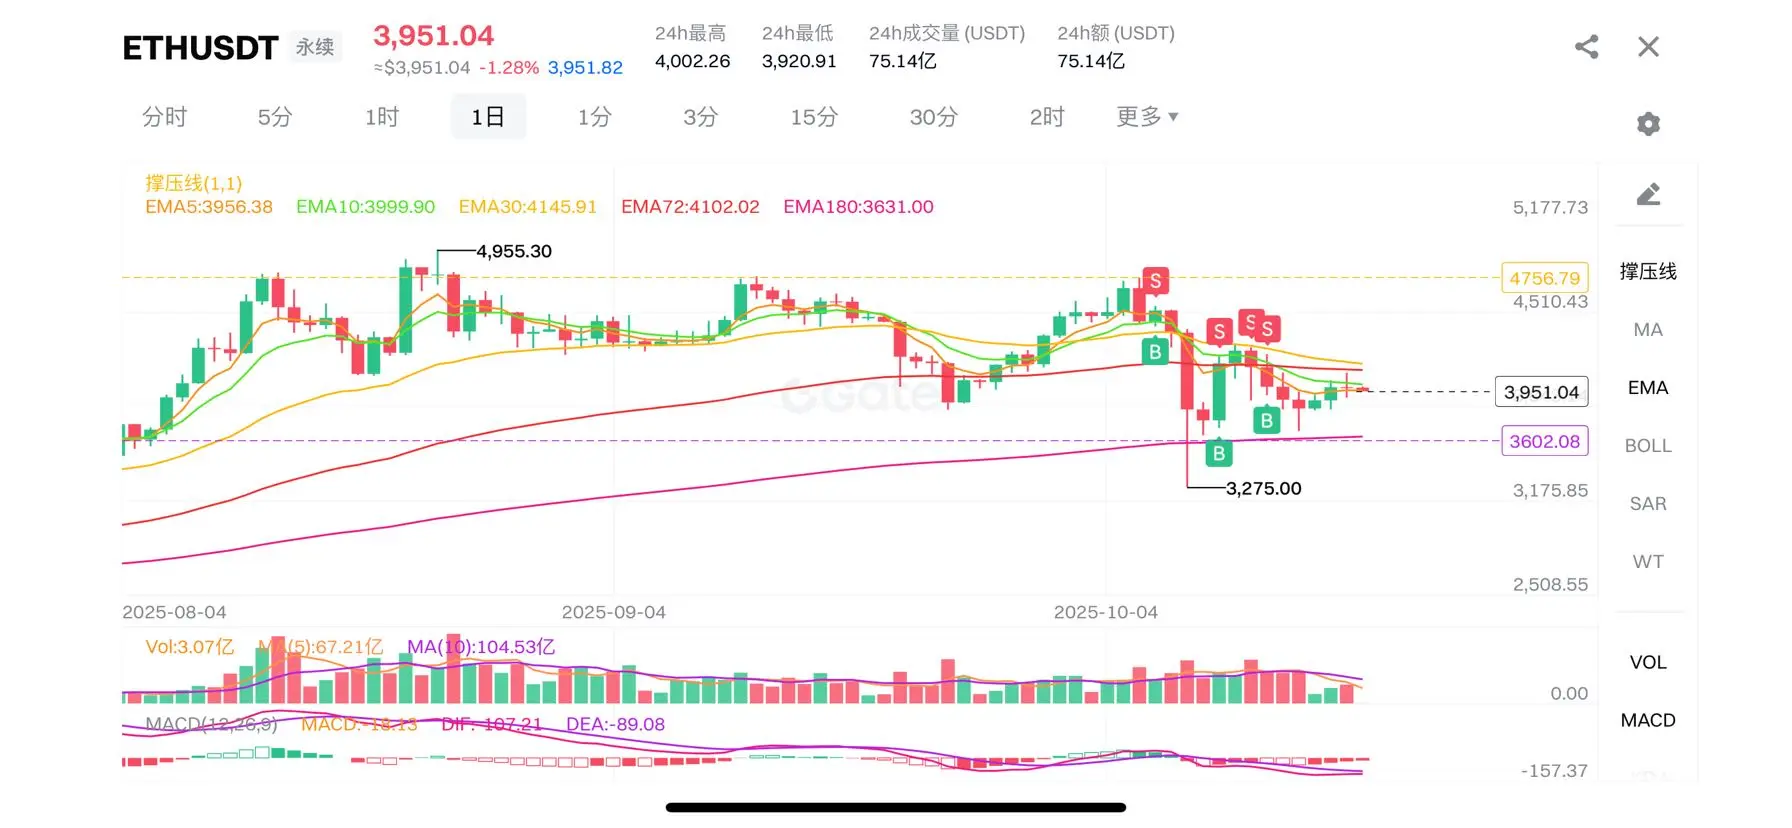
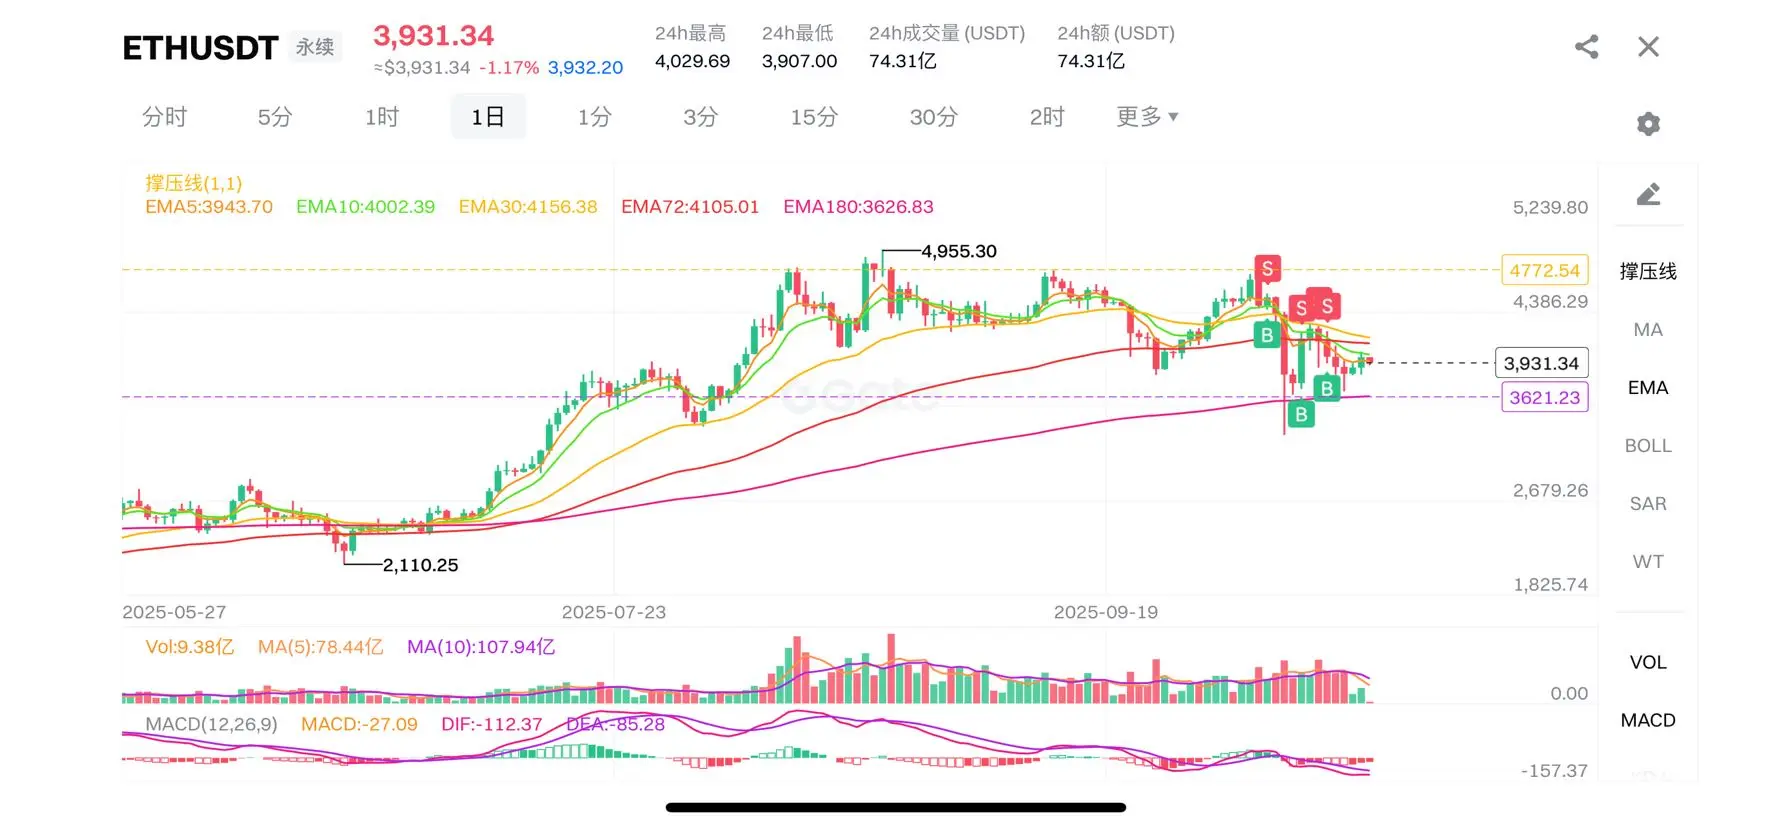
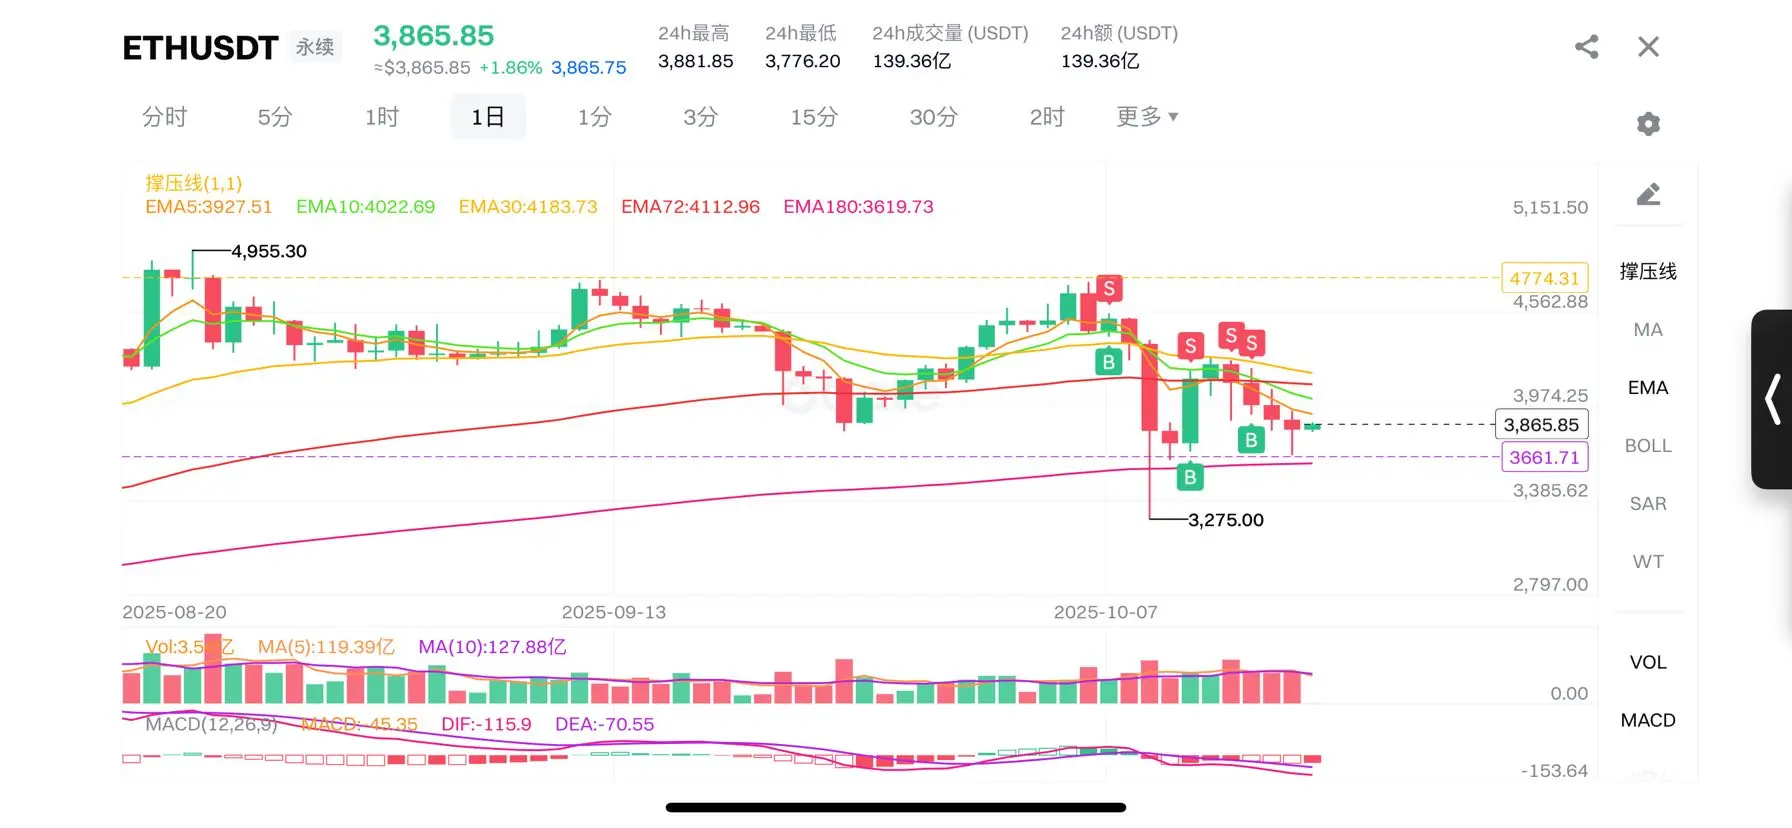
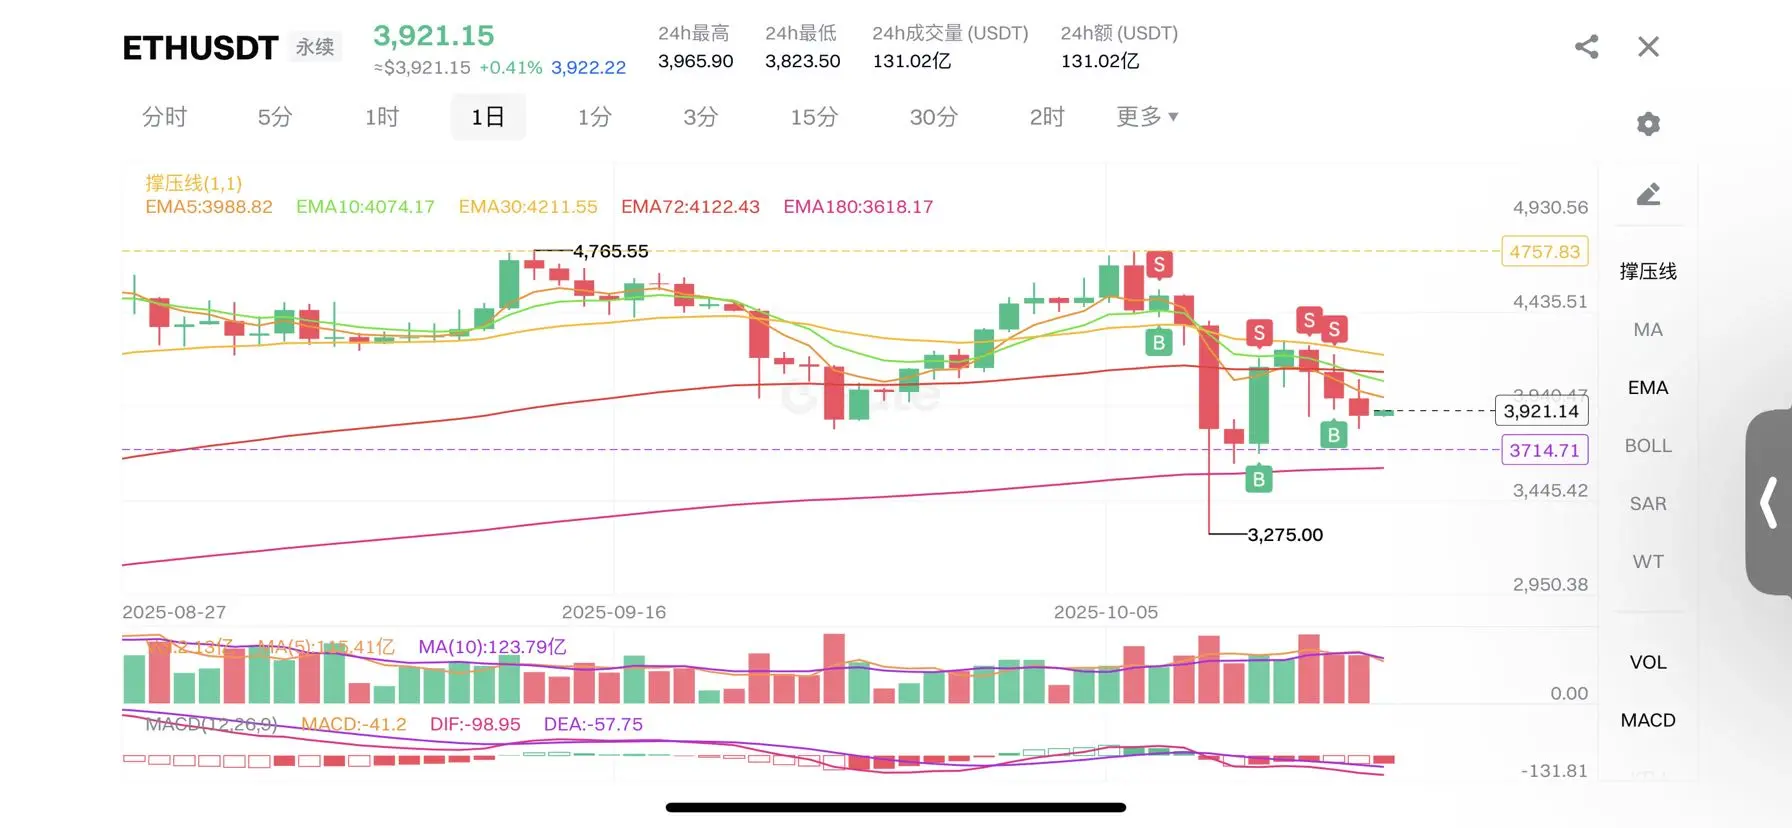
· Bearish pattern is solid: The price is below all short- to medium-term EMAs, showing a standard bearish arrangement.
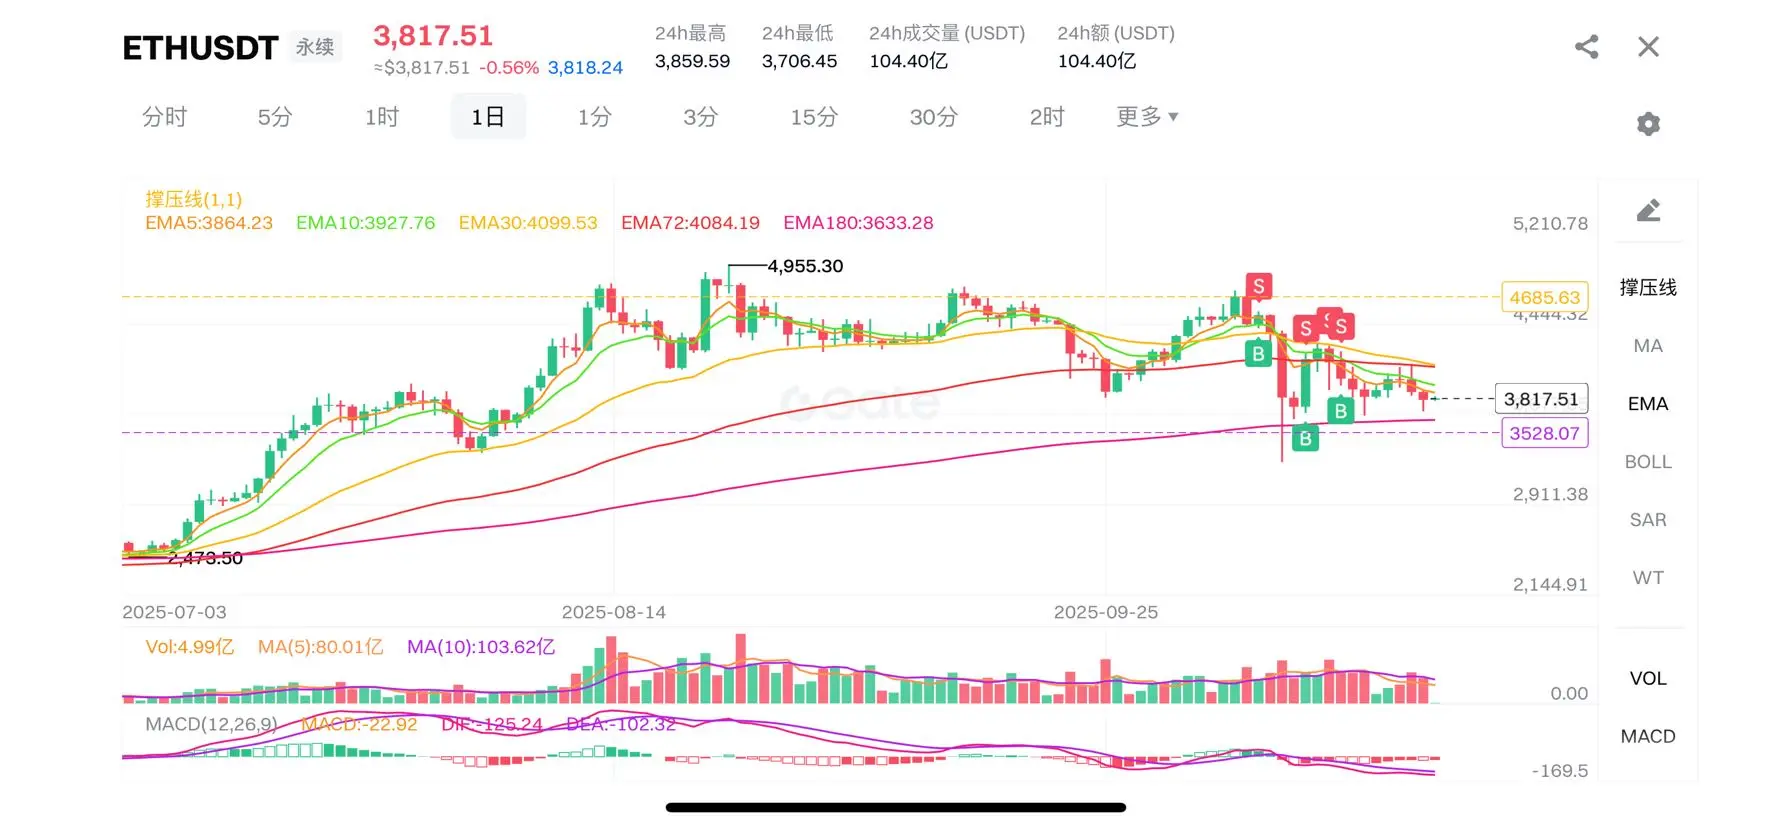
· Deep pullback confirmation: dropped from the high of 4,666.63 to the current 3,817.51, a decline of over 18%
· Key position: The price is fluctuating in the range of 3,706-3,859, testing the support below.
· Unique support: EMA180(3,633.28) remains an important long-term support.
2. MACD Indicator Analysis
· Short selling momentum continues:
· DIF(-125.24) < DEA(-102.34), the MACD histogram is negative (-22.92)
ETH2.24%
View Original
post-image
  • Reward
  • Comment
  • Repost
  • Share
Self-esteem is the most expensive luxury in trading. The market specializes in treating all forms of disobedience. #ETH反弹在即?
ETH2.24%
View Original
post-image
  • Reward
  • Comment
  • Repost
  • Share
ETH October 22 Market Analysis
1. Trend Analysis
· Strengthening of the bearish pattern: The price has fallen below all medium and short-term EMAs, showing a complete bearish arrangement.
· Crash confirmed: A single-day drop of 5.5%, quickly falling from a high of 4,109 to 3,855.
· Key support test: Testing the key support at 3,818.30 (24-hour low)
· Only defense line: only EMA180(3,632.47) still provides long-term support.
2. MACD Indicator Analysis
· Strong bearish momentum:
· DIF(-17.36) < DEA(-95.76), MACD histogram is negative (-11.6)
· Although the gap between DIF and DEA has narrowe
ETH2.24%
View Original
post-image
  • Reward
  • Comment
  • Repost
  • Share
Taking chances is the fastest shortcut to Get Liquidated. #ETH反弹在即?
ETH2.24%
View Original
post-image
  • Reward
  • Comment
  • Repost
  • Share
ETH October 21 Market Analysis
1. Trend Analysis
· The bearish pattern remains: the price is below key moving averages such as EMA10, EMA20, and EMA72.
· Short-term support test: The current price is slightly above EMA5(3,936.38), testing this short-term support.
· Key Position: The price is oscillating in the range of 3,920-3,950, at a critical point for choosing a direction.
· Long-term support: EMA180(3,831.00) is still an important long-term support.
2. MACD Indicator Analysis - Important Trend Reversal Signals
· Golden cross initially formed: MACD turned positive (+0.43), DIF(+0.42) has c
ETH2.24%
View Original
post-image
  • Reward
  • 1
  • Repost
  • Share
BankOfChinaReviewvip:
Just go for it💪
ETH Market Analysis on October 20
1. Trend Analysis
· Bearish pattern confirmed: Price is below all short- to medium-term EMAs (EMA5, EMA10, EMA20, EMA72)
· Key position contest: The current price of 3,931.34 is almost overlapping with the EMA5 of 3,934.70, testing this short-term resistance.
· Deep correction status: Down from the peak of 4,772.54 to the current price level, a decline of over 17%.
· Unique Support: Only EMA180(3,626.83) still provides long-term support
2. MACD Indicator Analysis
· Strong bearish signal:
· DIF(-112.37) < DEA(-85.28), MACD histogram is negative (-27.09)
· T
ETH2.24%
View Original
post-image
  • Reward
  • Comment
  • Repost
  • Share
BTC Market Analysis on October 19
1. Trend Analysis
· Clear bearish pattern: Price is below all EMAs, showing a complete bearish alignment.
· Deep correction status: dropped from the high of 132,574.5 to the current 107,037.1, a decline of about 19%
· Key Position: The price is testing the support near 107,000, but the overall trend remains bearish.
2. MACD Indicator Analysis
· Strong bearish signal:
· MACD value -1508.9 shows strong bearish momentum
· DIF(-1873.4) is significantly lower than DEA(-363.5), with a huge difference.
· This is a typical signal of accelerated downtrend.
3. Vo
BTC-0.26%
View Original
post-image
  • Reward
  • Comment
  • Repost
  • Share
A wave of market trends, a single trade, regardless of success or failure, is just a drop in the ocean among the millions of trades in your long career. Do not be elated by a single success, nor be overly distressed by a single failure. A calm heart is always the strongest weapon for a professional trader. When you become impatient, blind, fearful, and anxious due to changes in the market and assets, whether you gain or lose, you have already lost. The waves of the market will amplify your emotions infinitely, leaving you exhausted before delivering a fatal blow!
View Original
  • Reward
  • Comment
  • Repost
  • Share
Different people will give you different answers!
View Original
post-image
  • Reward
  • Comment
  • Repost
  • Share
Greed and fear are the two heaviest shackles on a trader's neck. #十月降息预测
View Original
post-image
  • Reward
  • Comment
  • Repost
  • Share
ETH October 18 Market Analysis Daily
1. Key Signal Analysis
1. Price and EMA Trend:
◦ The current price (3865.85) is below all short-term EMAs (EMA5/10/30/72 are all in the 3927-4183 range), indicating a bearish short-term trend, but the price has rebounded from the low of 3275, showing that there is buying support below.
◦ Key support: EMA180 (3619.73) and the previous low of 3275 form a strong support zone; if this area is broken, it may open up downside potential.
◦ Key resistance: EMA72 (4112.96) and EMA30 (4183.73) form recent pressure, and a significant breakout is needed to revers
ETH2.24%
View Original
post-image
  • Reward
  • Comment
  • Repost
  • Share
ETH October 17 Market Analysis
1. Trend Analysis
· Clear bearish pattern: Price is below all short to medium-term EMAs (EMA5, EMA10, EMA20, EMA72)
· Unique Support: Only EMA180(3,618.17) still provides long-term support.
· Bearish moving average alignment: EMA5 < EMA10 < EMA20 < EMA72, presenting a standard bearish trend.
· Significant decline from a high: dropped from a peak of 4,765 to the current price level, a decrease of over 17%
2. Price Position Analysis
· Key support test: After gaining initial support at 3,823.50 (24-hour low), the price slightly rebounds.
· Strong resistance: The d
ETH2.24%
View Original
post-image
  • Reward
  • 4
  • 1
  • Share
Hll2004vip:
let's see we are waiting but
View More
  • Trending TopicsView More
  • Pin
Trade Crypto Anywhere Anytime
qrCode
Scan to download Gate App
Community
English
  • 简体中文
  • English
  • Tiếng Việt
  • 繁體中文
  • Español
  • Русский
  • Français (Afrique)
  • Português (Portugal)
  • Bahasa Indonesia
  • 日本語
  • بالعربية
  • Українська
  • Português (Brasil)