

#BitcoinHitsBearMarketLow
Bitcoin Plunges to New Bear Market Low: Deep Dive Market Analysis & Trader Sentiment – February 5, 2026
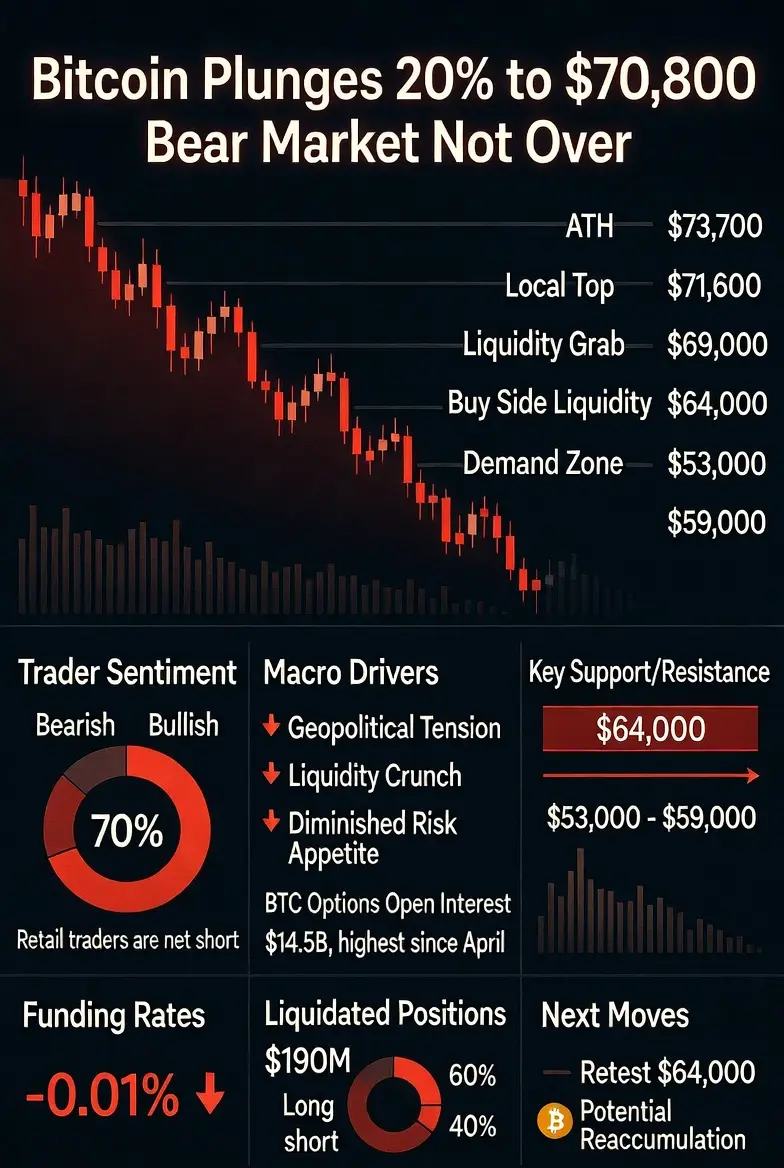
Bitcoin has officially entered a deeper phase of its 2026 bear market, breaking through multiple support levels and touching a new cycle low near $70,696–$70,928 in early February sessions. In the past 24 hours alone, BTC has dropped roughly 7.5–8%, with intraday lows briefly testing below $70,800 amid relentless selling pressure.
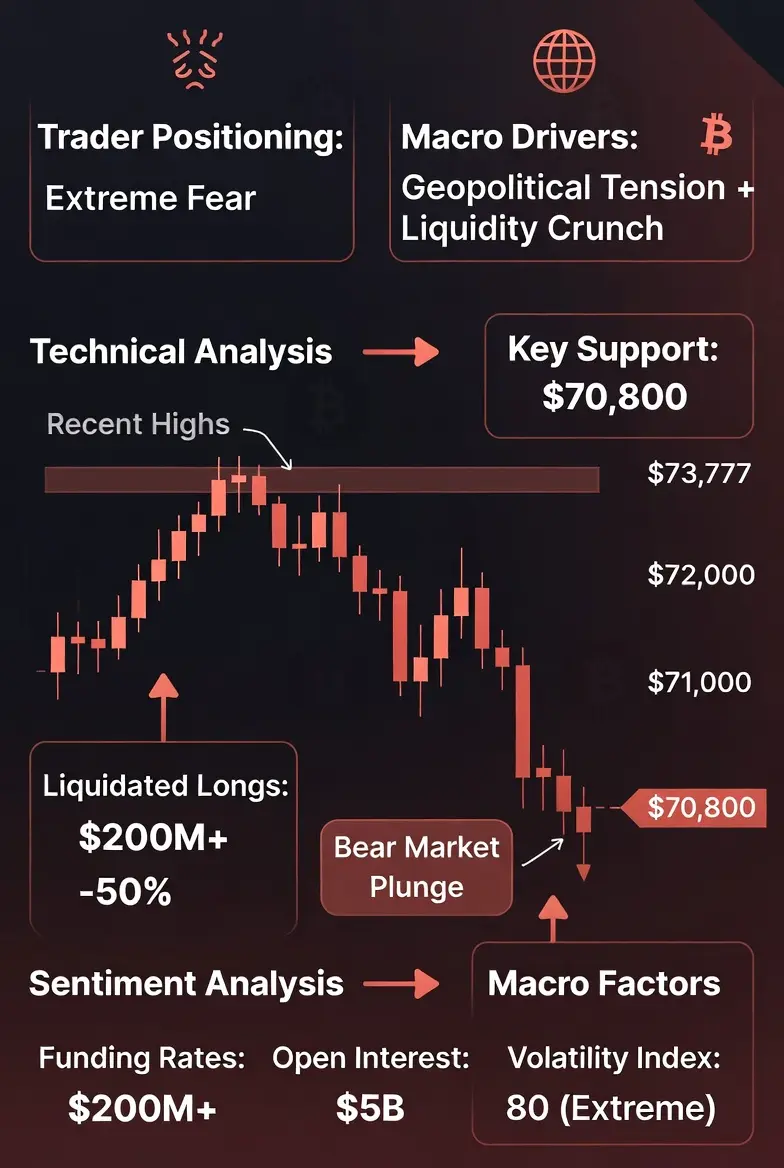
The Crypto Fear & Greed Index has plummeted to 12, indicating extreme fear—the lowest in recent months. Panic, capitulation, and the evaporation of bullish conviction are evident across both retail and institutional desks. Traders are navigating a market defined by thin liquidity, elevated leverage, and extreme volatility, where even minor sell-offs amplify price drops.
Current Market Snapshot & Key Metrics (as of February 5, 2026)
Spot Price: ~$70,800–$71,000 (down ~7.5–8% in 24h, ~10–12% over 7 days)
24h Trading Volume: ~$74–$75 billion (elevated due to panic but underlying liquidity thin)
Market Cap: ~$1.46–$1.47 trillion (hundreds of billions lost in days)
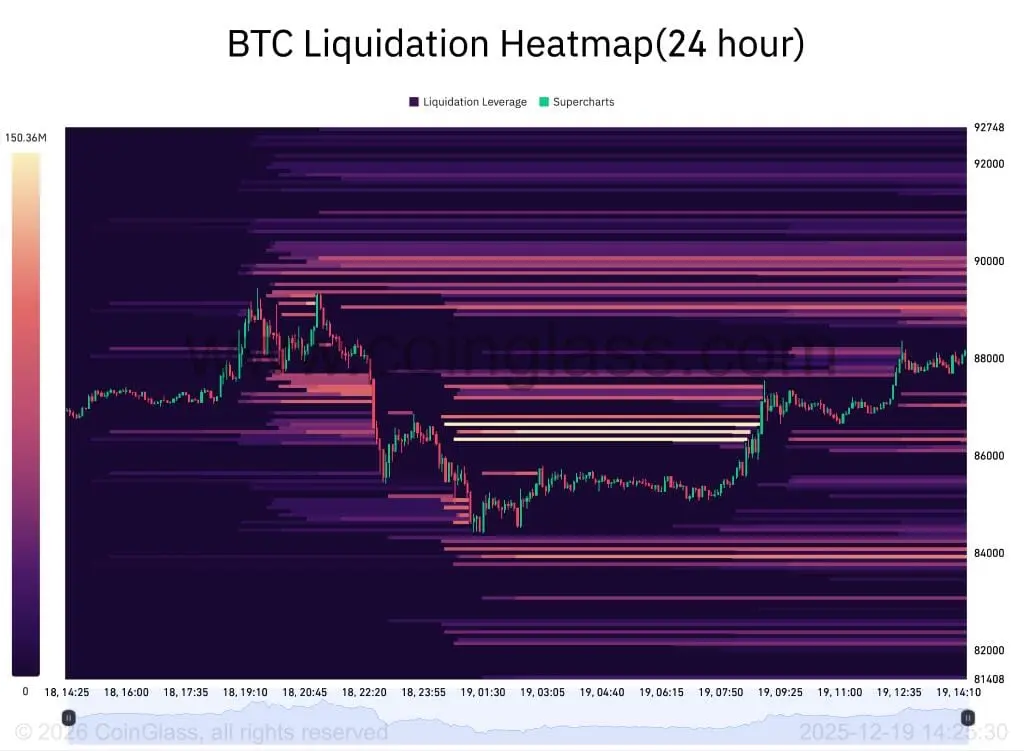
24h Liquidations: High, primarily forced exits of long positions
Dominance: BTC dominance holding firm or slightly rising as alts bleed more
Open Interest (Futures/Perps): Falling sharply, signaling deleveraging
Technical Levels & Price Zones
Immediate 24h Low: $70,696 (broken decisively)
Short-Term Resistance (Bounce Attempts): $72,610 (failed multiple times), $73,000–$74,000
Next Major Support Zone: $68,000–$70,000 (psychological + prior consolidation)
Critical Long-Term Support: 200-week moving average (~$57,900–$58,000)
Deeper Downside Targets: $65,000 (long-term holder cost basis cluster), $60,000–$68,000 (analyst consensus floor in extreme scenarios)
What’s Driving This Bear Market? Multi-Layered Factors
1. Global Risk-Off & Macro Headwinds
Geopolitical flare-ups in the Middle East, U.S. political uncertainty (partial government shutdown effects delaying CPI/PPI releases), and renewed tech equity weakness are crushing risk assets. Bitcoin, despite its “digital gold” narrative, continues trading like a high-beta tech proxy, closely correlating with Nasdaq and major tech names. Even positive economic data, like ISM Manufacturing PMI beating expectations, is being ignored in favor of fear-driven selling.
2. Liquidity Crunch & Volume Collapse
Spot trading volumes have halved from ~$2 trillion (Oct 2025) to ~$1 trillion in early 2026, according to reports. This thin liquidity magnifies price swings—moderate sell pressure causes outsized declines. ETF outflows, treasury selling from public companies, and miner pressures have removed billions in steady demand.
3. Technical Breakdown & Momentum Shift
BTC has violated the Ichimoku Cloud, flashed bearish Kumo twists, and broken multi-month trendlines. Momentum indicators like RSI and MACD are deeply oversold but have not yet formed clear reversal divergence. On-chain data points to long-term holder capitulation risks if BTC sustains below $73k–$74k. Historical comparisons indicate that the 200WMA (~$58k) has consistently marked major bear market bottoms since 2015. Analysts suggest realistic floors between $60k–$68k absent a broader equity crash.
4. Leverage Flush & Forced Selling Cascade
Elevated liquidations, primarily of leveraged long positions, are fueling the downside. Funding rates have turned negative, incentivizing shorts and punishing holders. This deleveraging phase mirrors classic crypto winter dynamics, similar to the 2022 post-ATH drawdown.
5. Altcoin & Broader Market Weakness
Altcoins are down 10–20%+ in the same window, with ETH, SOL, and others underperforming BTC. The post-2025 halving optimism fueled by ETFs and policy bets has fully reversed. Historical cycles suggest drawdowns of 40–60% from peaks are normal; current BTC levels place us in the early-to-mid bear phase.
Trader Sentiment & Current Thinking
Extreme Bearish Vibes (Capitulation Mode):
Many traders are accepting the deep bear market; on-chain data shows weak spot demand, fading participation, and long-term holder selling.
Shorts dominate; funding rates are negative. Breaks of higher-lows confirm downside structure. Some traders see $60k, $57k (200WMA), or even $50k–$40k if macro risks persist.
Capitulation Hopes (Potential Local Bottom):
Some contrarian traders view this as classic capitulation—extreme fear often signals local lows.
High-volume liquidation spikes, panic selling, and “sub-$70k” price calls create maximum scare, historically followed by relief rallies (mid-$60k wicks possible before rebounds).
Mixed/Contrarian Views:
Some traders note BTC dominance is declining, altcoins could bottom and outperform.
Monthly EMA structures remain technically bullish.
Institutional surveys show 70% consider BTC undervalued, and 62% have held or increased positions despite bear sentiment.
Trader Plans & Forward Scenarios
Bear Case (Most Likely Currently):
If $72k–$73k support is decisively broken, next targets: $68k–$70k (psychological), $65k (long-term holder cost basis), $58k–$60k (200WMA).
Prolonged bear market into Q3 2026 is possible if macro conditions stay adverse (Fed hold, geopolitics, liquidity crunch).
Strategy: Hold shorts, sell rallies, manage risk tightly.
Base/Neutral Case:
Frustrating consolidation in $70k–$75k range.
Short squeeze possible if $73k–$74k reclaimed, relief bounce to $82k–$85k.
Strategy: Buy lows, sell highs, monitor macro trends.
Bull Reversal Triggers:
Extreme fear + capitulation, new demand from ETF inflows, macro calm.
Sharp rebound possible; reclaiming $86k–$88k signals bullish flip.
Some traders scaling long positions, anticipating potential 2026 recovery.
Key Takeaways for Investors & Traders
Volatility remains extreme—expect sharp moves in either direction.
Liquidity monitoring is crucial; thin markets amplify price swings.
Risk management is critical—tight stops, reduced position sizing, and avoidance of revenge trading.
Extreme Fear historically precedes rebounds, but timing is unpredictable.
Market dynamics are textbook risk-off capitulation: macro fear + thin liquidity + leverage flush = amplified downside.
Bitcoin’s path over the next weeks will be shaped by macro developments, liquidity conditions, and trader sentiment. Overshoots to the downside are possible before any meaningful recovery.
Bitcoin Plunges to New Bear Market Low: Deep Dive Market Analysis & Trader Sentiment – February 5, 2026
Bitcoin has officially entered a deeper phase of its 2026 bear market, breaking through multiple support levels and touching a new cycle low near $70,696–$70,928 in early February sessions. In the past 24 hours alone, BTC has dropped roughly 7.5–8%, with intraday lows briefly testing below $70,800 amid relentless selling pressure.
The Crypto Fear & Greed Index has plummeted to 12, indicating extreme fear—the lowest in recent months. Panic, capitulation, and the evaporation of bullish conviction are evident across both retail and institutional desks. Traders are navigating a market defined by thin liquidity, elevated leverage, and extreme volatility, where even minor sell-offs amplify price drops.
Current Market Snapshot & Key Metrics (as of February 5, 2026)
Spot Price: ~$70,800–$71,000 (down ~7.5–8% in 24h, ~10–12% over 7 days)
24h Trading Volume: ~$74–$75 billion (elevated due to panic but underlying liquidity thin)
Market Cap: ~$1.46–$1.47 trillion (hundreds of billions lost in days)
24h Liquidations: High, primarily forced exits of long positions
Dominance: BTC dominance holding firm or slightly rising as alts bleed more
Open Interest (Futures/Perps): Falling sharply, signaling deleveraging
Technical Levels & Price Zones
Immediate 24h Low: $70,696 (broken decisively)
Short-Term Resistance (Bounce Attempts): $72,610 (failed multiple times), $73,000–$74,000
Next Major Support Zone: $68,000–$70,000 (psychological + prior consolidation)
Critical Long-Term Support: 200-week moving average (~$57,900–$58,000)
Deeper Downside Targets: $65,000 (long-term holder cost basis cluster), $60,000–$68,000 (analyst consensus floor in extreme scenarios)
What’s Driving This Bear Market? Multi-Layered Factors
1. Global Risk-Off & Macro Headwinds
Geopolitical flare-ups in the Middle East, U.S. political uncertainty (partial government shutdown effects delaying CPI/PPI releases), and renewed tech equity weakness are crushing risk assets. Bitcoin, despite its “digital gold” narrative, continues trading like a high-beta tech proxy, closely correlating with Nasdaq and major tech names. Even positive economic data, like ISM Manufacturing PMI beating expectations, is being ignored in favor of fear-driven selling.
2. Liquidity Crunch & Volume Collapse
Spot trading volumes have halved from ~$2 trillion (Oct 2025) to ~$1 trillion in early 2026, according to reports. This thin liquidity magnifies price swings—moderate sell pressure causes outsized declines. ETF outflows, treasury selling from public companies, and miner pressures have removed billions in steady demand.
3. Technical Breakdown & Momentum Shift
BTC has violated the Ichimoku Cloud, flashed bearish Kumo twists, and broken multi-month trendlines. Momentum indicators like RSI and MACD are deeply oversold but have not yet formed clear reversal divergence. On-chain data points to long-term holder capitulation risks if BTC sustains below $73k–$74k. Historical comparisons indicate that the 200WMA (~$58k) has consistently marked major bear market bottoms since 2015. Analysts suggest realistic floors between $60k–$68k absent a broader equity crash.
4. Leverage Flush & Forced Selling Cascade
Elevated liquidations, primarily of leveraged long positions, are fueling the downside. Funding rates have turned negative, incentivizing shorts and punishing holders. This deleveraging phase mirrors classic crypto winter dynamics, similar to the 2022 post-ATH drawdown.
5. Altcoin & Broader Market Weakness
Altcoins are down 10–20%+ in the same window, with ETH, SOL, and others underperforming BTC. The post-2025 halving optimism fueled by ETFs and policy bets has fully reversed. Historical cycles suggest drawdowns of 40–60% from peaks are normal; current BTC levels place us in the early-to-mid bear phase.
Trader Sentiment & Current Thinking
Extreme Bearish Vibes (Capitulation Mode):
Many traders are accepting the deep bear market; on-chain data shows weak spot demand, fading participation, and long-term holder selling.
Shorts dominate; funding rates are negative. Breaks of higher-lows confirm downside structure. Some traders see $60k, $57k (200WMA), or even $50k–$40k if macro risks persist.
Capitulation Hopes (Potential Local Bottom):
Some contrarian traders view this as classic capitulation—extreme fear often signals local lows.
High-volume liquidation spikes, panic selling, and “sub-$70k” price calls create maximum scare, historically followed by relief rallies (mid-$60k wicks possible before rebounds).
Mixed/Contrarian Views:
Some traders note BTC dominance is declining, altcoins could bottom and outperform.
Monthly EMA structures remain technically bullish.
Institutional surveys show 70% consider BTC undervalued, and 62% have held or increased positions despite bear sentiment.
Trader Plans & Forward Scenarios
Bear Case (Most Likely Currently):
If $72k–$73k support is decisively broken, next targets: $68k–$70k (psychological), $65k (long-term holder cost basis), $58k–$60k (200WMA).
Prolonged bear market into Q3 2026 is possible if macro conditions stay adverse (Fed hold, geopolitics, liquidity crunch).
Strategy: Hold shorts, sell rallies, manage risk tightly.
Base/Neutral Case:
Frustrating consolidation in $70k–$75k range.
Short squeeze possible if $73k–$74k reclaimed, relief bounce to $82k–$85k.
Strategy: Buy lows, sell highs, monitor macro trends.
Bull Reversal Triggers:
Extreme fear + capitulation, new demand from ETF inflows, macro calm.
Sharp rebound possible; reclaiming $86k–$88k signals bullish flip.
Some traders scaling long positions, anticipating potential 2026 recovery.
Key Takeaways for Investors & Traders
Volatility remains extreme—expect sharp moves in either direction.
Liquidity monitoring is crucial; thin markets amplify price swings.
Risk management is critical—tight stops, reduced position sizing, and avoidance of revenge trading.
Extreme Fear historically precedes rebounds, but timing is unpredictable.
Market dynamics are textbook risk-off capitulation: macro fear + thin liquidity + leverage flush = amplified downside.
Bitcoin’s path over the next weeks will be shaped by macro developments, liquidity conditions, and trader sentiment. Overshoots to the downside are possible before any meaningful recovery.